MSA Jobs Data Show Hiring Losing Momentum
- The latest MSA jobs data reveal a much weaker recovery across much of the country.
- The latest data include benchmark revisions to data prior to April 2023 and show a much slower trajectory since that date.
- The greater New York City area is a notable exception, with only minor revisions evident.
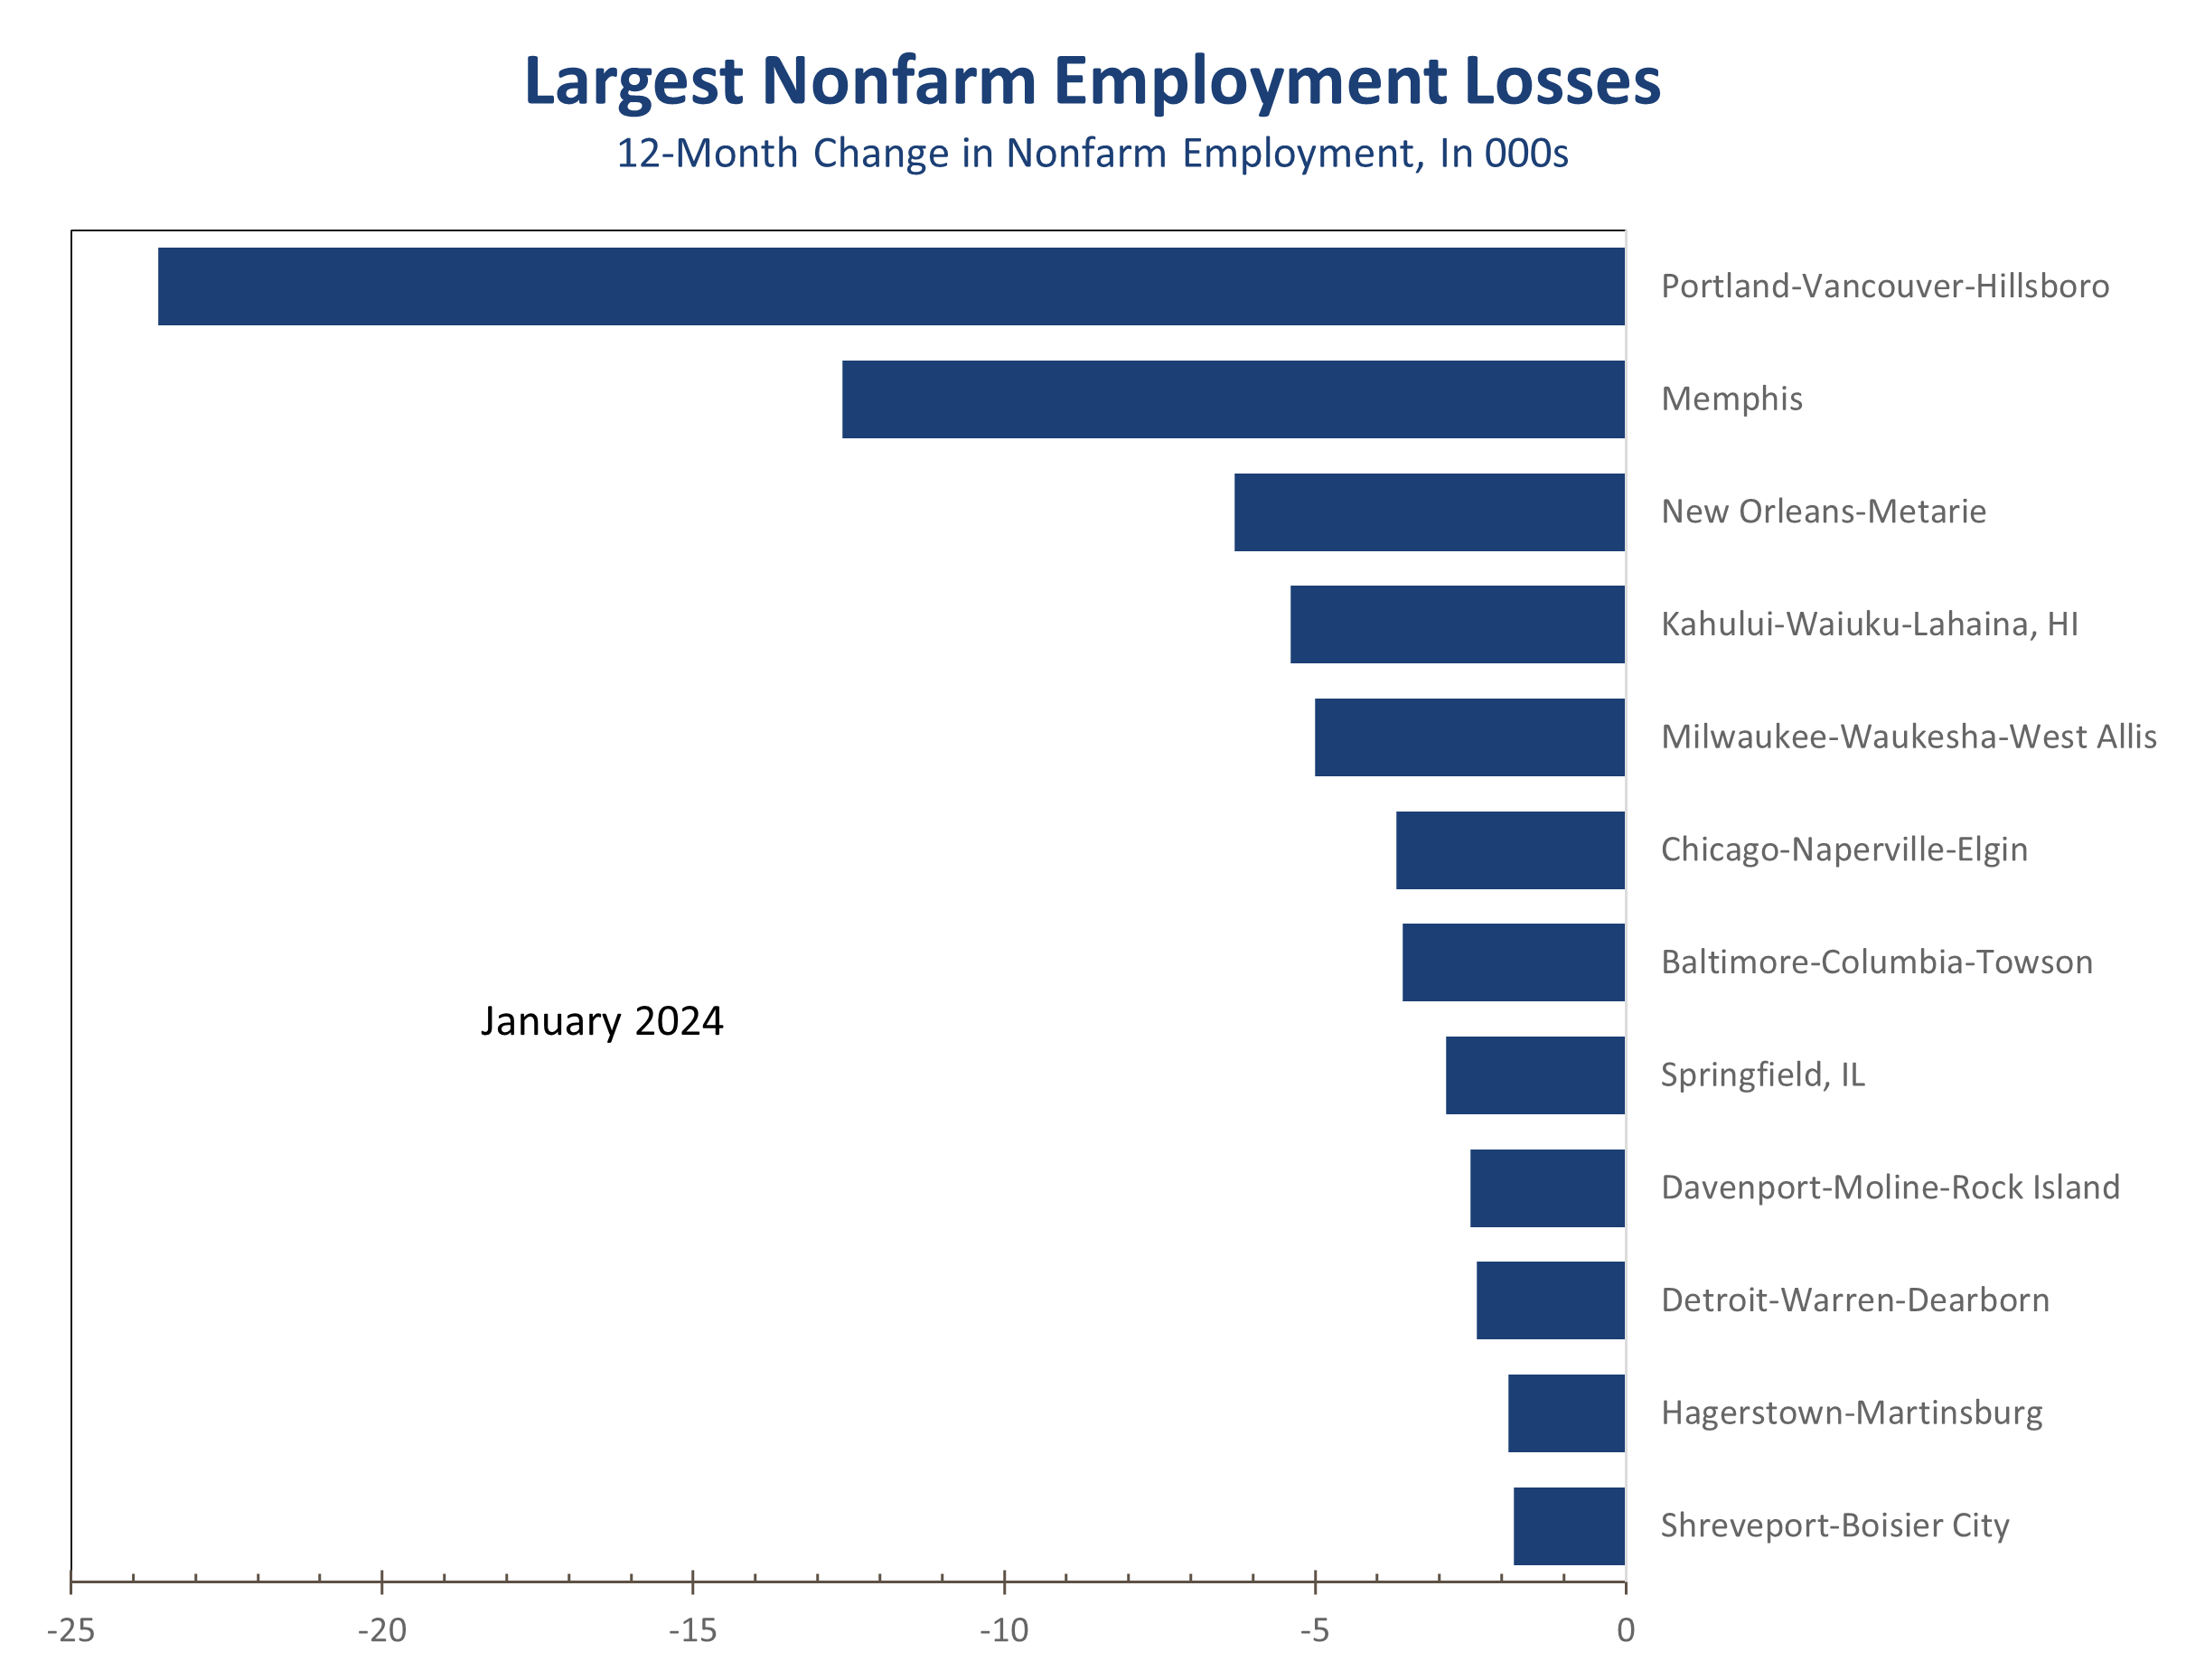
- Job growth is significantly slower in manufacturing-intensive metros. Detroit now shows a slight year-to-year job decline, as do Chicago and Milwaukee, instead of the solid job gains reported in the preliminary data.
- Portland, Oregon is another notable weak spot. Nonfarm payrolls plunged 1.9% over the past year, as employers cut 23,600 jobs.
- Job growth was also notably weaker in the South, with Atlanta, Charlotte, Nashville, and Raleigh adding about half as many jobs as the preliminary data had reported.
- We feel the latest MSA jobs data provide a more accurate assessment of the labor market, which is cooling significantly faster than the monthly national payroll data suggest. The latest QCEW data through September suggest job growth nationally is overstated by at least 800,000 jobs, which means the nation is currently adding just 174,000 jobs per month rather than the now widely assumed 228,000 jobs per month pace.
This morning release of the MSA employment data for January 2024 bolster the case that the widely followed monthly national Nonfarm employment data are significantly overstated. The latest state and local employment data include benchmark revisions to data prior to April 2023 and show a much slower trajectory since that date that closely mirror the most recent QCEW data, which are the source data for the annual revisions.
State & Metro Area employment data show job growth slowed significantly across the country.
The Sum of the States data shows nonfarm employment growth slowing to just a 1.4% pace and closely match the QCEW data reported through September. The CES data which are reported the first Friday of the month show job growth averaging a stronger 1.9% pace. The difference is roughly 800,000 jobs and would reduce job growth to an average of 174,000 job per month over the past year, compared to the currently report 228,000 jobs per month.
Differences between national and local economic data are not unusual. What we see peculiar today is the unusual timing of the split and consistency of the divergence between the two series.

From a timing perspective, the national Current Employment Statistics (CES) data, the series published the first Friday of each month, were just revised in January to the March 2023 benchmark. That benchmark was largely based on the Quarterly Census of Employment and Wages (QCEW) data through March of last year. At the time of the revision, data were also available through June and the CES data math up closely with those data, rising 2.41% year-to-year compared to a 2.39% in the QCEW series.
We suspect the national nonfarm payroll growth are now significantly overstated.
Just two weeks after the January employment report, however, QCEW data were released through September, which diverged significantly from the CES figures. While the monthly CES showed 2.1% year-to-year job growth from June to September, QCEW data indicated only 1.5% growth. We noted the unusual divergence from the benchmark revision’s direction in our January and February employment commentaries. National nonfarm job growth through March 2023 were revised lower by 0.2 percentage points but were revised higher for the second half of last year.
The AI-driven stock market rebound hinted the economy might be on the verge of a rebound in hiring, lending some support to the stronger second half jobs numbers. The recent metro area jobs data, however, cast doubt on this theory. San Francisco and Silicon Valley saw sharp downward revisions to job growth, with San Jose/Silicon Valley now showing a 0.1% year-to-year employment decline.
Many manufacturing-intensive metro areas, including Detroit, Chicago, and Milwaukee along with several smaller Midwest metros like Elkhart-Goshen, Kokomo, and Columbus, Indiana, experienced substantial job declines, aligning with soft ISM manufacturing data.
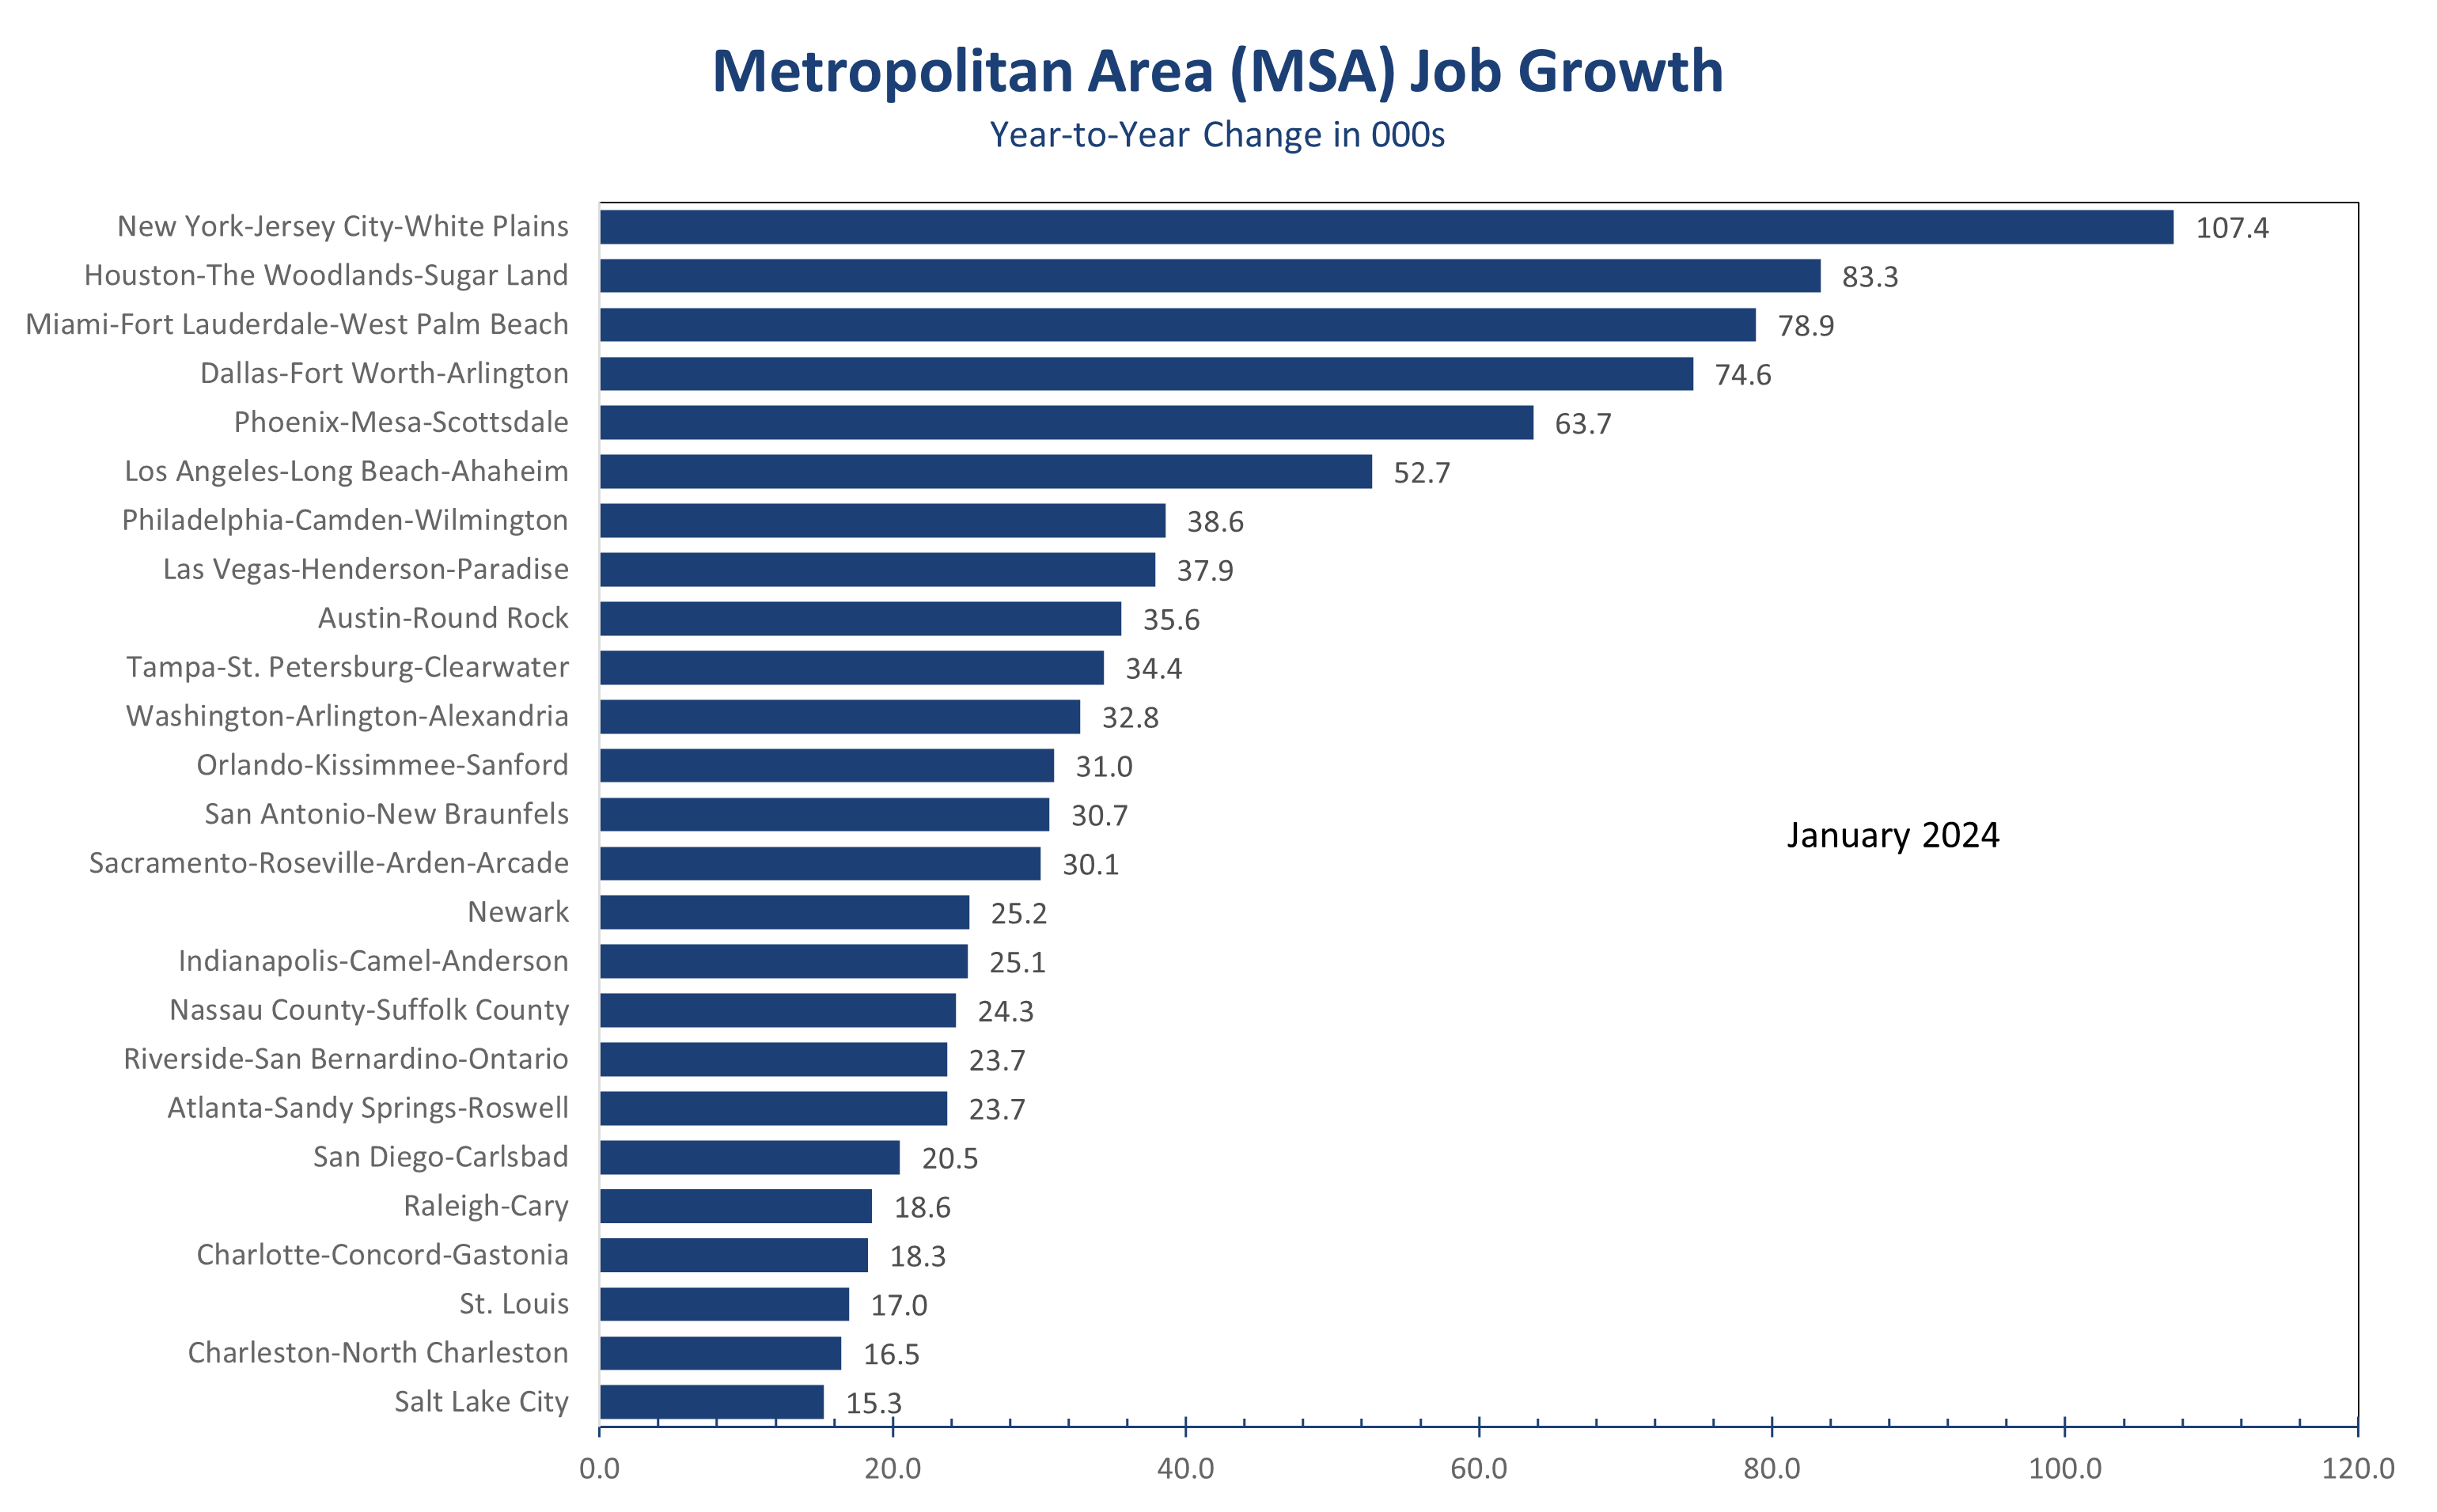
On the plus side, New York City, the Texas major metros, and Florida’s largest MSAs all remain bright spots. New York City added 160,100 jobs, while Houston added 83,300, and 78,900 jobs were added in South Florida.
Job growth was revised lower in many fast-growing metro areas, particularly in the Southeast, with hiring now up roughly half as much as initially reported in Atlanta, Nashville, Charlotte, Raleigh, and Jacksonville.
The weaker state and local jobs data suggests a soft landing remains in play, albeit with slightly higher-than-expected inflation. We anticipate a further slowing in job growth in coming months, with payroll growth decelerating to around 130,000 jobs per month by mid-year. This should pave the way for a rate cut at the late June FOMC meeting.
Disclaimer: This publication has been prepared for informational purposes only and is not intended as a recommendation offer or solicitation with respect to the purchase or sale of any security or other financial product nor does it constitute investment advice.
Mark Vitner, Chief Economist
Piedmont Crescent Capital
(704) 458-4000