
September Employment Report: The Calendar Nets Out
Payrolls Rose 29,000 and July and August Were Revised Down a Combined 60,000, Leaving the Five Months From May Through September Averaging 49,000. The Unadjusted Summer Roll-Off in Leisure & Hospitality Was Unusually Small, but Re-Estimated Seasonal Factors Took Most of the Payoff, Breadth Narrowed and Our Call for the Fed Is Unchanged
Early Signal
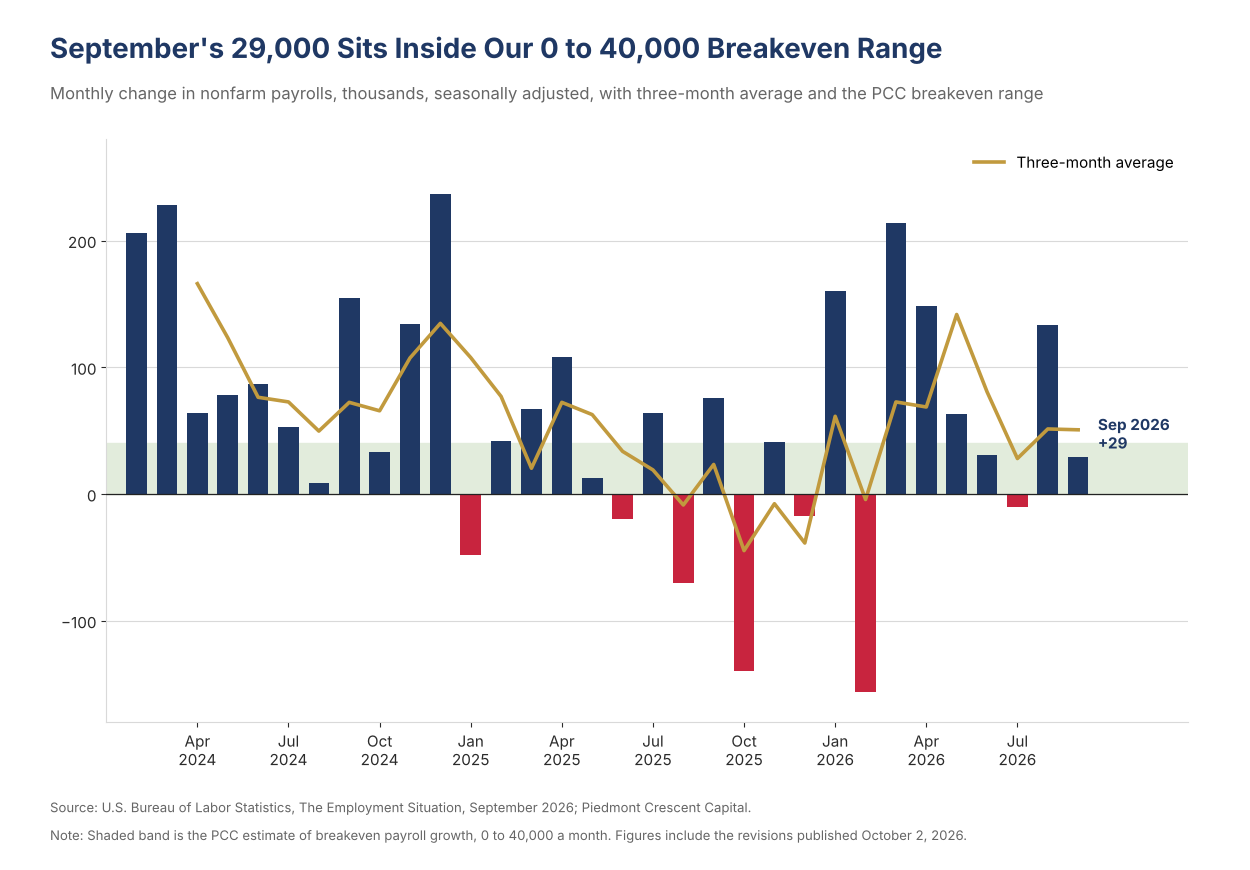
- Nonfarm payrolls rose 29,000 in September, well short of a consensus near 85,000, and revisions took 60,000 jobs out of July and August. July now shows a decline of 10,000 from a gain of 21,000 and August a gain of 133,000 from 162,000, so the three-month average is 51,000 against 71,000 a month ago. The five months from May through September, a stretch bent by the earliest Memorial Day and the latest Labor Day, averaged 49,000 a month, close to the 45,000 average of the twelve months through August. Private payrolls rose 46,000 and government lost 17,000.
- The seasonal argument we made in August held in the unadjusted data and lost most of its payoff to the seasonal factors. Before seasonal adjustment leisure & hospitality shed 454,000 jobs from August to September, fewer than in any September from 2017 to 2025 outside the pandemic years, and restaurants and bars account for about four-fifths of the shortfall against the 514,000 average of the past three Septembers. The seasonal factors, however, implied a roll-off of about 464,000, between 52,000 and 80,000 less than in each of the last three years, so the adjusted gain was 10,000 against the 80,000 that the average of those years' factors would have produced.
- Our call for a strong August or September remains right, with August the hot month and September softer as the unwind arrived through the revisions. August cleared the 125,000 bar we set on August 23 at 133,000 even after revision. Leisure & hospitality accounts for 42,000 of the 60,000 downward revision to July and August, and local government education, where we looked for part of August's gain to come back out in September, gave back only 1,800 after an August gain revised up to 49,300.
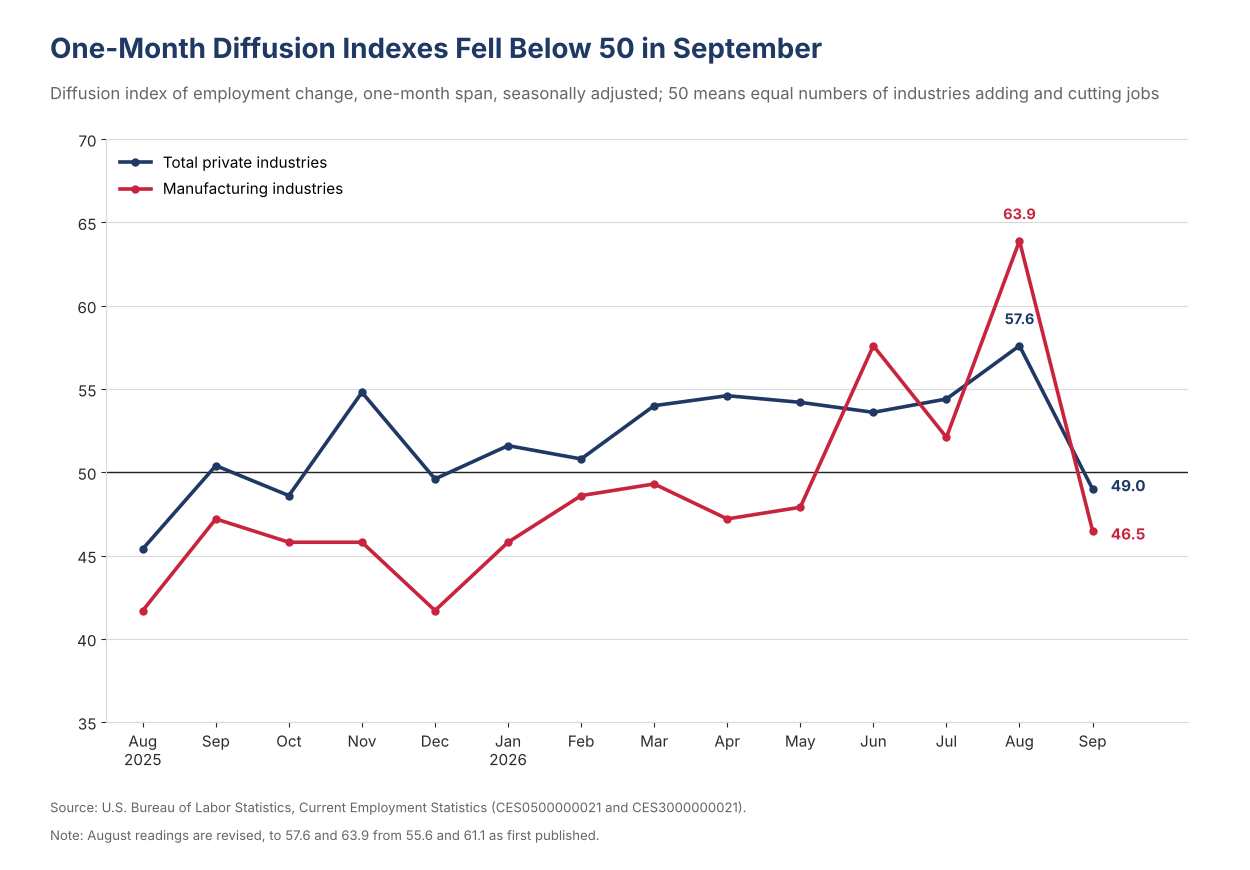
- Set aside leisure & hospitality and local government education and payrolls rose about 21,000 in September and 47,000 in August, an average of 34,000 that sits inside our breakeven range of zero to 40,000. Hiring breadth narrowed, with the one-month private diffusion index at 49.0 from 57.6, its first reading below 50 since December, and the manufacturing index at 46.5 from 63.9. Both are one-month readings, and the six-month indexes, at 54.8 for private industries, unchanged, and 52.8 for manufacturing, up from 51.4, held up.
- Manufacturing payrolls rose 9,000 and are up 72,000 from December's low, and construction added 11,000. Machinery (+4,500) and plastics & rubber products (+4,600) led the factory gains, the ISM employment index rose to 52.7 for a third month above the 50.3 threshold ISM associates with rising factory payrolls, and nonresidential specialty trade contractors added 12,300 jobs while residential specialty trades lost 7,900.
- Health care added 17,000 jobs, about half its 33,000 average of the past twelve months, and the losses were concentrated in white-collar industries. Information lost 10,000 jobs, professional & business services 9,000 and financial activities 7,000, which leaves financial activities 129,000 below its May 2025 peak, 90,000 of it in insurance carriers. Local government outside education lost 10,600.
- The unemployment rate rose to 4.2% from 4.1%, and all of the rise came from reentrants and new entrants, as job losers declined. Reentrants rose 152,000 and new entrants 116,000, together 268,000, while job losers fell 45,000 to 3.2 million and job leavers fell 173,000. Unrounded the rate moved to 4.18% from 4.14% on a labor force that grew 485,000. Participation rose to 61.8% from 61.6% and 61.4% in July, and household employment rose 406,000.
- Average hourly earnings rose 5 cents, or 0.1%, to $37.81 and are up 3.0% over the past year, the slowest pace of the year. The private workweek held at 34.4 hours and the index of aggregate weekly hours was unchanged after rising in August, so hours added nothing further this month. Initial claims fell to 197,000 in the week ended September 26, the lowest since July. We hold our call for a pause on October 27-28 and a quarter-point increase on December 9. Bond yields fell following the report but a stronger economy in 2027 may see yields retest the highs reached over the past two weeks.
- Hours plus productivity point to third-quarter GDP growth of 2.7% to 3.5%. Hours worked rose at a 1.3% annual rate over the past three months, with the longer workweek doing most of the work, and productivity growth of 2.2% over the past year puts our proxy near 3.5%, or 2.7% at the second quarter’s slower productivity pace, against GDP growth of 2.2% in the second quarter.
The Calendar Argument, Scored
We said on August 10 to expect a surprisingly strong employment report in one or both of August and September, and on August 23 we put the bar at 125,000. August cleared it even after revision, at 133,000 against the 162,000 first reported, and September did not, at 29,000. We score the call as made, because August cleared the bar and September carried the unwind through the revisions, so the October data should be clear of this summer’s distortions. Payrolls added 152,000 over July through September, an average of 51,000 a month, and 246,000 over the five months from May through September, an average of 49,000, a span in which the earliest Memorial Day and the World Cup pulled hiring forward and the latest Labor Day delayed the roll-off. A distortion that nets out over a few months is what seasonal factors are built to do over a full year, and most of this is now behind us.
The mechanism we described in August has two halves, and the unadjusted data support both. Restaurants and bars hired more people in May and did not hire as many people as they usually do in June and July. They therefore have far fewer people to let go as the summer winds down in August and September. The seasonal factors for leisure and hospitality jobs in August and September compensate for jobs that are expected to decline. Since fewer jobs were added during the prior two months, the end-of-summer decline will be less than usual, resulting in a larger seasonally adjusted job gain. The first half held, since restaurants and bars added just 16,000 jobs from May to August before seasonal adjustment, against 124,000 in 2023, 55,000 in 2024 and 69,000 in 2025. The second half held in September, when restaurants and bars shed 148,400 against 179,300 last year, 198,500 in 2024 and 209,100 in 2023.
The shortfall in the roll-off was real, and almost all of it was in restaurants and bars. Leisure & hospitality shed 454,000 jobs from August to September before seasonal adjustment (from 17,551,000 to 17,097,000), fewer than in any September from 2017 to 2025 outside the pandemic years of 2020 and 2021 and 60,000 fewer than the 514,000 average of 2023 through 2025. Restaurants and bars lost 148,400, or 47,000 fewer than their three-year average of 195,600, about four-fifths of the shortfall, while arts, entertainment & recreation lost 221,000 against 224,000 to 233,000 in each of the past three Septembers and accommodation lost 84,400.
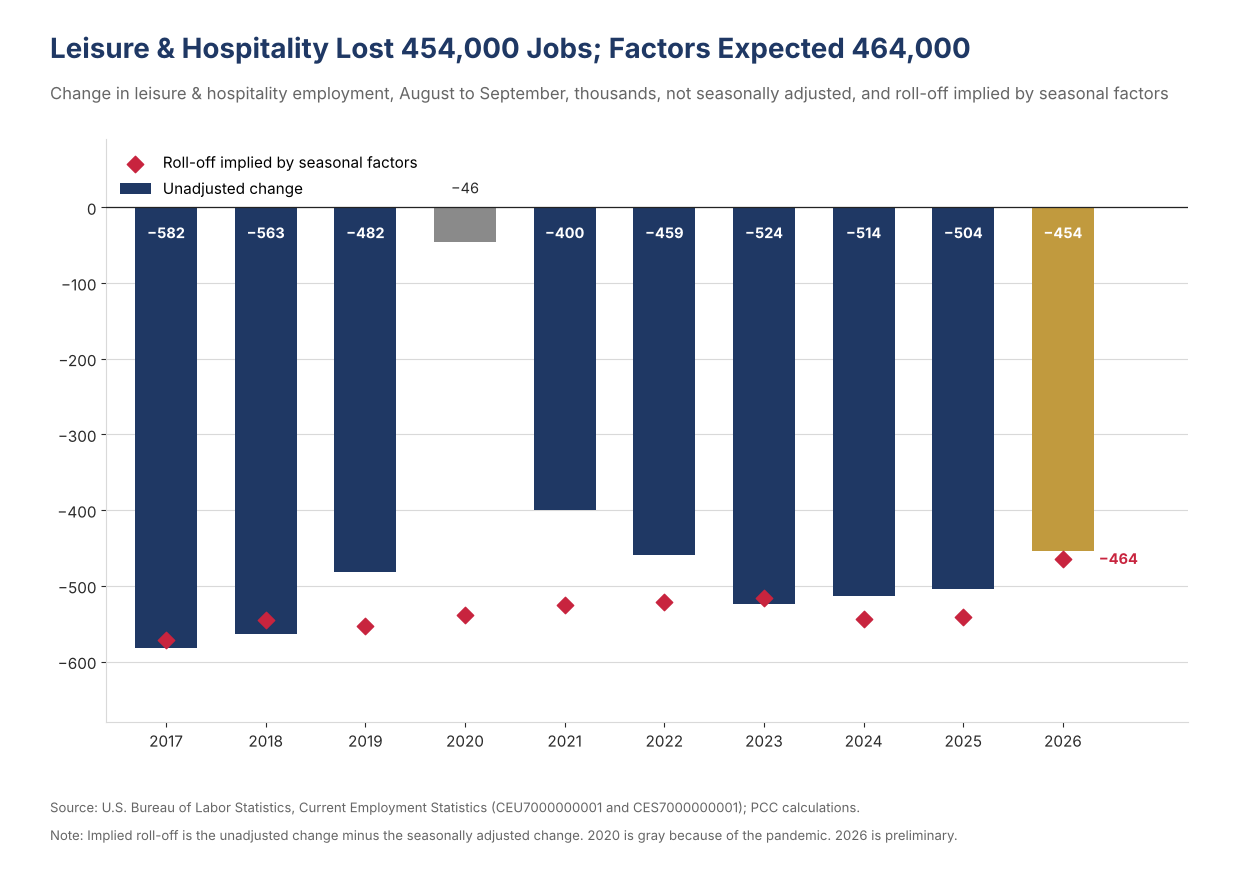
The seasonal factors, however, expected a smaller roll-off this year, and that is where the payoff went. The roll-off the factors implied for leisure & hospitality, the unadjusted change minus the adjusted one, was about 464,000 this September against 516,000 in 2023, 544,000 in 2024 and 541,000 in 2025. Had the factors expected the 534,000 average of those three years, the unadjusted loss of 454,000 would have printed as a gain of about 80,000 instead of 10,000. Restaurants and bars show the same pattern, with an implied roll-off of 159,000 this year against 209,000, 224,000 and 218,000 and an adjusted gain of 10,800. BLS re-estimates the factors with each release, and the August factors went the same way, taking the adjusted August gain in restaurants and bars to 33,800 from the 59,200 first reported. A factor that has seen one unusual summer appears to treat part of it as normal, which shrinks the adjusted payoff in the months where we expected it to be largest.
The unwind arrived through the revisions, and local government education gave back nothing. Of the 60,000 downward revision to July and August, 42,000 is in leisure & hospitality, where July is now a decline of 38,000 and August a gain of 37,000 against first prints of -21,000 and +62,000, and BLS attributes the monthly revisions to additional reports and the recalculation of seasonal factors. Employment in the industry is 16,969,000, 45,000 below May's 17,014,000, so the jobs lost over June and July have not been recovered. We said on September 4 to look for part of local government education's August gain to come back out in September, and it did not, with a decline of 1,800 after an August gain revised up to 49,300. Before adjustment districts added 723,000 workers from August to September, in line with 726,000 in 2025 and 723,000 in 2024.
A Narrower Base of Hiring
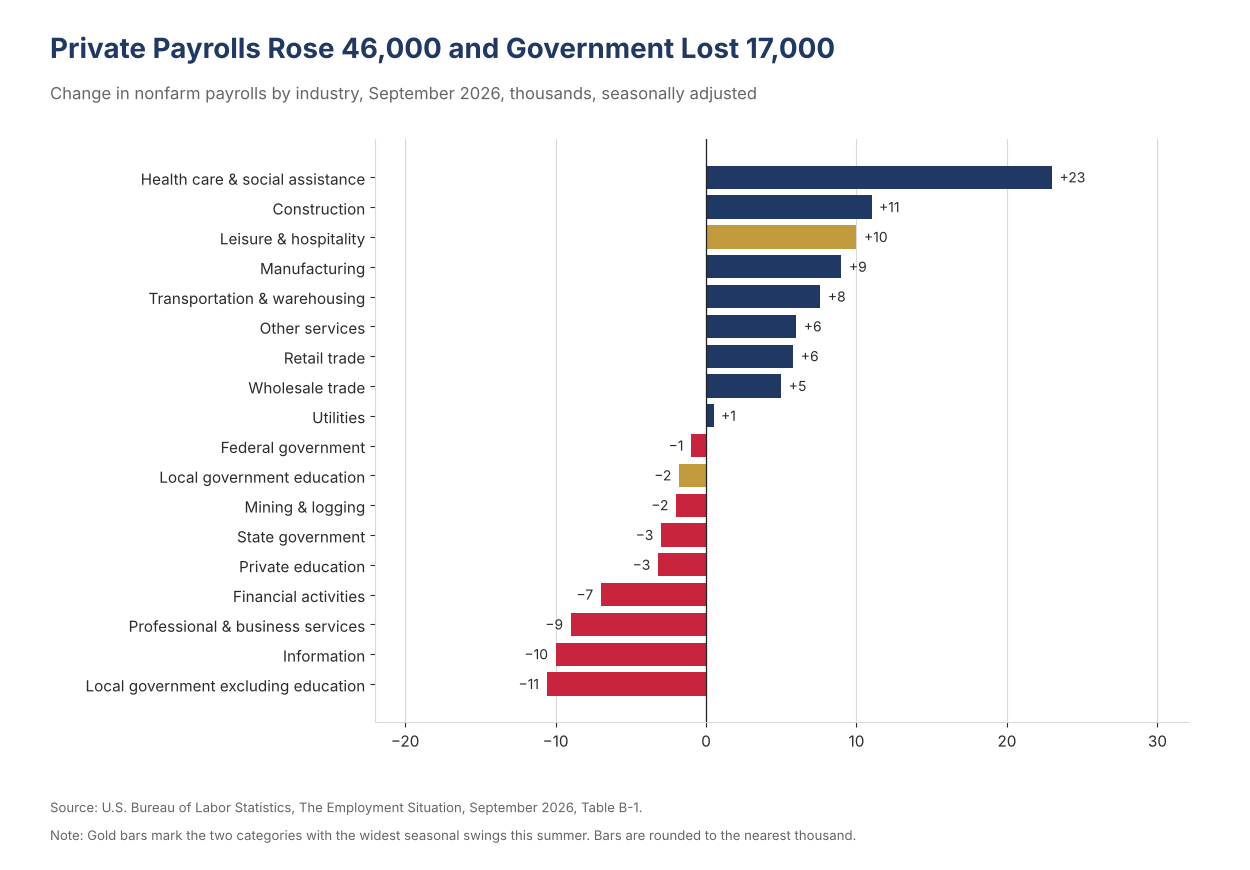
The September weakness was spread across industries, with leisure & hospitality and local government education adding only 8,000 jobs between them. Health care and social assistance supplied 23,000 of the 29,000 gain, construction 11,000 and manufacturing 9,000, while information (-10,000), professional & business services (-9,000), financial activities (-7,000) and local government outside education (-10,600) took away about 37,000. Private payrolls rose 46,000 and government lost 17,000, with federal employment down 1,000, state down 3,000 and local down 13,000.
The one-month diffusion index for private industries fell to 49.0 from 57.6, the first reading below 50 since December. Remember that a diffusion index measures the breadth of hiring and not the magnitude, so the move says that fewer industries added workers in September than in August, when the index was revised up from 55.6 to 57.6, and says little about how many jobs they added. The manufacturing index fell to 46.5 from an upwardly revised 63.9 (61.1 as first published), a swing of 17 points, though June's 57.6 followed a May reading of 47.9, so swings of that size are not unusual in this series. The six-month indexes, which smooth that noise, were 54.8 for private industries, unchanged, and 52.8 for manufacturing, up from 51.4, so the broader trend is intact even if September's breadth was not. This is a key variable to watch next month.
Manufacturing payrolls rose 9,000 and are up 72,000 from December's low, so the factory recovery remains intact in a narrower month. Durable goods added 8,000 and nondurables 1,000, led by machinery (+4,500) and plastics & rubber products (+4,600), while paper (-2,600), furniture (-2,000) and printing (-1,800) gave back jobs. Printing is one of the two industries that ISM reported as contracting in September. July's gain was revised to 20,000 and August's to 15,000, so factory payrolls have added 44,000 over three months, about 15,000 a month. The ISM employment index rose 1.5 points to 52.7 in September, a third month above the 50.3 threshold ISM associates with rising factory payrolls, so the survey and the payroll data agree on direction. The factory workweek held at 40.6 hours with overtime at 3.0, and aggregate weekly hours in manufacturing rose 0.1%. Hiring follows orders by several months, and the ISM new orders index rose to 55.3 in September from 53.7, so we look for small factory gains through the fall.
Construction added 11,000 jobs, and the nonresidential side did the hiring. Nonresidential specialty trade contractors added 12,300 jobs and heavy & civil engineering 2,600, while residential specialty trade contractors lost 7,900. Over the past year nonresidential construction employment (building, heavy & civil engineering and specialty trades) is up 142,000 and residential employment is down 33,000. Heavy & civil engineering, the category that builds data center campuses, substations and the site work for large plants, is up 26,300, or 2.2%, over the year, and the industry's 11,000 gain compares with an average of 10,000 over the past twelve months.
Health care added 17,000 jobs, about half the 33,000 monthly average of the past twelve months. Ambulatory health care services added 13,400 and hospitals 12,000, while nursing and residential care facilities lost 8,700, including 7,000 at continuing care retirement communities and assisted living. Social assistance added 6,300.
The losses were in white-collar industries, led by information, professional & business services and financial activities. Information lost 10,000 jobs and is 120,000, or 4.2%, below a year ago, with publishing down 4,000, broadcasting 3,000 and computing infrastructure and data processing 1,600, and computer systems design lost 4,400 and is 32,200 below a year ago. Professional & business services lost 9,000, with temporary help services down 10,900 and administrative and support services down 17,600. Financial activities lost 7,000 and is 129,000 below its May 2025 peak, with insurance carriers and related activities accounting for 90,000 of the decline, according to BLS.
The Unemployment Rate Rose on Entrants
The unemployment rate rose to 4.2% from 4.1%, and all of the increase came from people entering or reentering the labor force. Reentrants rose 152,000 to 2.29 million and new entrants rose 116,000 to 818,000, together 268,000, while job losers and people who completed temporary jobs fell 45,000 to 3.2 million and job leavers fell 173,000 to 741,000, reversing most of August's 121,000 increase. Household components are rounded and seasonally adjusted independently and do not sum to the 78,000 rise in the number of unemployed, but the direction is clear, since the people added to the unemployment count were looking for work and fewer of them had lost a job. Unrounded the rate moved to 4.18% from 4.14%, within the 4.1% to 4.3% range it has occupied since March.
The labor force grew 485,000 and participation rose two tenths to 61.8%, matching its level in April and May. Participation is up four tenths from July's 61.4%, household employment rose 406,000 and the employment-to-population ratio rose to 59.2% from 59.1%. The number of people not in the labor force fell 346,000 and the marginally attached fell 236,000 to 1.5 million. U-6 fell to 7.6% from 7.7% even as the number working part time for economic reasons rose 111,000 to 4.5 million, and the long-term unemployed were 1.9 million, 27.1% of the unemployed.
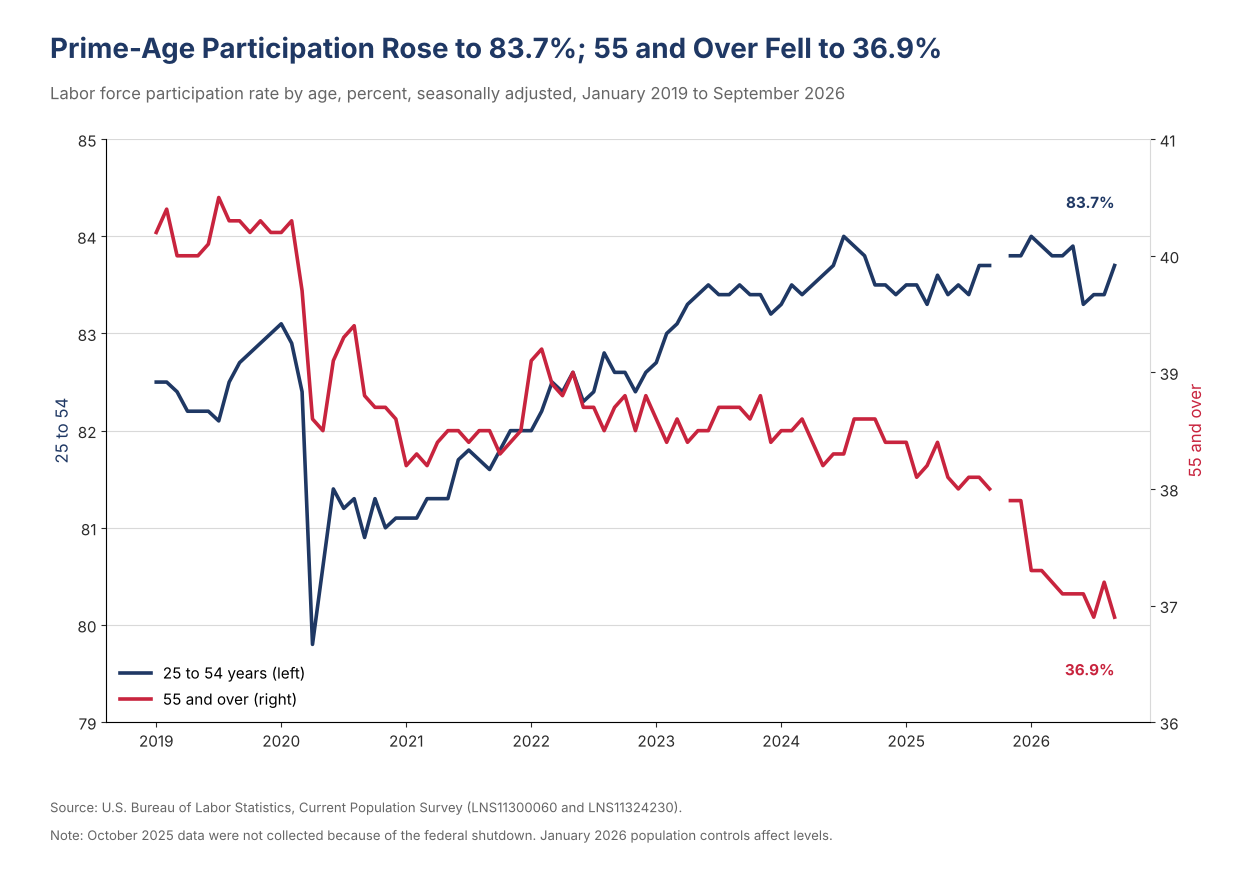
Prime-age workers drove the increase, the reverse of August. Participation at 25 to 54 rose three tenths to 83.7% and the prime-age employment-to-population ratio rose three tenths to 80.7%, while participation at 55 and over fell three tenths to 36.9%, back to July's reading. A cohort with a participation rate near 37% keeps taking a larger share of the adult population from cohorts whose rates exceed 83%, and Peak 65 adds roughly 4.1 million people a year to it through 2027, so the aggregate rate can fall even if no one changes their mind about working.
The immigration story is less clear than it looked a month ago. Before seasonal adjustment the foreign-born labor force was 32.28 million in September, 206,000 larger than a year earlier, against a gap of 379,000 the other way in August, while the native-born labor force was 1.13 million smaller, at 138.02 million against 139.14 million. Foreign-born participation was 66.0% against 66.3% a year ago and the foreign-born unemployment rate was 3.2% against 4.1%. These are single-month readings from a small subsample, and the January population controls affect year-over-year levels, so we would not rebuild the supply argument on one month, but the larger decline in the labor force is in the native-born population, which fits retirement.
Our September 28 View put the payroll pace consistent with a stable unemployment rate at the mid-teens to the high 80,000s a month, and a gain of 29,000 sits inside that range, with the rate moving four hundredths of a point. It also sits inside our breakeven range of zero to 40,000. A labor force that rebounds this quickly will not keep that breakeven near zero, and if participation holds near 61.8% the payroll pace needed to hold the jobless rate steady rises toward the middle of the range. We expect a modest rebound in foreign-born workers following the midterm elections and look for stronger overall job growth in 2027.
Wages, Hours and the Fed
Wage growth slowed again, and hours did not add to it. Average hourly earnings rose 5 cents, or 0.1%, to $37.81, and the year-over-year rate eased to 3.0% from 3.1% in August and 3.7% in February, the slowest pace of the year. Production and nonsupervisory pay rose 7 cents, or 0.2%, to $32.60. The private workweek held at 34.4 hours, the index of aggregate weekly hours was unchanged after a gain in August and aggregate weekly payrolls rose 0.2%, so August's jump in hours held in place and added nothing further. A wage gain of 3.0% is consistent with the Fed's 2% inflation objective once productivity growth of 2.2% over the year through the second quarter is counted, and unit labor costs rose just 1.4%.
Hours worked and productivity put third-quarter GDP growth between 2.7% and 3.5%. Our GDP proxy adds the growth in hours worked to the growth in productivity. The index of aggregate weekly hours for all private employees averaged 117.0 in the third quarter, 0.3% above the second quarter and a 1.3% annual rate, with the longer workweek, 34.4 hours against 34.3, adding 0.8 points and payroll growth 0.4. Productivity rose 2.2% over the year through the second quarter, which puts the proxy at about 3.5%, against real GDP growth of 2.2% in the second quarter and the Atlanta Fed’s GDPNow estimate of 3.7% for the third. Productivity grew at a slower 1.4% annual rate in the second quarter, however, and the proxy at that pace is 2.7%. The payroll-based hours measure also ran ahead of BLS in the second quarter, growing at a 1.2% annual rate against the 0.3% that BLS reported for hours worked in the nonfarm business sector, so we lean toward the lower half of the range, which is still a faster pace than the second quarter and one that rests on a longer workweek more than on hiring.
The report lowers the pressure on the Committee for October 27-28 and leaves our December call intact. Before the release futures put the odds of a hold at the October meeting near 72%, the 2-year Treasury yield was 4.80%, the 10-year 5.24% and the 30-year 5.60%, after reaching its highest level since 2004 on September 24, so the long end was already tightening financial conditions ahead of the labor data. The market reaction was a relief rally. By 9:10 a.m. the 2-year yield was 4.74%, down about 5 basis points from Thursday's close of 4.79% after touching 4.69%, and December S&P 500 futures were up about 1%, near 7,800. A payroll gain of 29,000 against a consensus near 85,000, a 0.1% wage gain and a jobless rate that rose on entrants give the doves what they need for October. The report does not settle the question the hawks are asking, because September produced soft payrolls and a rate that rose on entrants, which is neither the falling rate that would have sharpened our labor-force argument nor the reacceleration in hiring that would have called it into question.
We are maintaining our call. The Committee pauses on October 27-28 and raises the target range a second time on December 9, to 4.00% to 4.25%, with at least one further increase in 2027 carrying the terminal range to 4.25% to 4.50% or possibly slightly higher. Every reaction function is ceteris paribus, and the conditions that have moved since the Committee last met are an unemployment rate of 4.2%, wage growth of 3.0% and long yields at multiyear highs, which point in different directions. We will test the call against the October report on November 6. Payrolls between 20,000 and 80,000 with the private diffusion index back above 50 keep December on track, and a negative print with the diffusion index still below 50 would weaken it.
Our Call · The Calendar Nets Out, and Our Call Holds
Payrolls rose 29,000 against a consensus near 85,000 and the unemployment rate rose to 4.2%, which will read as a weak report, but the five months from May through September averaged 49,000 a month, close to the 45,000 average of the past twelve months and just above our breakeven range of zero to 40,000. The seasonal argument we made in August worked in the unadjusted data, where restaurants and bars shed far fewer workers than usual after hiring far fewer over the summer, and the re-estimated factors then took most of the payoff. We score our call for a strong August or September as made, with August the hot month and September carrying the unwind, and we do not look for more help from the calendar. Job losers fell, the entire rise in the jobless rate came from entrants, prime-age participation rose and claims fell to 197,000, so the labor market looks small and in balance, not weak. Breadth narrowed in a single month, with the private diffusion index at 49.0, and we want it back above 50 in the October report on November 6. We hold our call on the Fed: a pause on October 27-28, a quarter-point increase on December 9 to 4.00% to 4.25% and at least one more in 2027 that carries the terminal range to 4.25% to 4.50% or higher. That call is ceteris paribus, and the readings that matter most between now and December are core PCE and the long end, since a labor market adding 30,000 to 50,000 jobs a month with a labor force that is growing again does not by itself argue for an earlier or later move.
Mark P. Vitner – Chief Economist, Piedmont Crescent Capital
mark.vitner@piedmontcrescentcapital.com · (704) 458-4000
Sources: U.S. Bureau of Labor Statistics, The Employment Situation, September 2026, including the Current Employment Statistics and Current Population Survey tables; U.S. Bureau of Labor Statistics, Productivity and Costs, Second Quarter 2026; U.S. Department of Labor, Unemployment Insurance Weekly Claims; Institute for Supply Management; Board of Governors of the Federal Reserve System; Federal Reserve Bank of Atlanta, GDPNow; Dow Jones and Bloomberg consensus estimates; CME Group. Disclaimer: This report is provided for informational purposes only and does not constitute investment, legal, tax, or accounting advice, nor an offer or solicitation to buy or sell any security. Information is drawn from sources believed to be reliable, but its accuracy and completeness are not guaranteed. Views expressed are those of the author as of the date of publication and are subject to change without notice. Past performance is not indicative of future results.