
The Order Book Reopened as Prices Snapped Back
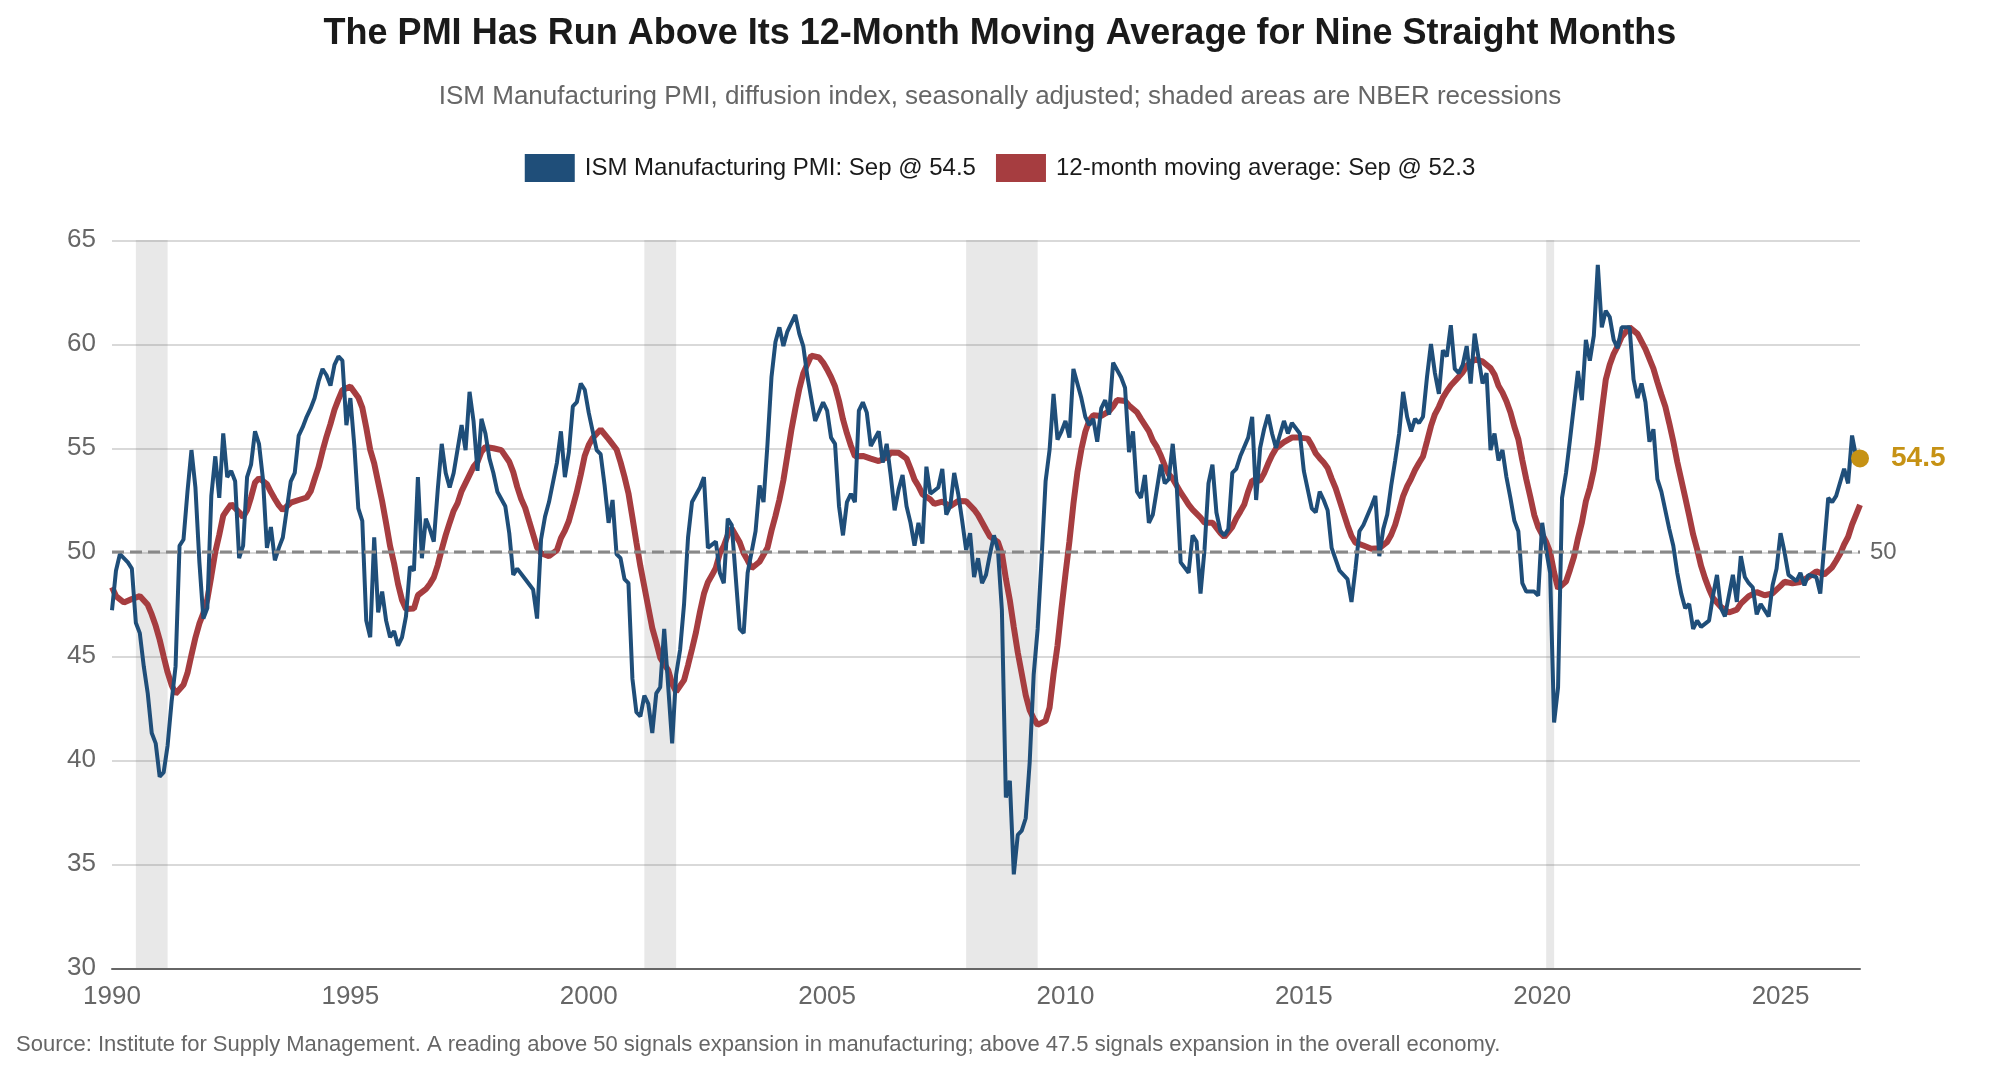
The Manufacturing PMI came in slightly below expectations, edging a tenth of a point lower to 54.5 in September, but new orders, backlogs and hiring improved while production, inventories and deliveries eased, the Prices Index jumped 6.8 points to 77.9, and the regional surveys, led by a 58.8 reading in Chicago, provided confirming evidence of a strengthening factory sector.
Early Signals
- The expansion held its pace. The Manufacturing PMI registered 54.5 in September, a tenth below August’s 54.6 but still marking the ninth consecutive month above 50. ISM notes that reading is consistent with 2.4 percent real GDP growth on an annualized basis, the same as August.
- The order book reopened. The New Orders Index rose 1.6 points to 55.3 and the Backlog of Orders Index jumped 4.6 points to 56.4, its highest reading since February. Together they recovered just over half of August’s decline in new orders and all of the decline in backlogs.
- Hiring improved and production eased. The Employment Index rose 1.5 points to 52.7, a third month above 50. The Production Index fell 1.6 points to 56.7, an 11th month of growth, and the Inventories Index slipped into contraction at 48.6.
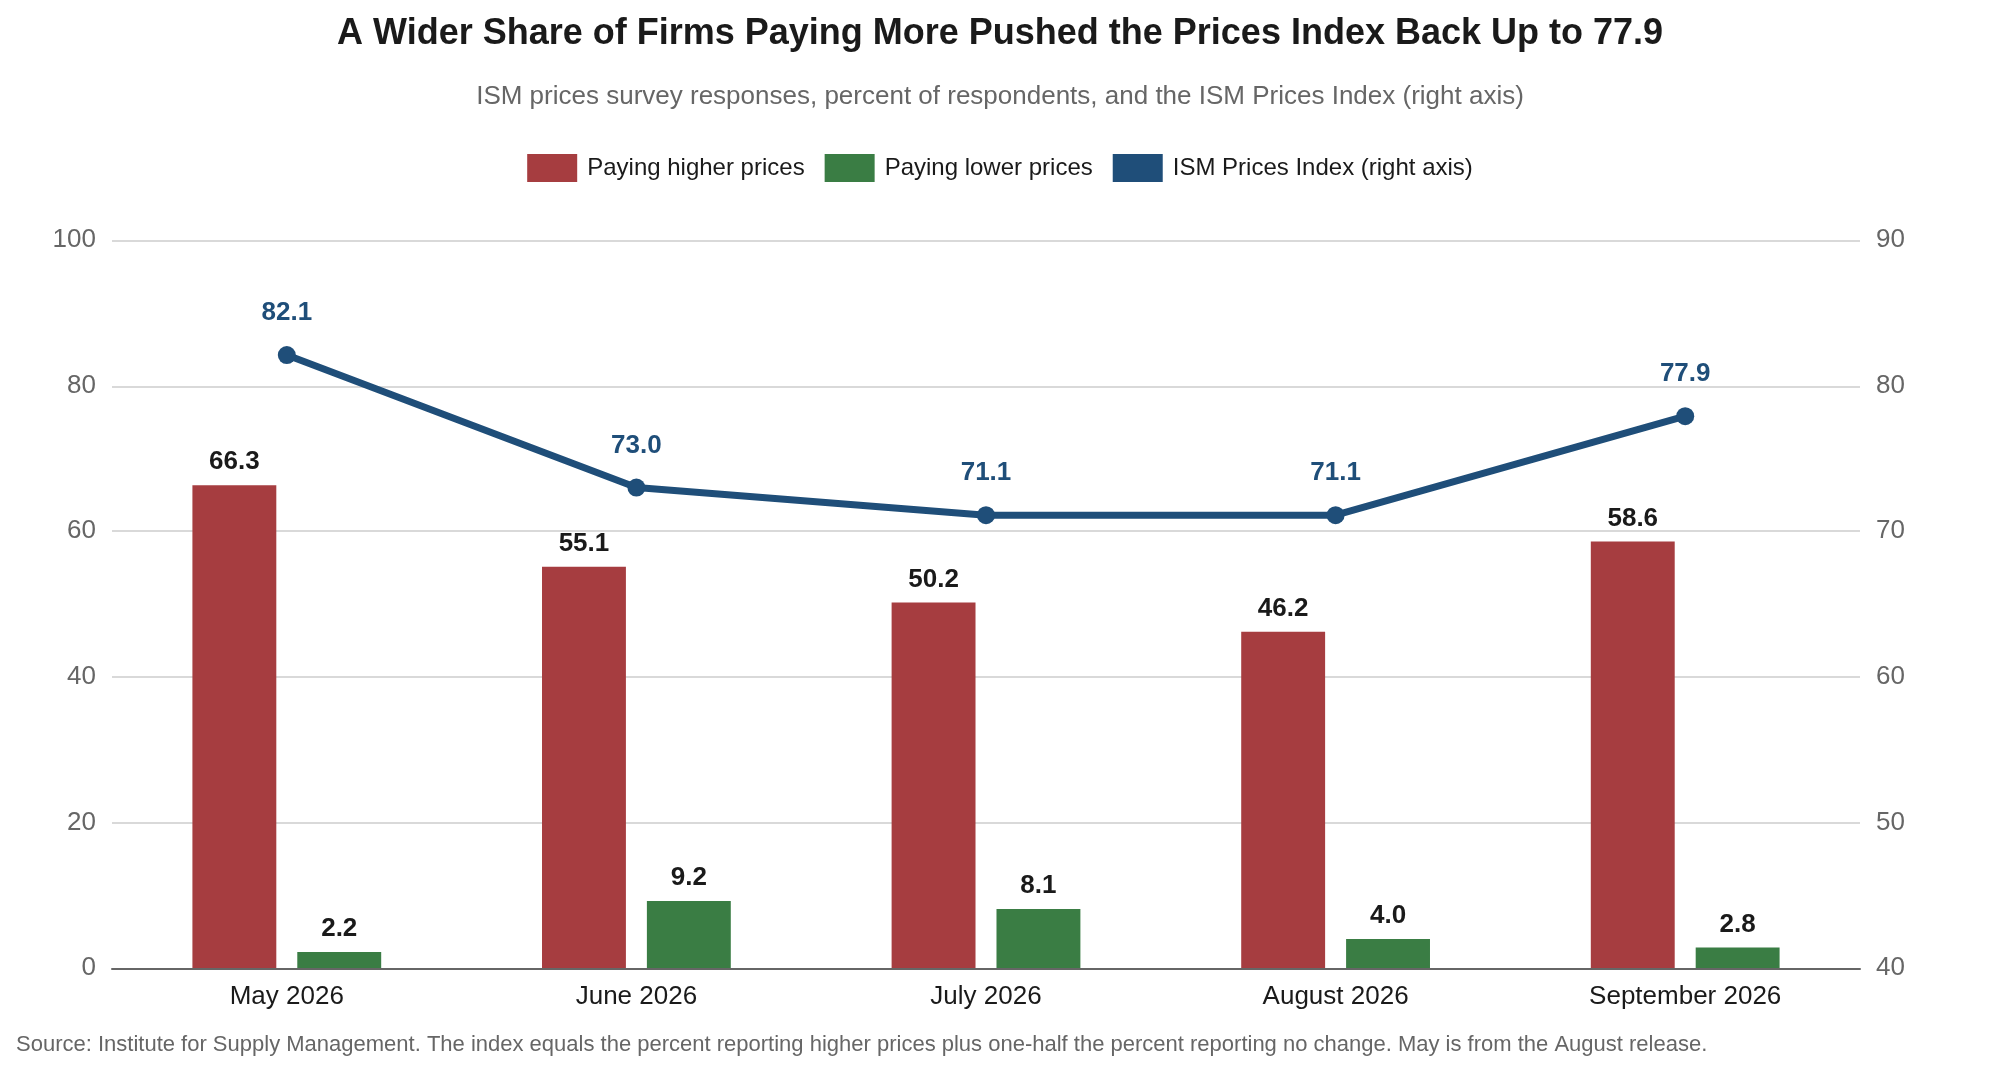
- Prices jumped. The Prices Index rose 6.8 points to 77.9, the largest one-month increase since March and the highest reading since May, a 24th month of rising input costs. The share of respondents paying more rose to 58.6 percent from 46.2 percent.
- This past month’s regional surveys were strong but uneven. The Chicago Business Barometer, the old NAPM-Chicago, jumped 11.7 points to 58.8, while the average of five regional Fed surveys eased to 13.4 from 18.7. Four of the five districts were positive, led by Philadelphia at 37.8, and Richmond, where building products, furniture and home textiles are key industries, slipped to a negative 2.
Key Takeaways
| Key Concept | Findings |
|---|---|
| Manufacturing PMI | Slipped to 54.5 from 54.6, a ninth straight month of expansion following a ten-month contraction. The 12-month average is 52.3, with a high of 55.6 in July and a low of 47.9 in December. ISM puts that reading in line with 2.4 percent real GDP growth on an annualized basis. |
| New Orders and Backlogs | New orders rose 1.6 points to 55.3 and backlogs jumped 4.6 points to 56.4, the highest since February. Customers’ inventories fell to 41.6 from 42.8 and have been judged too low for 24 consecutive months, which historically points to future production. A Chemical Products panelist called that industry’s improvement temporary. |
| Production | Down 1.6 points to 56.7, an 11th consecutive month of growth and the lowest reading since June. The unadjusted responses were essentially unchanged from August, so the decline reflects the seasonal adjustment. |
| Employment | Up 1.5 points to 52.7, a third month in expansion after 17 straight months below 50. The ratio of panelists hiring to those managing or reducing head counts widened to 1.5 to 1 from 1.3 to 1. Most of the gain in the published index came from the seasonal adjustment. |
| Prices | Up 6.8 points to 77.9, a 24th month of increases and the largest one-month rise since March. The share paying more rose to 58.6 percent from 46.2 percent, while the share paying less fell to 2.8 percent from 4.0 percent. |
| Supplier Deliveries | Slower for a tenth month, at 59.0, down 0.3 point from August. Electronic components have been in short supply for 19 consecutive months, electrical components for 15 and memory for nine. |
| Trade | New export orders fell 2.3 points to 50.9 and the Imports Index fell 1.5 points to 51.0, both still in expansion. Panelists cited a Canada tariff and the broader trade war. |
| Breadth | Twelve of 18 industries grew and two contracted, Printing & Related Support Activities and Textile Mills. By GDP weight, the contracting share fell to 2 percent from 22 percent, almost all of the change coming from Chemical Products, which flipped to growth. Five of the six largest industries expanded. |
| Regional Surveys | Chicago jumped 11.7 points to 58.8, the highest since May. The average of five regional Fed surveys eased to 13.4 from 18.7 but was above zero for a third straight month, with Philadelphia, Dallas and Kansas City strong, and Empire State and Richmond weaker. |
| Policy Signal | Reaccelerating orders and hiring alongside input costs near 78 argue against easing. We continue to look for the Fed to hold on October 27-28 and to raise the target range on December 9 to 4.00 to 4.25 percent, with at least one further increase in 2027 carrying the terminal range to 4.25 to 4.50 percent or higher. |
The Overview
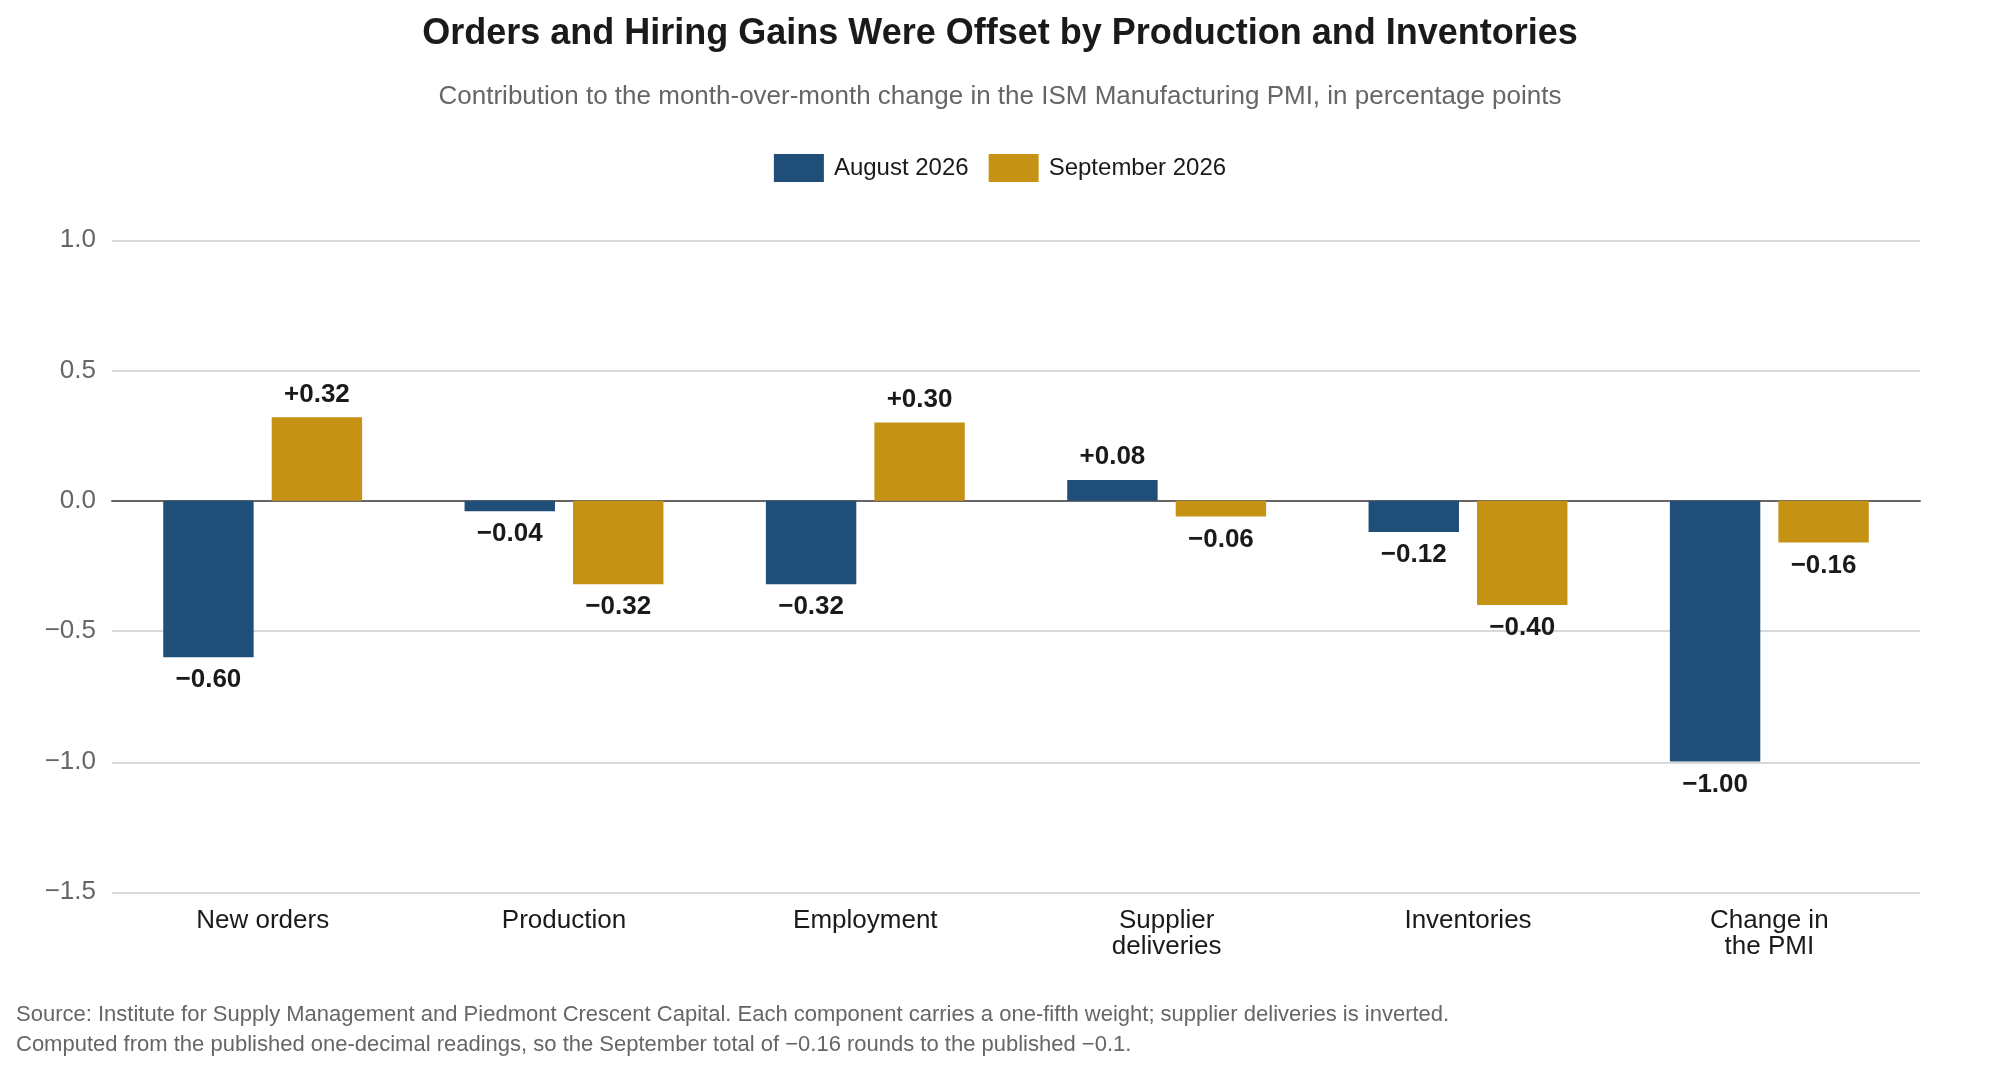
The Manufacturing PMI slipped a tenth of a point to 54.5 in September, its ninth consecutive month above 50, and the headline hides a rearrangement underneath it. Two of the five components that feed the index improved, new orders and employment, and together they added about six tenths of a point. Production, supplier deliveries and inventories took away a little more than that. The gains came in the orders-and-hiring part of the survey and the declines came in the output-and-inventory part. Inventories fell 2.0 points to 48.6 and subtracted the most, four tenths of a point on their own, which is as likely to mean demand is drawing stock down as that firms are pulling back, since customers’ inventories, at 41.6, have been judged too low for 24 consecutive months. Remember that the ISM index is a diffusion index and provides a reading on the breadth of the strength in the factory sector, not the magnitude of that strength. That said, orders are the most forward-looking component of the ISM survey, and the gains in orders suggest manufacturing activity is ramping up.
The breadth measures in this report swung by far more than the headline. Twelve of 18 industries grew in September and two contracted, Printing & Related Support Activities and Textile Mills, yet ISM reports that only 2 percent of manufacturing GDP was contracting, down from 22 percent in August. The swing is one industry. Chemical Products is the largest manufacturing industry by value added, $579 billion of the sector’s $2.9 trillion in 2025 on Bureau of Economic Analysis figures, close to a fifth of the total, and it flipped from contraction to growth in September. Printing, at $43 billion, and textile mills and textile product mills, at $18 billion, together come to about 2 percent of the sector, which matches the share ISM reports as contracting and implies that essentially all of it was in strong contraction. Five of the six largest industries grew.
The factory-cycle sequence we have cited all year runs from orders to backlogs to hours worked to hiring, and in September the front of that chain turned back up. Last month we said the next two order readings would settle whether the recovery was decelerating or ending. September is the first of the two. New orders recovered just over half of August’s decline, to 55.3 from 53.7, and backlogs recovered all of it, to 56.4 from 51.8. The back of the chain was already improving. Average weekly hours in manufacturing were 41.7 in August for a third month, the highest since June 2019, and manufacturing payrolls added 16,000 jobs in August after 14,000 in July and 13,000 in June. With orders and backlogs up, hours at a seven-year high and hiring rising, the chain is intact. One order reading does not make a trend, and October’s is the second of the two.
The Prices Index jumped 6.8 points to 77.9, and the way it got there is the mirror image of August. Last month the index held at 71.1 because the shares paying more and paying less both thinned. This month the share paying more rose 12.4 points to 58.6 percent, the highest since May, while the share paying less slipped to 2.8 percent from 4.0 percent. The movement came out of the middle of the distribution. The share reporting no change fell 11.2 points to 38.6 percent, so the standstill on costs we described in August did not last.
The Order Book Reopened
New orders rose 1.6 points to 55.3 in September and the Backlog of Orders Index jumped 4.6 points to 56.4, its highest reading since February. Both have now been in expansion for nine consecutive months, so September reverses most of what August gave back. Panel sentiment on demand did not improve with the indexes. The ratio of positive to negative demand comments narrowed to 1.7 to 1 from 2 to 1 in August and 3.5 to 1 in July, and across all topics 60 percent of the comments were negative. The panel is describing demand more cautiously than the index does.
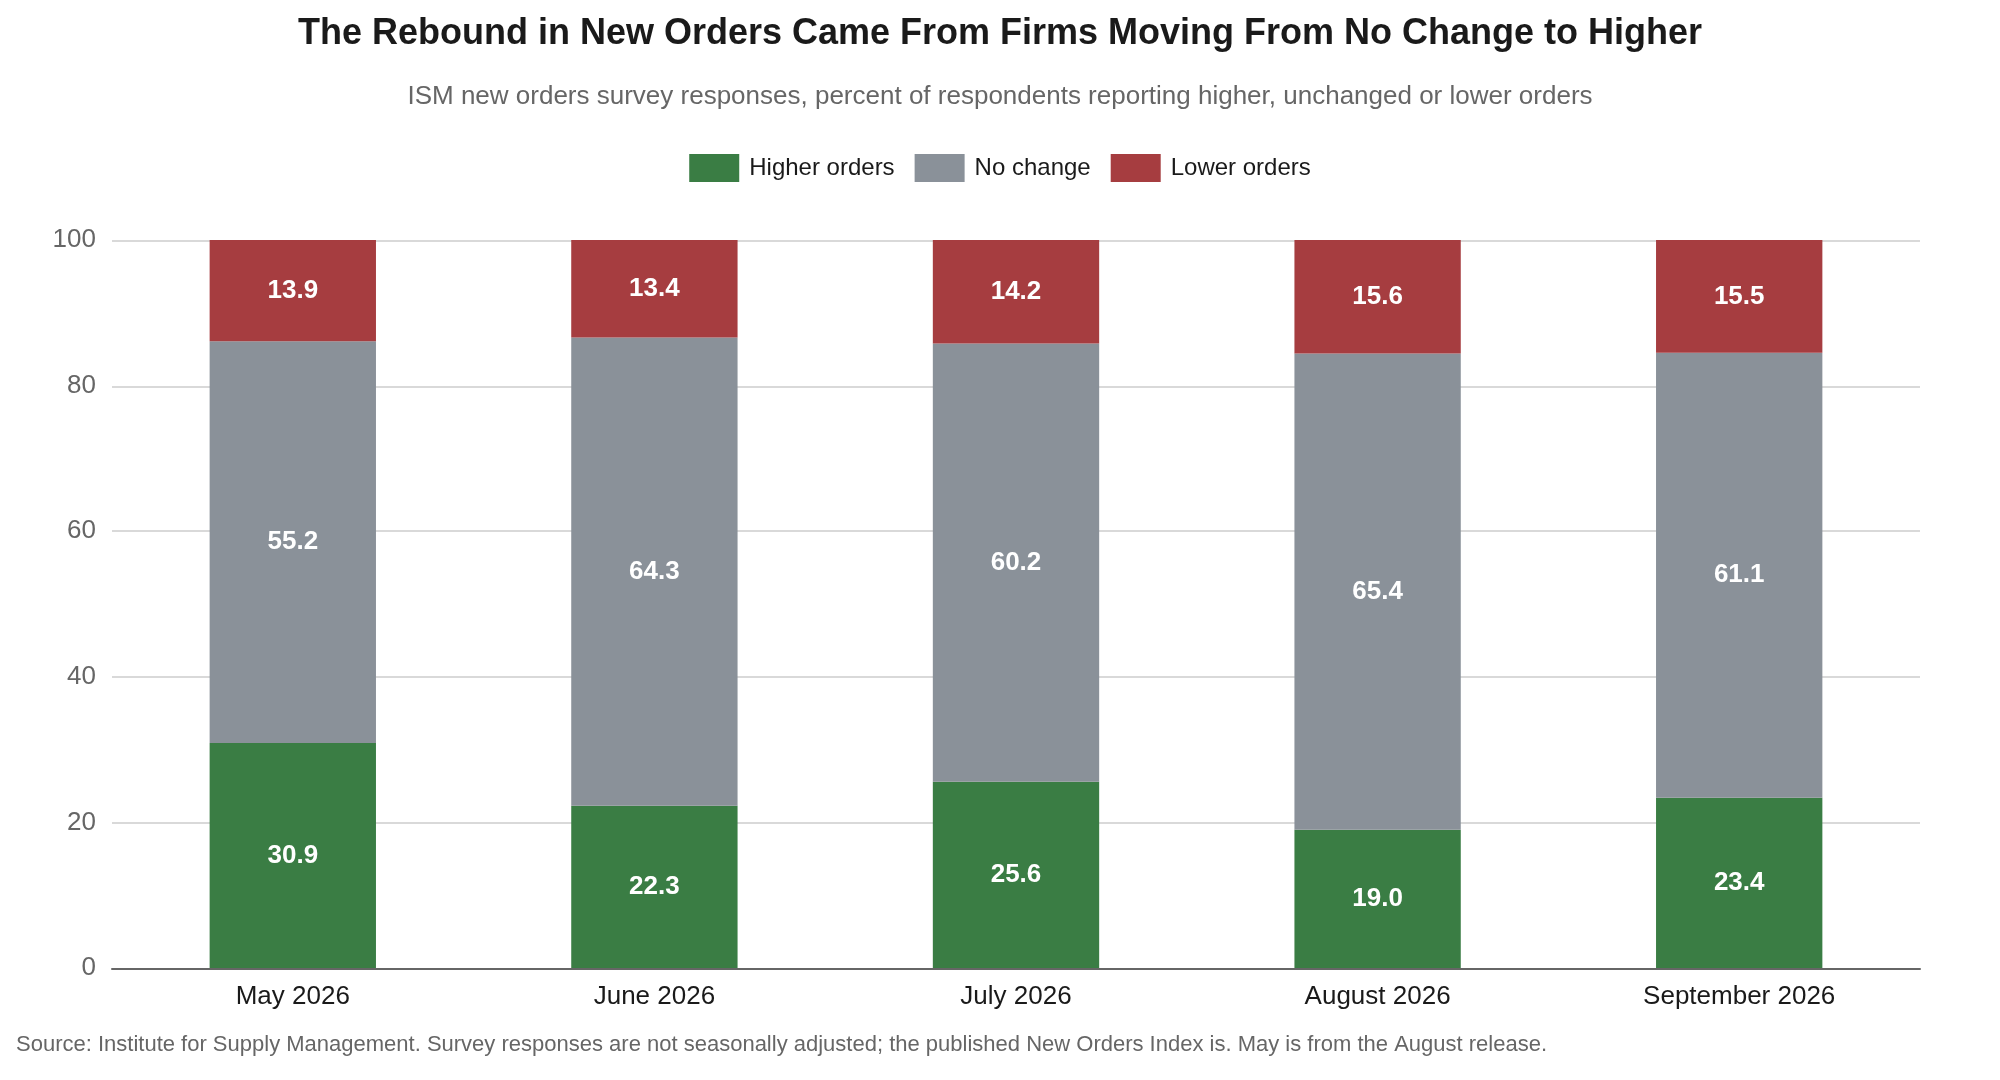
The raw responses confirm the improvement. The share of panelists reporting higher orders rose to 23.4 percent from 19.0 percent, while the share reporting lower orders was essentially unchanged at 15.5 percent. The gain came out of the middle, where the share reporting no change fell to 61.1 percent from 65.4 percent. On the unadjusted responses the index rose about 2.3 points to 54.0, a little more than the 1.6-point gain in the seasonally adjusted series. Order books started growing again for part of the panel in September without shrinking for anyone else.
The rest of the demand block was mixed. New export orders fell 2.3 points to 50.9 and imports fell 1.5 points to 51.0, both still in expansion, with a Canada tariff and the broader trade war appearing in the panel comments. Customers’ inventories fell 1.2 points to 41.6, the 24th consecutive month judged too low, a condition that historically precedes restocking. Buyers committed a little further forward on capital equipment and maintenance supplies than in August, with capital expenditure lead times up 5 days to 176 and maintenance and repair supplies up a day to 49, and left production materials unchanged at 84 days. The comment that matters most for how to read the orders data came from a Chemical Products panelist, who called that industry’s improvement temporary and attributed it to customers bringing forward purchases, delayed raw-material price increases and reduced competitor capacity, with structural overcapacity, pricing pressure and protectionist trade policy still in place. We would not build a forecast on one month of that industry’s survey, although over time chemical producers should do better as overall manufacturing activity increases.
Hiring Strengthened, Though Less Than It Looks
The Employment Index rose 1.5 points to 52.7 in September, a third month in expansion after 17 straight months below 50, and the ratio of panelists hiring to those managing or reducing head counts widened to 1.5 to 1 from 1.3 to 1. ISM’s guidance is that an Employment Index above 50.3 is generally consistent with rising manufacturing payrolls in the Bureau of Labor Statistics data, and September is the third reading in a row above it.
The raw responses are less exciting than the change in the index. Of the panelists, 15.3 percent reported more head counts, 14.5 percent reported fewer and 70.2 percent reported no change, so the net between those adding and those cutting widened to 0.8 points from 0.3 in August, and the no-change share fell from August’s 76.7 percent. On the unadjusted responses the Employment Index was about 50.4, against about 50.2 in August, so most of the 1.5-point gain in the published series came from the seasonal adjustment. Hiring is real and improving, but the headline overstates how much.
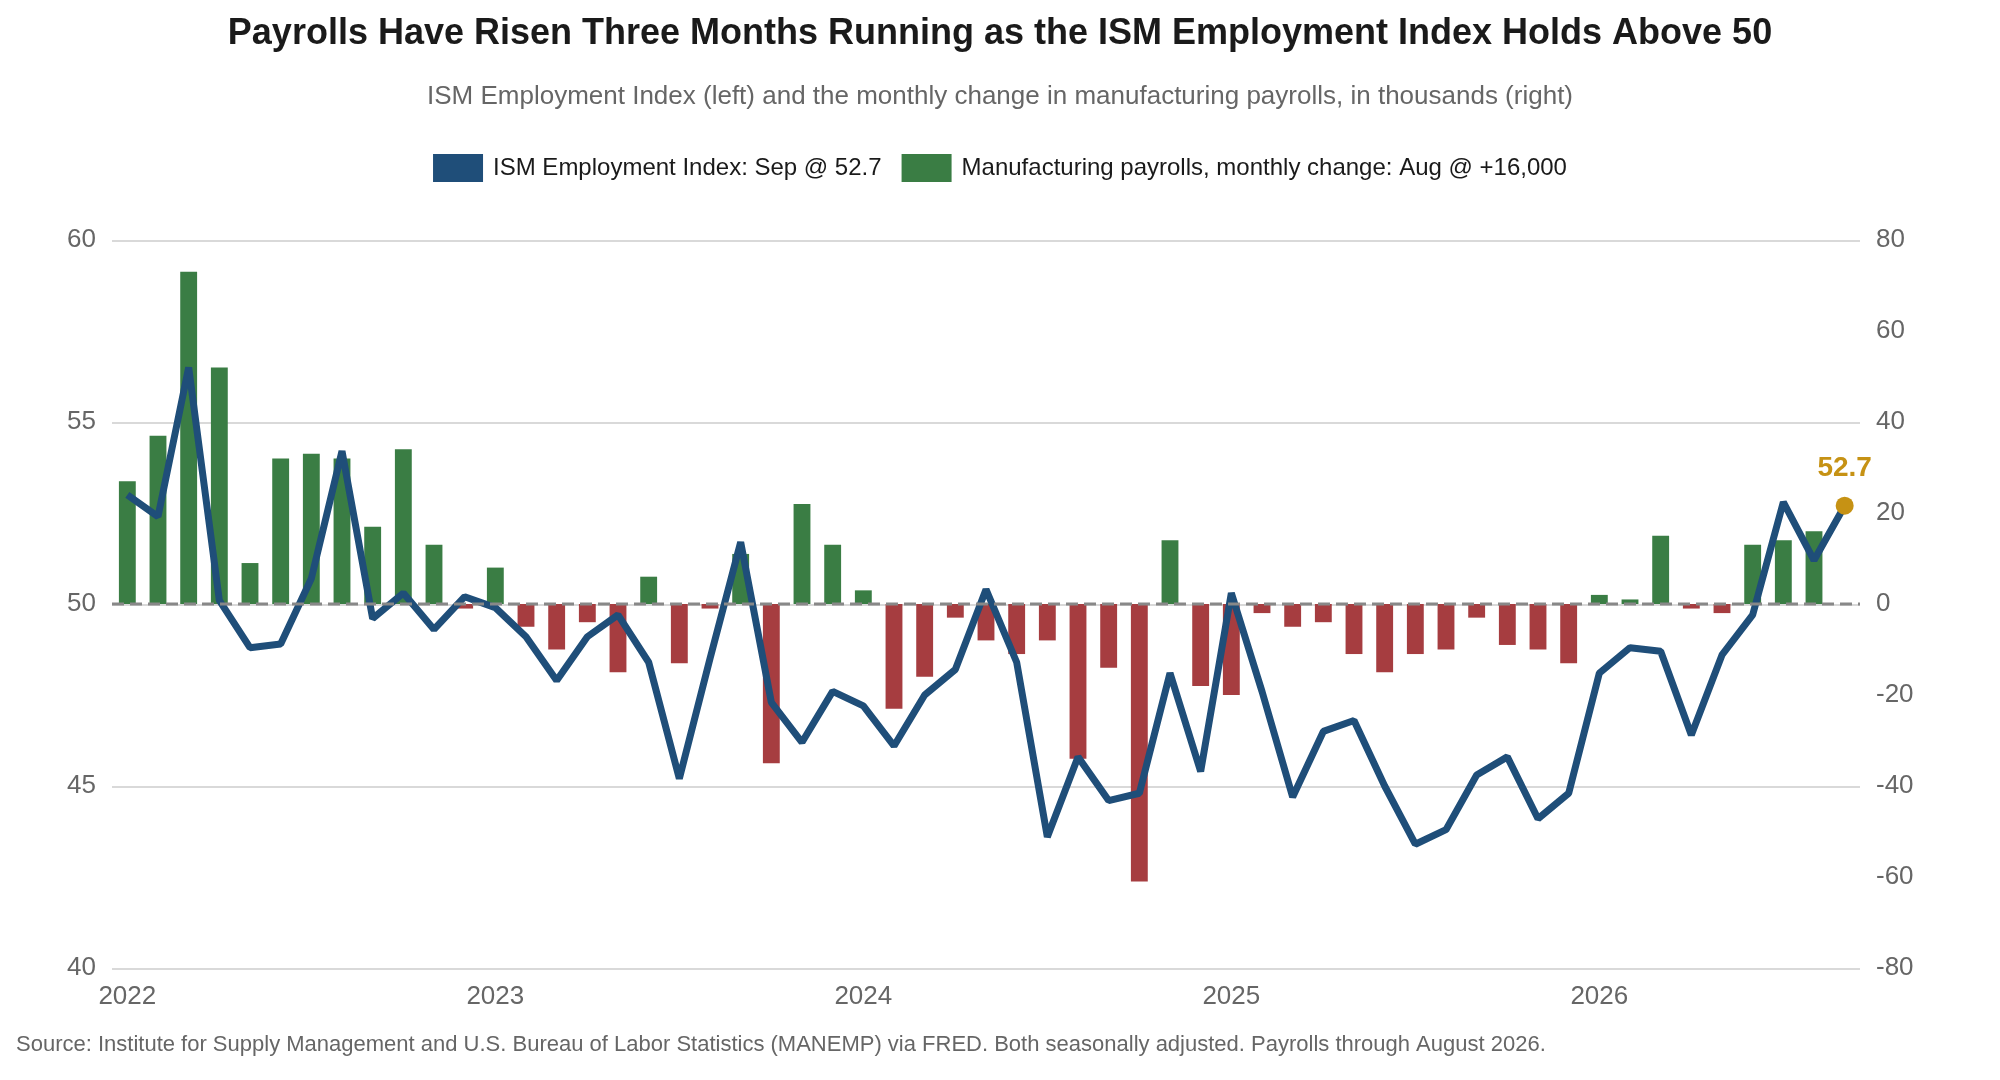
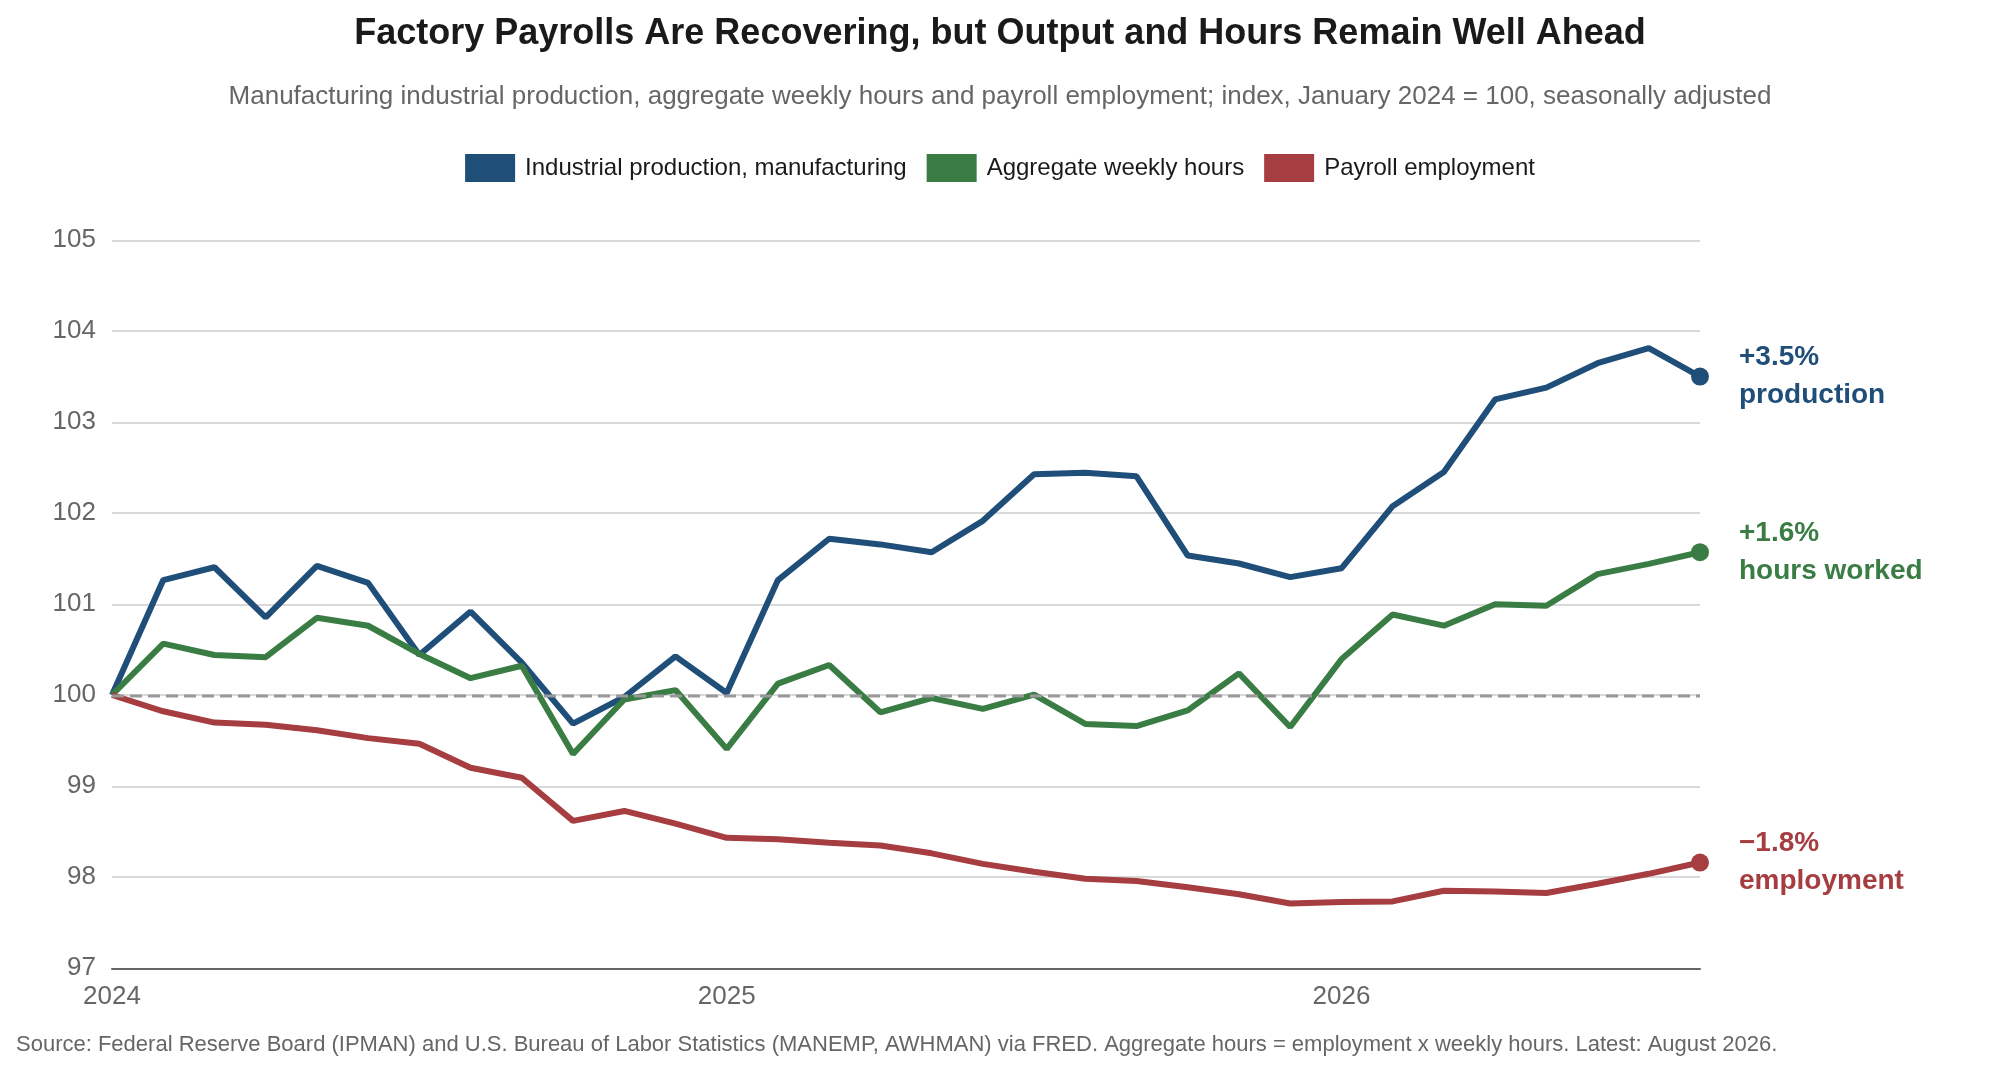
The hard data have been catching up to the survey. Manufacturing payrolls added 16,000 jobs in August after 14,000 in July and 13,000 in June, 43,000 over three months, and now stand 58,000 above December’s trough. Employment is 23,000 above a year earlier, the first positive year-over-year change since September 2023. Payrolls are still 1.8 percent below their January 2024 level, however, while factory output is 3.5 percent above it and aggregate hours are 1.6 percent above it.
The workweek is still doing work that hiring has not. Average weekly hours in manufacturing were 41.7 in June, July and August, the highest readings since June 2019. Six tenths of an hour above December’s 41.1 is worth roughly 184,000 workers at December’s workweek, against the 58,000 the sector has actually added since then. Employers stretch hours before they hire when they doubt a recovery will last, because hours can be unwound quickly and hires cannot. Three straight gains in payrolls say some of them have started to commit, and Friday’s employment report for September will show whether that pace has held.
The Investment Cycle Is Still Running
Nothing in the data suggests the capital spending behind this recovery is slowing. Orders for nondefense capital goods excluding aircraft reached $87.6 billion in August, up 1.6 percent from July and 14.1 percent from a year earlier, and up 10.6 percent since December alone. Since the start of 2024 factory output is up 3.5 percent while aggregate hours are up 1.6 percent and payrolls are down 1.8 percent, which is the signature of a cycle that deepened capital before it added workers.
The Production Index fell 1.6 points to 56.7, an 11th month of growth and the lowest reading since June, but we read most of that decline as seasonal noise. On the raw responses 25.4 percent of panelists reported higher output and 11.9 percent reported lower, an unadjusted index of about 56.8 against about 56.6 in August. The seasonal factor added about 1.7 points to August’s published figure and almost nothing to September’s, so the unadjusted series was essentially unchanged. Industrial production shows a similar pause, with manufacturing output slipping 0.3 percent in August after a long run of gains.
Supplier deliveries slowed for a tenth consecutive month, at 59.0, 0.3 point less than in August. Slower deliveries usually accompany firming demand, and they can also signal genuine scarcity. With orders and backlogs rising in the same month, firming demand is a larger part of the story than it was in August, when orders were falling. Electronic components have been in short supply for 19 consecutive months, electrical components for 15 and memory for nine. The Chicago survey describes the same strain from another angle, with 27 percent of its respondents naming semiconductors and electronic components as a supply constraint and 23 percent naming metals and specialty alloys. Lead times came up in 21 percent of the negative ISM panel comments, against 46 percent in August.
Prices, Tariffs and the War Premium
The Prices Index rose 6.8 points to 77.9 in September, the largest one-month increase since March and the highest reading since May, and has now signaled rising input costs for 24 consecutive months. Aluminum has been up in price for 34 consecutive months, copper for 15 and steel for 11. Pricing volatility was the most common concern in the negative panel comments, cited in 46 percent of them, followed by tariffs at 34 percent, the Iran war at 30 percent and lead times at 21 percent.
The share of respondents paying higher prices rose to 58.6 percent, the highest since May, and the share paying lower prices fell to 2.8 percent, so the net share paying more is now 55.8 percentage points against 42.2 in August. Nearly three of every five manufacturers paid more for materials in September and almost none paid less.
The official price data have turned in the same direction. The producer price index for processed goods for intermediate demand, the series ISM’s Prices Index is most closely tied to, rose 1.4 percent in August after declines of 0.6 percent in June and 0.2 percent in July, to a record level above both the 2022 peak and May’s reading. Its year-over-year rate rose to 11.5 percent from 10.1 percent in July. Last month we argued that the deceleration in producer prices had less room left in it than two monthly declines suggested. The August producer price data settled that faster than we expected, and the September survey points the same way.
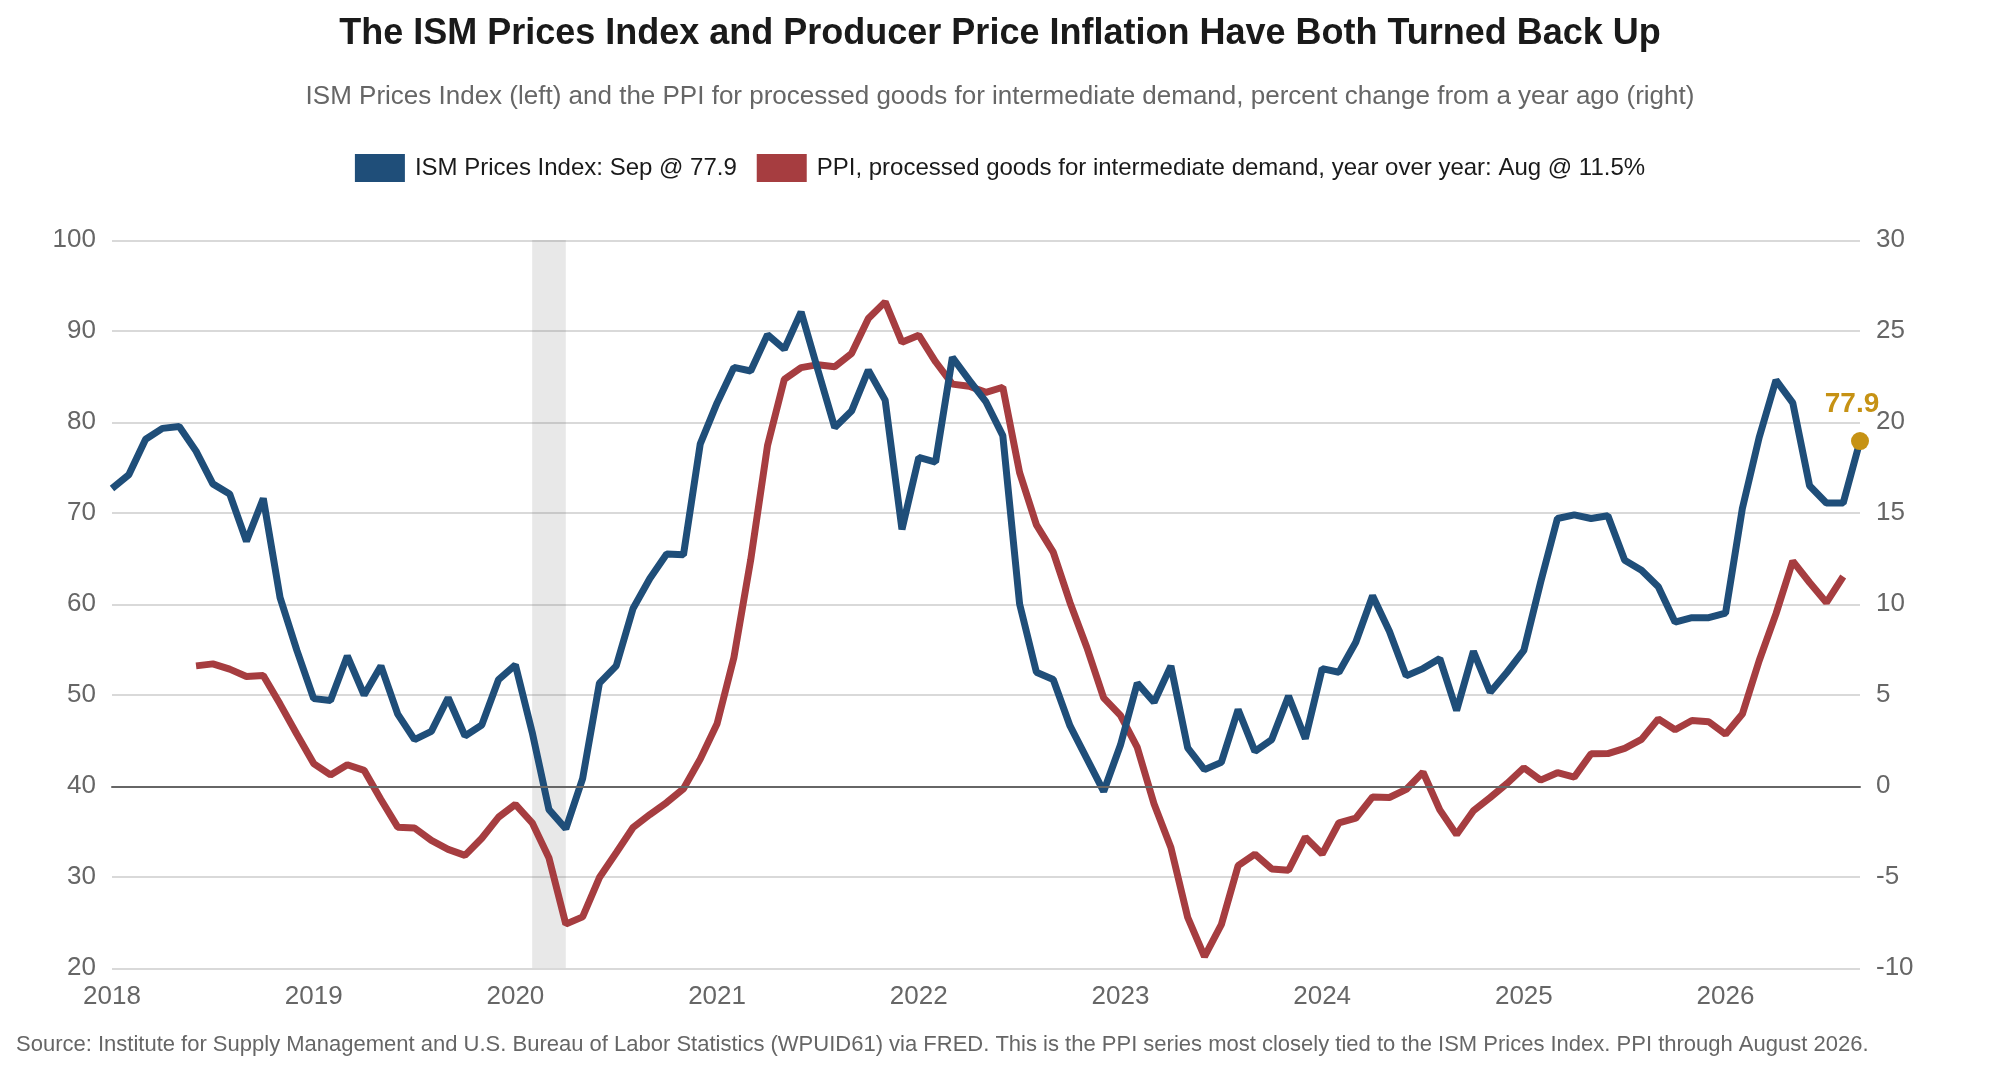
Three forces are behind the survey index, and they are separable. Tariffs raise costs through the value chain, and panelists cite a Canada tariff and the broader trade war, which are policy choices. The Iran war keeps a premium on petroleum-based products and freight, and it was named in 30 percent of the negative comments, unchanged from August. The third is scarcity in the categories the AI buildout is consuming, which will not ease materially until the buildout does.
The Regional Surveys Were Strong, but Uneven
The Chicago Business Barometer, the survey formerly known as the NAPM-Chicago, jumped 11.7 points to 58.8 in September from 47.1, against a consensus near 51 and its highest reading since May. Production rose 15.5 points to its highest since May, new orders rose 13.3 points, supplier deliveries rose 9.6 points for a 20th month above 50, and order backlogs rose 8.4 points, although they are still in contraction, for a third month. Employment fell 4.3 points and went back into contraction, inventories slipped 0.6 point, and prices paid fell 3.7 points to July’s level, with no respondent reporting lower prices for a seventh straight month. A one-month gain this large is unlikely to repeat. It does say that orders and output picked up together in the Midwest, which matches the ISM’s own detail, and the employment reading is a reminder that Chicago and the national survey did not agree on hiring.
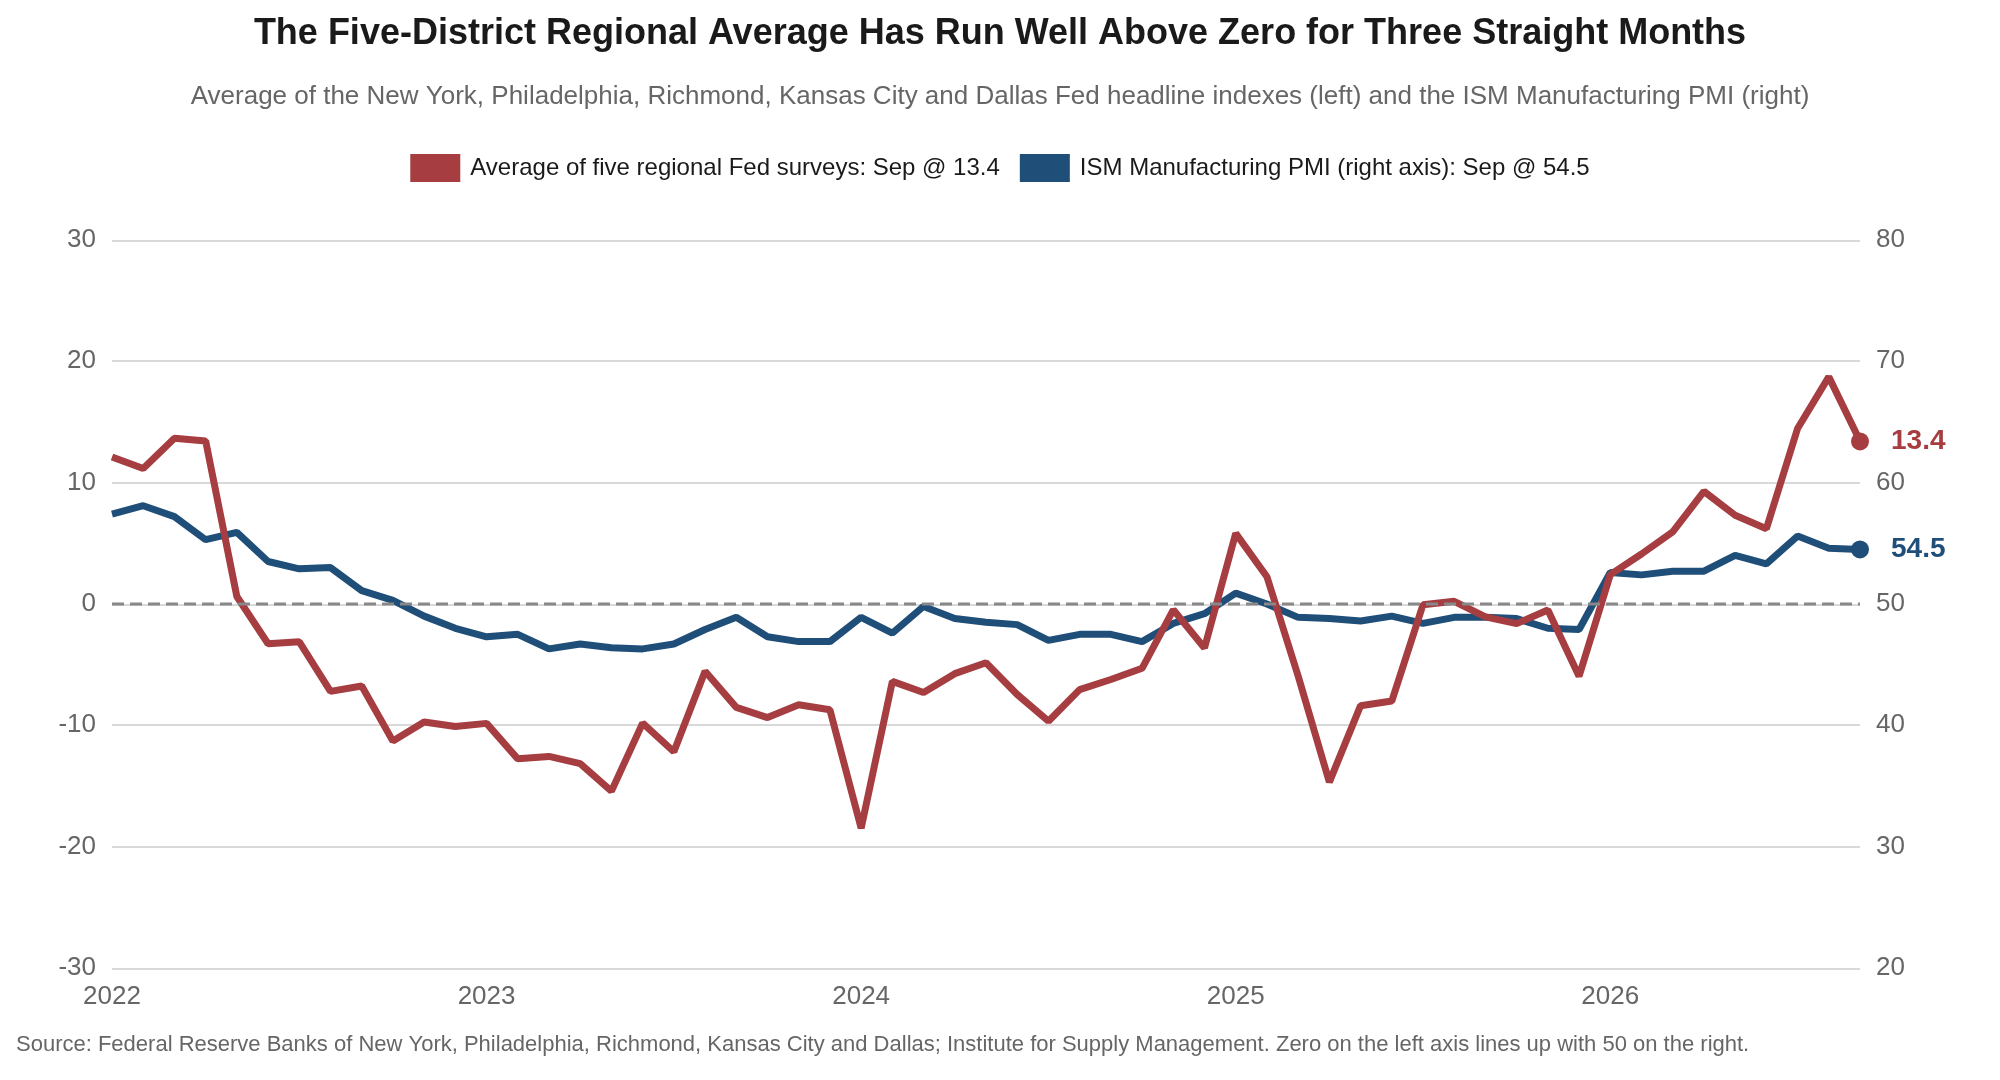
The five regional Fed surveys were stronger than the cooling in their average suggests and more divided than it implies. The average of the five headline indexes eased to 13.4 from 18.7 in August, the third consecutive reading at 13.4 or higher, a stretch the series has not matched since the spring of 2022. Philadelphia fell to 37.8 from 47.4 but has now posted three straight readings of 37.8 or higher, which has no precedent in our data back to January 2022. Dallas slipped to 9.8 from 11.6 even as its production index rose to 29.5 from about 13 and its new orders index rose to 30.7 from 22.0, and Kansas City rose to 14 from 10, its highest in at least 13 months, with new orders at 24 from 16. The two weak spots were Empire State, where general business conditions fell to 7.6 from 20.6 and new orders to 2.0 from 17.3, and Richmond, whose composite fell to a negative 2 from 4, the first negative reading since February. The Richmond Fed survey has an unusually strong connection to housing-related manufacturing. The Fifth District includes important concentrations of furniture, home textiles, wood products and other building materials, making the survey particularly sensitive to residential construction, remodeling and housing-market conditions.
Hiring and prices tell the same story as the ISM. The five-district employment average was 8.9 against 8.6 in August, with Dallas at 15.1 from 8.0, Philadelphia at 11.8 from 27.9, New York at 10.6, Richmond at 7 from a negative 2 and Kansas City flat at zero. Prices paid rose in New York to 63.1 from 58.6, in Philadelphia to 48.6 from 40.9 and in Kansas City to 68 from 55, and Dallas’s raw materials price index of 52.2 is nearly twice its series average of 28.0. Delivery times lengthened in both New York and Philadelphia. The five-district average for new orders was 16.0 against 17.7 in August. The one soft spot was the outlook in Dallas, where the index of expected general business activity fell to 20.8 from 37.2. The five-district average has tracked the PMI closely since 2022, with a correlation of 0.82, and at 13.4 it is consistent with a PMI well above 50. The final S&P Global manufacturing PMI, at 55.9 from 53.9 in August after a flash estimate of 57.0, was stronger still.
Our Call
The recovery reaccelerated at the front of the factory cycle, and October’s order readings will say whether it lasts. Last month we said the next two order readings would settle whether the recovery was decelerating or ending. September answers the first half in the recovery’s favor. Orders and backlogs rose, hours worked are at a seven-year high and hiring has risen for three months. Hiring responds to orders with a lag of several months, so we look for manufacturing employment to post small gains through the fall and for the Manufacturing PMI to hold in the low to mid 50s.
Composition is again doing more work than the headline. The swing in GDP-weighted contraction from 22 percent to 2 percent is one industry, and that industry’s own panelist calls the improvement temporary. The seasonal adjustment is doing much of the work in both the employment gain and the production decline, so the unadjusted readings are the safer guide this month. This is still a capital goods recovery riding an investment cycle, with core capital goods orders up 14.1 percent from a year ago, and it stays vulnerable to anything that interrupts that cycle.
We hold our call on the Fed, and September’s data lean toward the upside. We continue to expect the Committee to pause at the October 27-28 meeting and to raise the target range a second time on December 9, to 4.00 to 4.25 percent, with at least one further increase in 2027 carrying the terminal range to 4.25 to 4.50 percent or higher. That call is ceteris paribus, and September’s data cut toward an earlier move, not a later one: a Prices Index near 78, a producer price index at a record, rising hiring and a regional average of 13.4. Friday’s employment report is the release most likely to settle the timing.
The risk to this call is that it is too patient. A Prices Index near 78 and a record producer price index would argue for acting in October if Friday’s employment report is strong. The risk in the other direction is that the reacceleration in orders is a pull-forward. The Chemical Products panelist described customers bringing purchases forward, and customers’ inventories have been too low for 24 months, which should support restocking, but if October’s ISM and Chicago surveys both give back September’s gains, the order book will look like it has been oscillating around 54 instead of building. In that case we would lose confidence in the December increase.
Mark P. Vitner – Chief Economist, Piedmont Crescent Capital
mark.vitner@piedmontcrescentcapital.com · (704) 458-4000
Disclaimer: This report is provided for informational purposes only and does not constitute investment, legal, tax, or accounting advice, nor an offer or solicitation to buy or sell any security. Information is drawn from sources believed to be reliable, including the Institute for Supply Management, the U.S. Bureau of Labor Statistics, the U.S. Census Bureau and the Federal Reserve Board, but its accuracy and completeness are not guaranteed. Views expressed are those of the author as of the date of publication and are subject to change without notice. Past performance is not indicative of future results.