
ECONOMIC INDICATOR REPORT · GDP BY INDUSTRY, SECOND QUARTER 2026
Capital Spending Now Shows Up in Industry Output
Six industry groups supplied 70% of real GDP growth over the past four quarters, up from 34% in 2015-19, although structures, defense and pharmaceuticals have yet to show up in the accounts.
Early Signal
- Growth of 2.2% is unremarkable, but its makeup is not. Real GDP rose at a 2.2% annual rate in the second quarter, matching both the average of the past four quarters and the gain over the year. Equipment investment contributed 0.60 percentage points to that growth (0.12 in 2015-19) and intellectual property products 0.48 (0.34), while structures, residential investment and government together subtracted 0.32.
- Six industry groups supplied 70% of the growth. The groups we map to the seven forces contributed 1.54 of the 2.2 percentage points over the past four quarters, compared with 0.87 of 2.56 (34%) in 2015-19. The AI buildout group alone supplied 0.66 points.
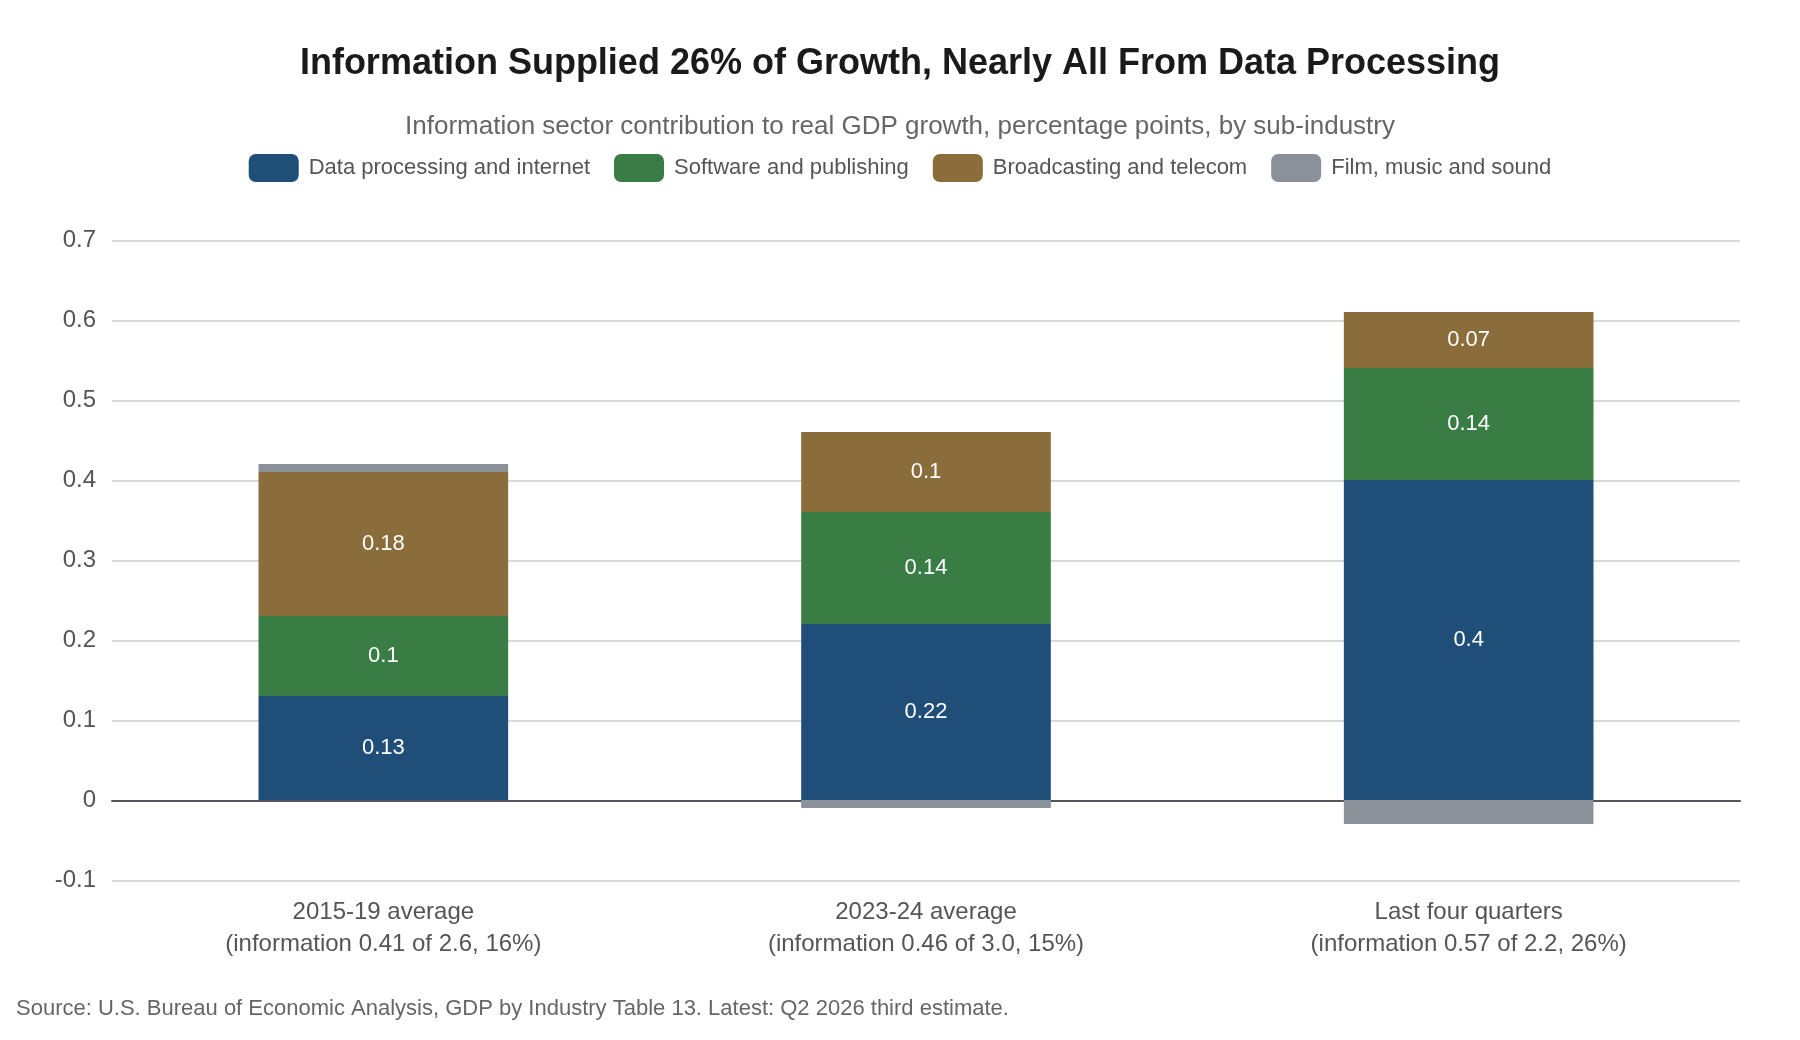
- Information is the largest single piece. The sector accounted for 0.57 percentage points of growth, or 26%, while making up 5.9% of nominal GDP, and data processing & internet publishing supplied 0.40 of that. State data trace 43% of the sector’s contribution to California and Washington, which hold 17% of national GDP.
- Factory-floor industries are growing several times as fast as the economy. Real value added rose 13.3% in fabricated metal products, 11.9% in other transportation equipment, 11.5% in machinery and 8.8% in electrical equipment over the past year, and the reshoring group’s contribution swung from -0.01 points in 2015-19 to 0.19.
- The drop in structures is the end of a federally funded plant boom. Real investment in manufacturing structures fell 25.7% over the past year and sits 34% below its third-quarter 2024 peak, and structures as a whole subtracted 0.21 percentage points from growth. Census data show computer, electronic and electrical plants, the CHIPS-era semiconductor and battery boom, account for 95% of the decline in factory construction, and construction of all other factories is roughly flat.
- Three forces are not yet visible in the aggregate data. National defense contributed 0.06 points (0.08 in 2015-19), chemical products, the industry that includes drug makers, contributed 0.03, and the group we use for Peak 65 contributed 0.46, a steady rather than accelerating pace.
- Imports absorbed part of the boom. Imports subtracted 0.73 percentage points from growth over the past four quarters, double the 0.36 drag in 2015-19, which fits a boom in which much of the computing hardware, along with the HVAC equipment for data centers, is imported.
The Overview
Real GDP grew at a 2.2% annual rate in the second quarter in the Bureau of Economic Analysis’s third estimate, the same pace as the average of the past four quarters (3.9%, 0.2%, 2.5% and 2.2%) and the 2.2% gain over the year. The headline is slower than both the 2.6% average of 2015-19 and the 3.0% average of 2023-24, but the composition has shifted in the direction our thesis of seven capital-intensive forces would predict. Consumer spending contributed 1.7 percentage points, about what it did before the pandemic, while equipment and intellectual property products together added 1.1 points, up from 0.5, and structures, housing and inventories held growth back.
Housing and public spending no longer carry their share. Residential investment subtracted 0.1 points over the past four quarters, structures subtracted 0.2 and government added essentially nothing (0.02), against a combined 0.6 points from the three in 2015-19 and 1.1 in 2023-24. The seven forces are the AI buildout, energy infrastructure upgrade, defense replenishment, civilian aerospace expansion and next-generation defense buildup, reshoring of critical industries and materials, next-era pharmaceutical investment and Peak 65. BEA’s industry accounts, published alongside this release, let us test how many of them show up in output rather than in announcements.
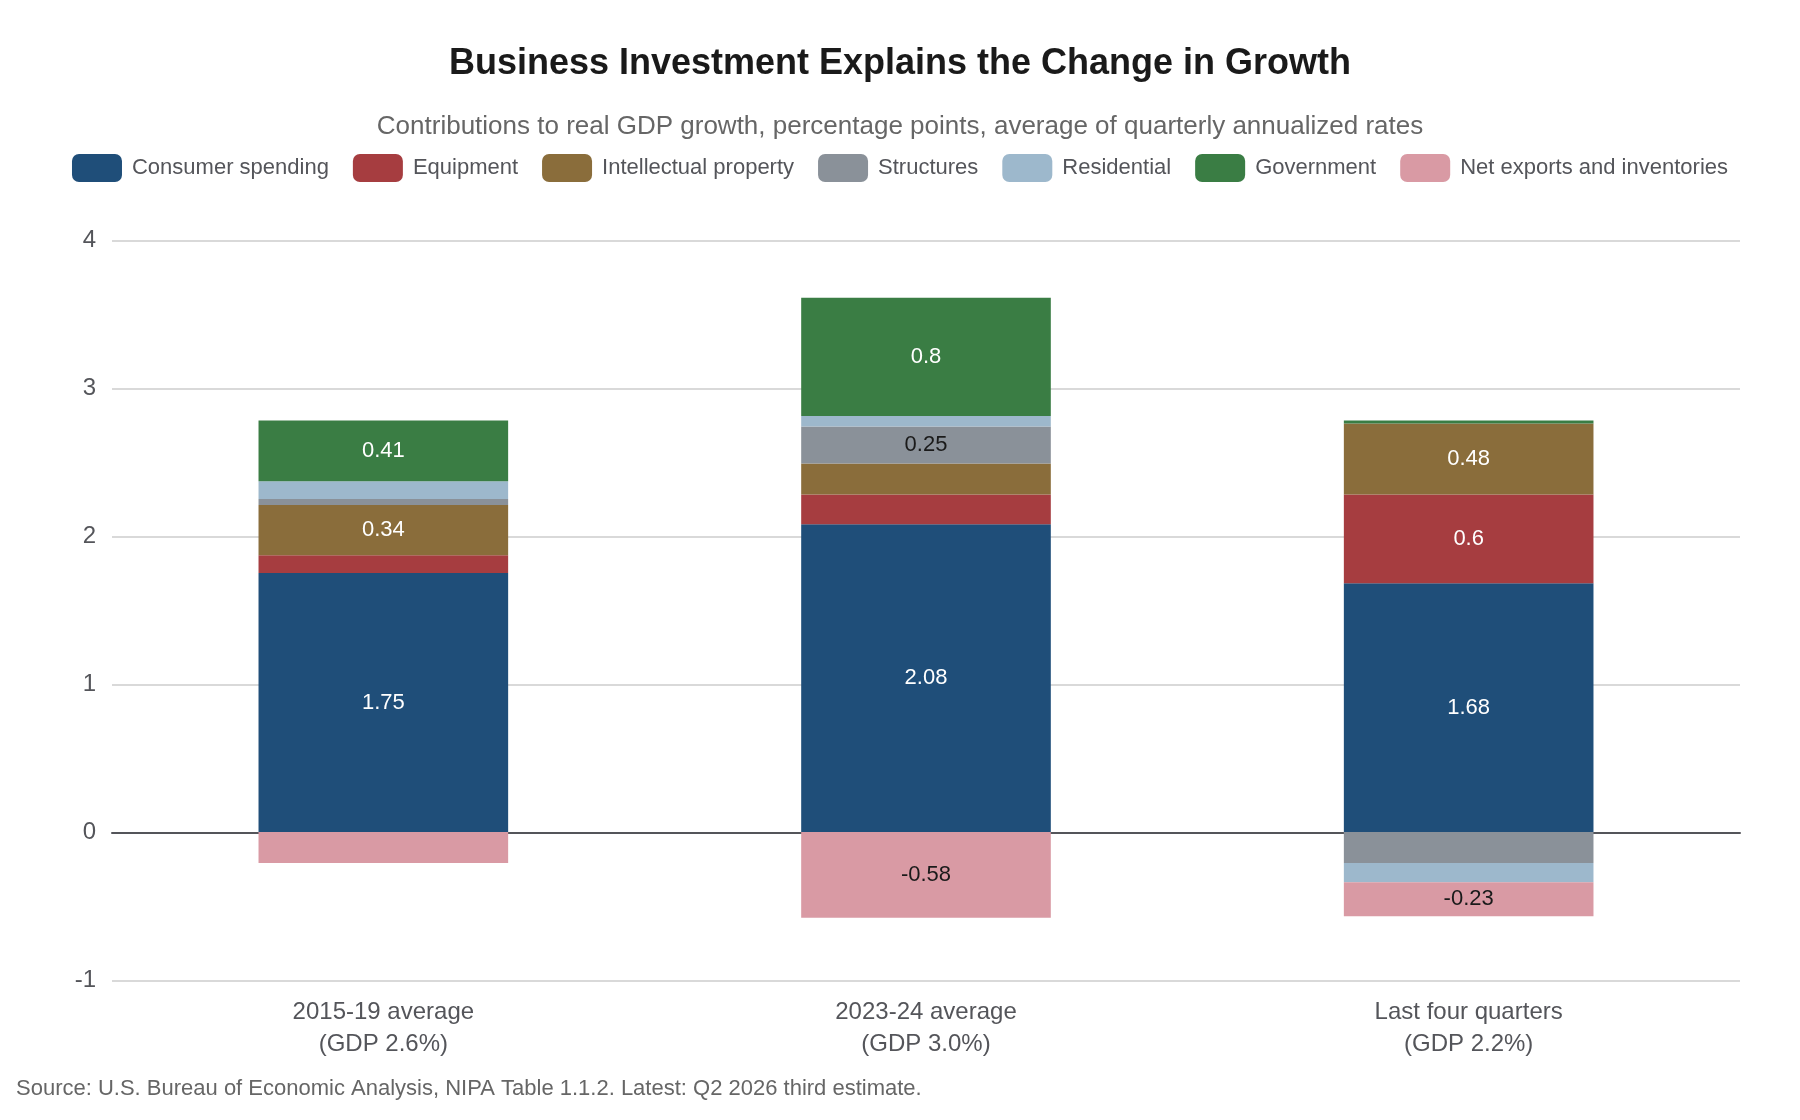
Business investment explains the change in growth, and imports explain why it is not larger. Imports subtracted 0.73 percentage points over the past four quarters against 0.36 in 2015-19, while exports added 0.63 points against 0.18, so the trade balance itself was a small drag (-0.10) even with a jump in foreign sales. Inventories subtracted another 0.13. Because equipment spending is measured gross of imports, and a significant amount of it, including the HVAC equipment that data centers require, is imported, the domestic industry data below are the better test of where the capital is actually being turned into output.
Where the Growth Came From
We sorted the industries in BEA’s contribution-to-growth table into six groups that map to the forces. The AI buildout group (data processing & internet publishing, software publishing, computer systems design and computer & electronic products) contributed 0.66 percentage points to growth over the past four quarters, up from 0.46 in 2015-19. Energy infrastructure (utilities, electrical equipment, pipeline transportation and support activities for mining) added 0.12 points after adding essentially nothing before the pandemic, and the reshoring group (machinery, fabricated metal products and primary metals) added 0.19 after subtracting 0.01. Aerospace and other transportation equipment contributed 0.08, up from 0.02, and chemical products, our pharmaceutical proxy, 0.03, up from 0.02. Health care and real estate, our closest industry proxy for Peak 65, contributed 0.46 against 0.38.
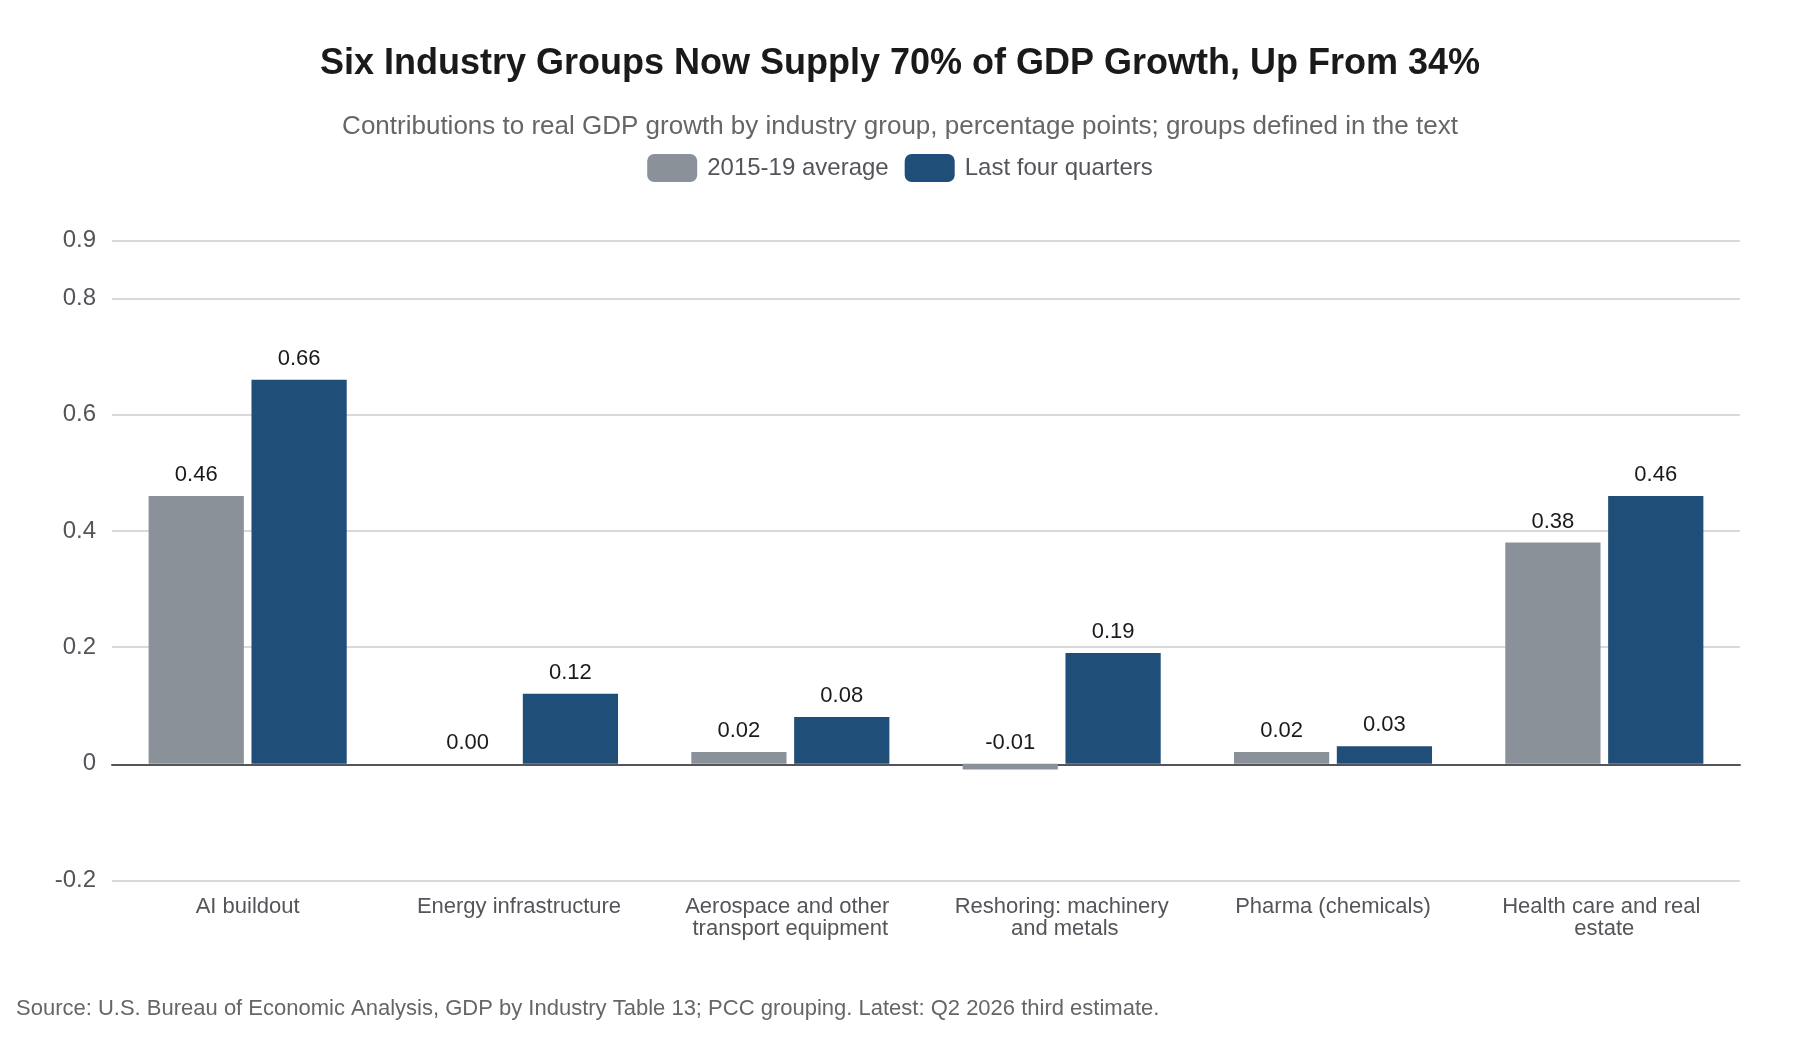
Together the six groups supplied 1.54 of the 2.2 points, or 70% of growth, compared with 34% in 2015-19. The composition matters, however. Nearly all of the increase comes from the AI buildout group and from the industrial groups, which together contributed 0.43 points, about 20% of growth, up from 0.03 (about 1%) in 2015-19. That is a large change from a small base, and it is concentrated in machinery, metals and electrical equipment rather than spread evenly across the forces. Health care and real estate contributed 0.46 points, more than the four industrial groups combined, but that pace was already largely in place before the forces took hold.
The Information Sector
The information sector deserves its own look, because it supplied 0.57 percentage points of the 2.2% growth over the past four quarters, or 26%, while accounting for only 5.9% of nominal GDP. In 2015-19 it supplied 0.41 of 2.56 points, or 16%. Data processing & internet publishing supplied 0.40 points of the 0.57, up from 0.13, and software and publishing added another 0.14. Broadcasting & telecommunications slipped to 0.07 from 0.18, and film, music & sound subtracted 0.03. Real value added in the sector rose 10.3% over the year, and in data processing & internet publishing it rose 22.1%, the fastest gain of any industry in Exhibit 4.
The state data released alongside the national estimates show where that growth is booked, and the list is short. Weighting each state’s information contribution by its share of nominal GDP, California and Washington, which together hold 17% of national GDP, account for 43% of the sector’s contribution over the past four quarters, and adding New York lifts the share to 60% with 25% of GDP. The 16 states we define as the South hold 36% of GDP and account for 22%. That geography tracks the headquarters of the largest software, internet and cloud companies, most notably in the Seattle area and the San Francisco Bay Area (including San Jose), but this release stops at the state level, so it cannot separate the Bay Area from the rest of California.
We would not read that map as a picture of where the activity takes place. Cloud services, software and online platforms are delivered to customers in every state, and the data centers, developers and support staff behind them are spread across the country. State GDP appears to allocate the value added largely to where the firms’ establishments and payrolls are located, so the sector looks outsized in a few headquarters locations and is hard to quantify anywhere else. The quarterly state figures are also volatile: Washington’s information contribution to its own growth was 2.2 percentage points in the third quarter of 2025 and has averaged about zero since (-0.4, 0.3 and 0.0 in the following three quarters).
What Industry Output Shows
Real value added points the same way. Of the 16 industries we track in Exhibit 4, the nine fastest-growing over the past year are all tied to the forces: data processing & internet publishing (+22.1%), fabricated metal products (+13.3%), other transportation equipment (+11.9%), machinery (+11.5%), electrical equipment (+8.8%), software publishing (+8.5%), computer systems design (+7.4%), primary metals (+6.0%) and utilities (+5.9%), against 2.2% for the economy as a whole. Retail trade (-0.7%), nondurable goods manufacturing (-3.2%) and transportation & warehousing (-4.0%) shrank.
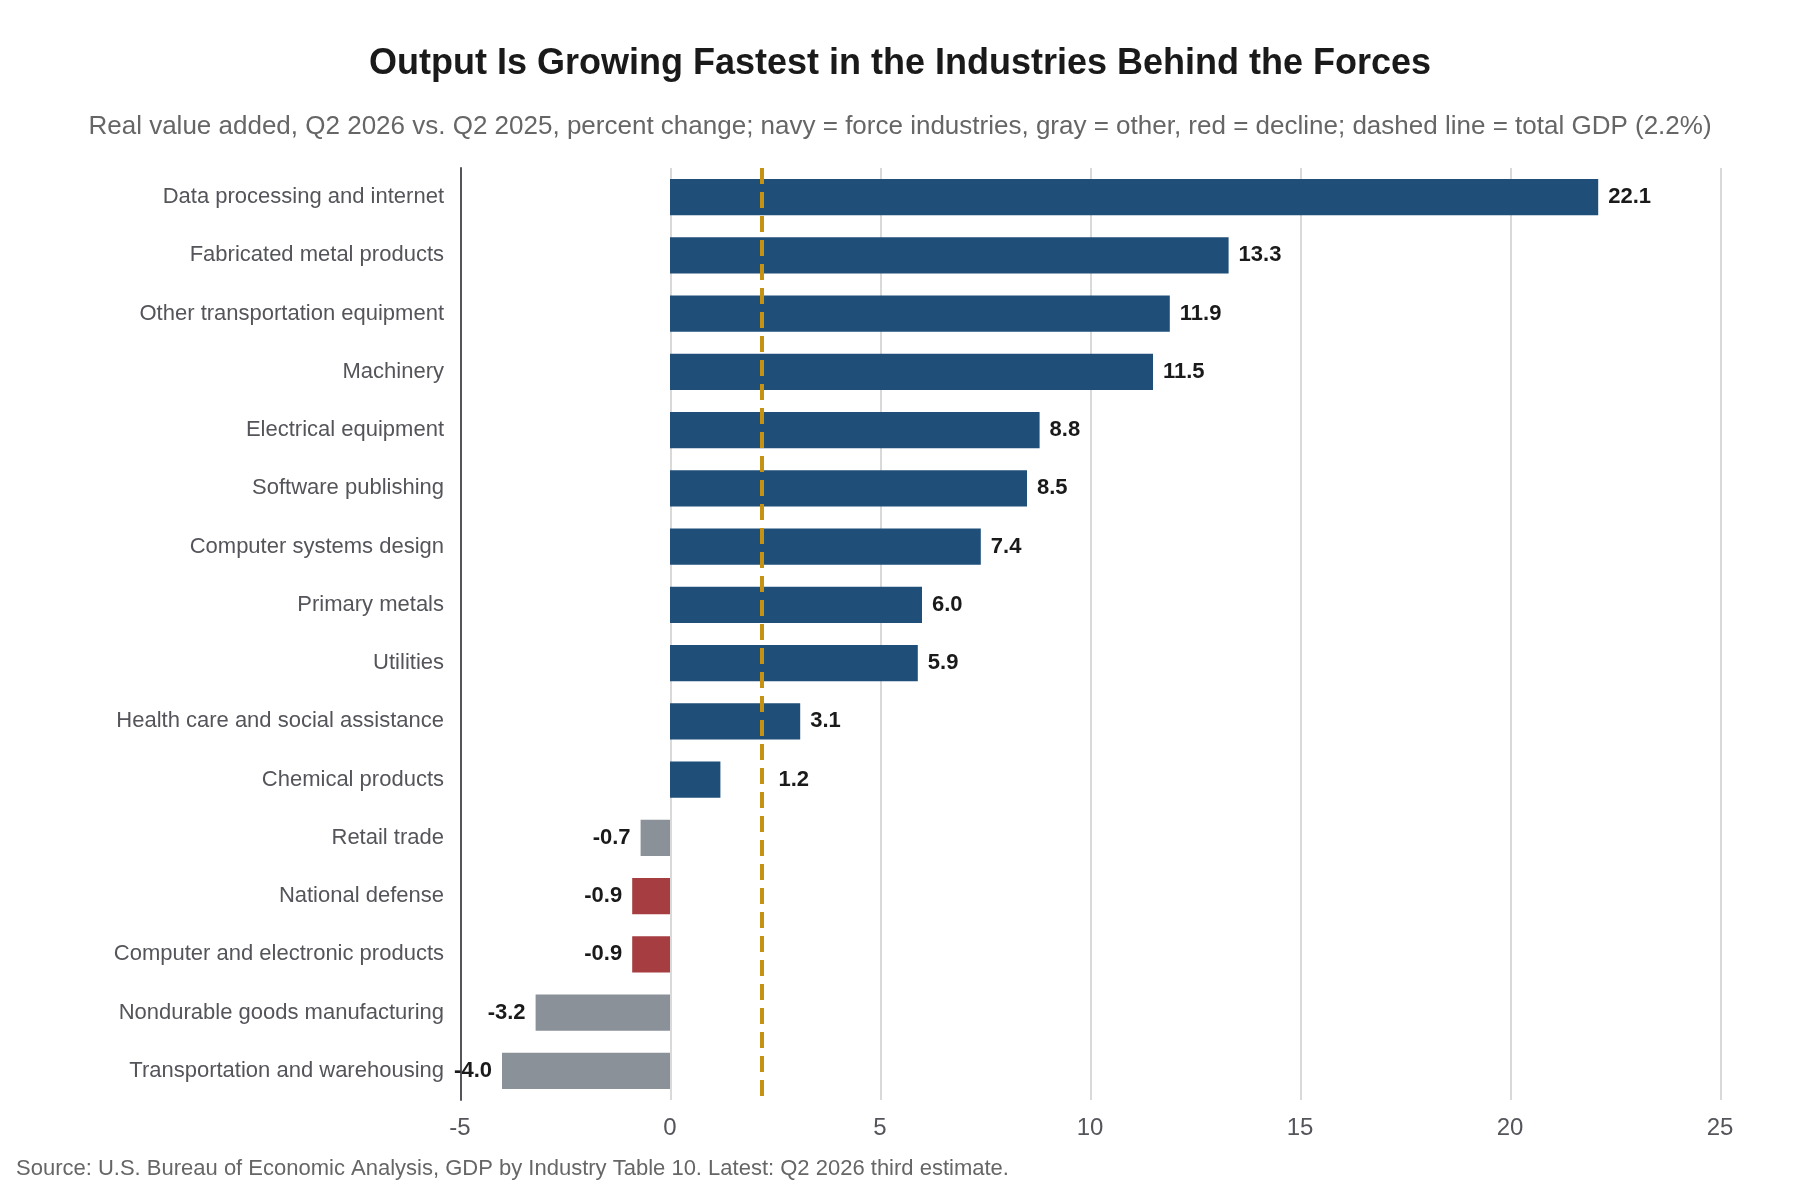
One line in Exhibit 4 argues against reading the equipment boom as domestic manufacturing strength. Real value added in computer & electronic products fell 0.9% over the year, even though real investment in computers and peripheral equipment rose 43.3%. The gap is consistent with imports supplying a large share of the hardware (and of the HVAC equipment that data centers require), and it explains why the gains show up in software, data processing and computer systems design, the industries that install and run the equipment, rather than in the factories that make it.
The Investment Gap in Structures
The weak spot in the buildout is structures, and the weakness has a specific source. Real investment in computers and peripherals is 198% above its fourth-quarter 2019 level (an index of 298) and software is 98% higher (198), but manufacturing structures, which had more than doubled to an index of 222 by the third quarter of 2024, has since fallen 34% to 147, including a 25.7% decline over the past year. Power & communication structures are still 6% below their 2019 level (an index of 94). Structures as a whole subtracted 0.21 percentage points from growth over the past four quarters. The decline reflects the passing of the peak buildout of federally funded battery and semiconductor plants. Census data through July show computer, electronic and electrical manufacturing construction down 45.4% year to date, which accounts for 95% of the entire category’s decline, while construction of all other factories is down only about 2%, essentially flat, and chemical plants, which include pharmaceutical plants, are down 1.2%.
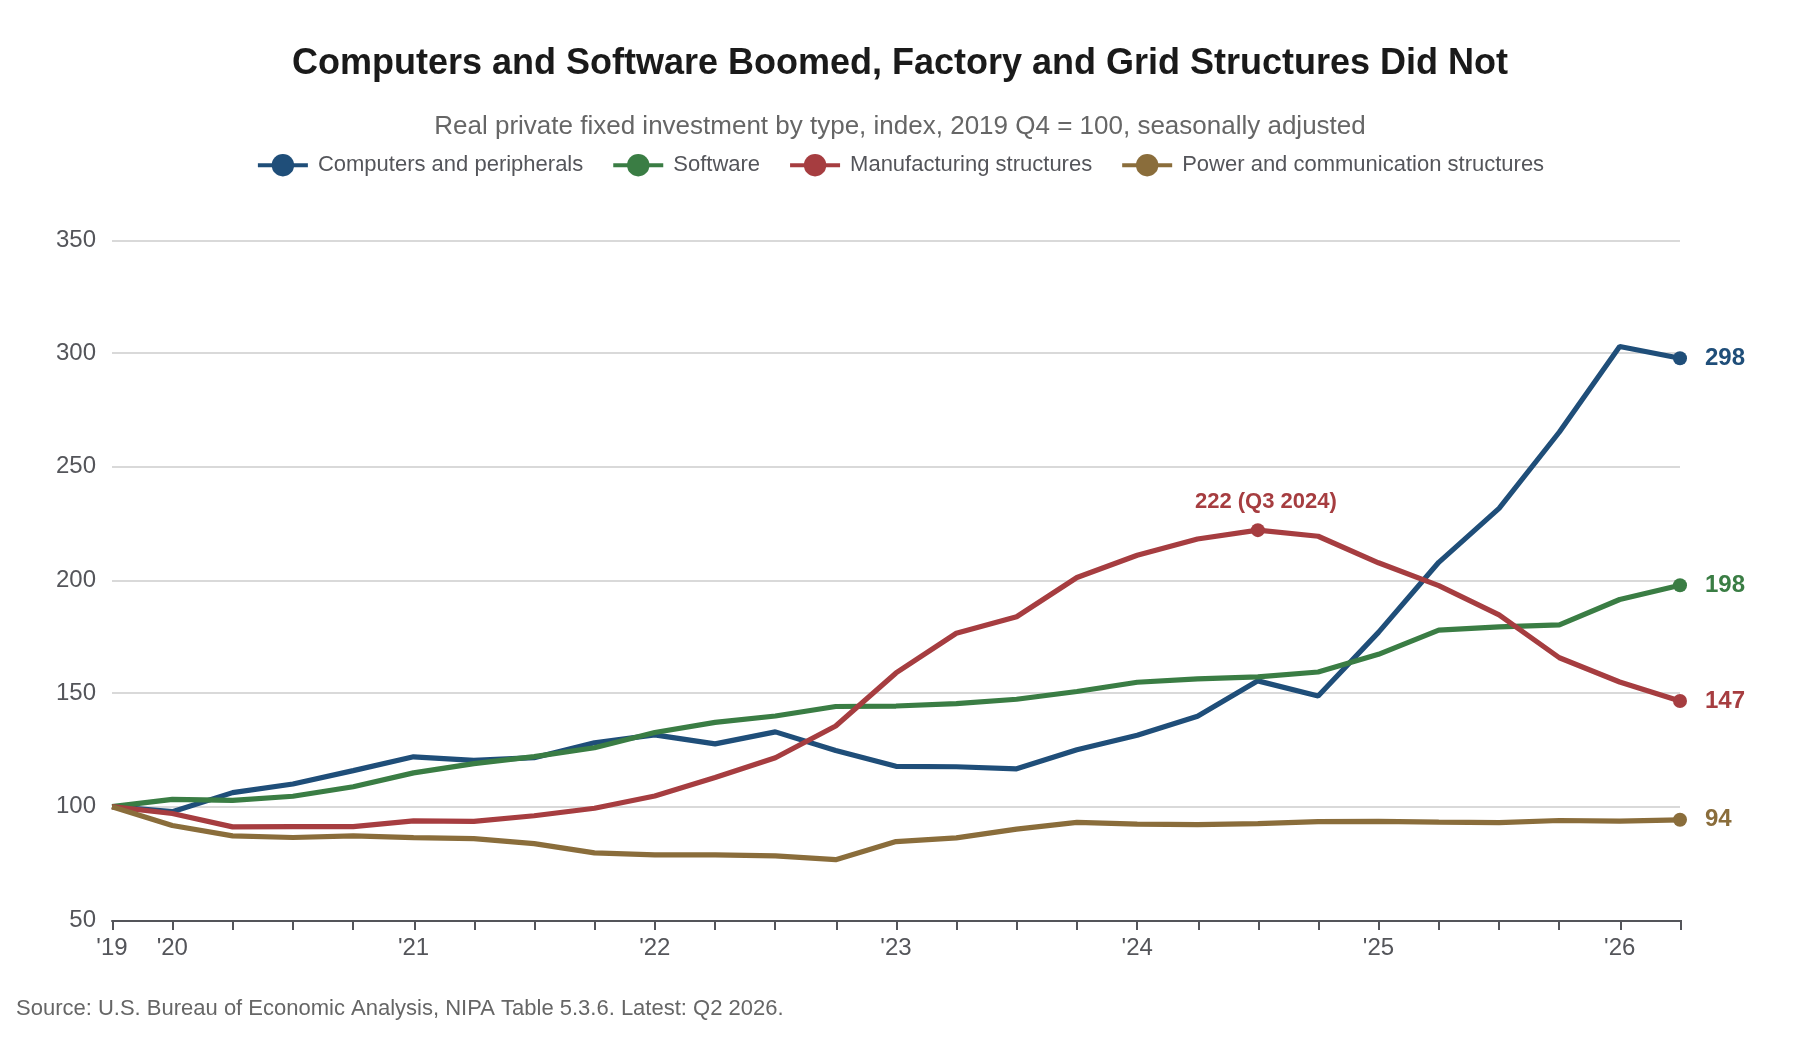
The forces we describe require plants, grids and pipelines as well as chips and code, so a turn in structures outside the chip and battery plants is the evidence we most want to see before calling the buildout broad. Utilities output is up 5.9% over the year and electrical equipment 8.8%, which suggests the demand is there, but the investment that expands transmission and generation capacity has not yet shown up in the accounts.
Three Forces the Data Do Not Yet Show
Defense replenishment appears in neither measure. National defense spending contributed 0.06 percentage points to growth over the past four quarters, no more than the 0.08 of 2015-19, and real value added of federal defense fell 0.9% over the year. Pharmaceuticals are not visible either, since chemical products, the industry that includes drug makers, rose only 1.2% and contributed 0.03 points. Peak 65 is real but steady, with health care & social assistance up 3.1% and the health care and real estate group contributing 0.46 points against 0.38 in 2015-19.
None of the three is a reason to abandon the thesis, because defense procurement and drug plant construction typically take years to reach output, and aggregate accounts are slow to register them. They are, however, the parts of the thesis a skeptic can fairly say have yet to arrive.
Our Call
The industry data support the thesis where it is easiest to measure and leave three forces unproven. Six industry groups now supply 70% of growth, and equipment and software investment have replaced housing and government as the swing components of GDP. We are not changing our forecast on the strength of this release. Here is the test, with dates: the advance estimate of third-quarter GDP should show equipment and intellectual property products contributing at least 1.0 percentage point combined (1.08 over the past four quarters), and structures should stop subtracting. If structures keep shrinking while computer investment slows, the buildout is narrower than we argue. And until national defense contributes more than the 0.08 points it did in 2015-19, we would not treat replenishment as visible in output.
President & Chief Economist, Piedmont Crescent Capital
Sources
U.S. Bureau of Economic Analysis, Gross Domestic Product (Third Estimate), Industries, Corporate Profits, State GDP, and State Personal Income, 2nd Quarter 2026; State Personal Consumption Expenditures, 2025 (released September 30, 2026), including GDP by Industry Tables 5, 10 and 13, National Income and Product Accounts Tables 1.1.2 and 5.3.6, and Regional Accounts tables SQGDP1, SQGDP9 and SQGDP11. Industry groups, state weights by nominal GDP and the four-quarter and 2015-19 averages are PCC calculations. Exhibit 1 averages quarterly annualized contributions; the 2015-19 and 2023-24 averages in Exhibits 2 and 3 use annual contributions.
This report reflects the analysis and opinions of Piedmont Crescent Capital as of the date shown and is provided for general informational purposes only. It does not constitute investment, legal, or tax advice, is not an offer or solicitation, and should not be relied upon as the basis for any investment decision. Forecasts and other forward-looking statements are inherently uncertain and actual outcomes may differ materially.