
Economic Indicator Report · Retail Sales, August 2026
Broad and Real, Except at the Pump
Retail and food services sales rose 1.2% in August, and all thirteen major categories are higher than a year ago. Gasoline's gain is almost entirely pump prices; strip it out and the control group's 1.4% increase, running near a 5% real annual pace, stands on its own.
Early Signals
- The headline, and what it hides. Retail and food services sales rose 1.2% in August after falling a revised 0.5% in July. Sales are up 6.0% over the past twelve months, and every one of the thirteen major categories Census tracks is higher than it was a year ago.
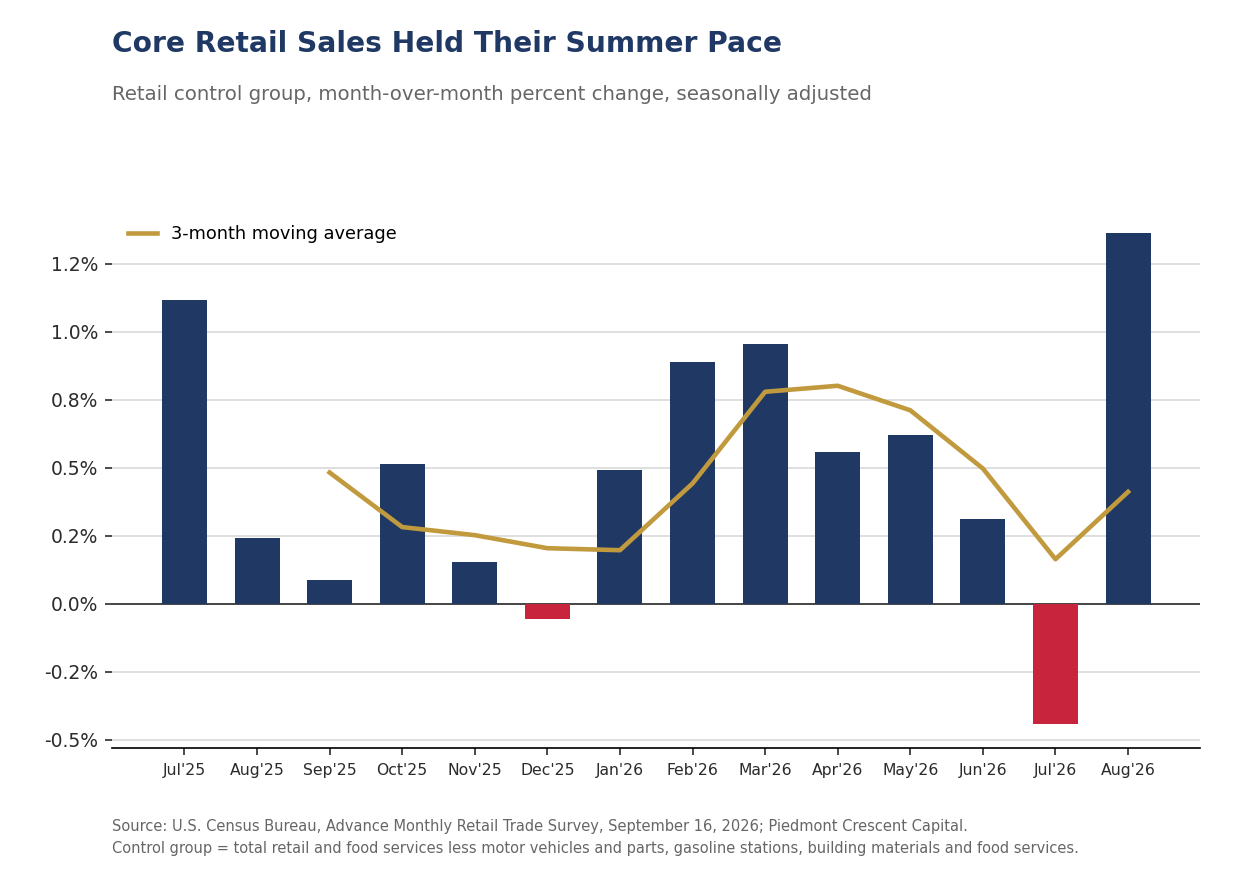
- The control group is the number that matters. Core retail sales, which exclude motor vehicles, gasoline, building materials and food services, rose 1.4% in August and are running a 4.4% annualized pace over the past three months. This is the series that feeds the goods side of personal consumption in the national accounts, and it says July's soft patch did not carry into August.
- Nothing moved on the calendar this month. Unlike July, when Amazon's shift of Prime Day into late June scrambled the seasonal adjustment, August carries no manufactured shopping event that changed months. Back-to-school buying and state sales-tax holidays landed in their usual early-to-mid-August window.
- Vehicles and gasoline, the two swing categories. Motor vehicle and parts dealers rose 0.6%, confirmed by light-vehicle unit sales rising to a 16.8 million annual rate from 16.3 million in July. Light vehicle sales are inversely related to gasoline prices and should have weakened as energy prices increased. Gasoline stations rose 3.1%, almost entirely a price story: the average price of regular gasoline rose from $3.93 to $4.06 a gallon and has kept climbing since, to $4.32 by mid-September.
- Goods versus services, read through the restaurant line. Food services and drinking places rose 1.2%, in line with the rest of the report, and restaurants held their usual 13.6% share of total sales. Households are not cutting the discretionary line they can cancel first.
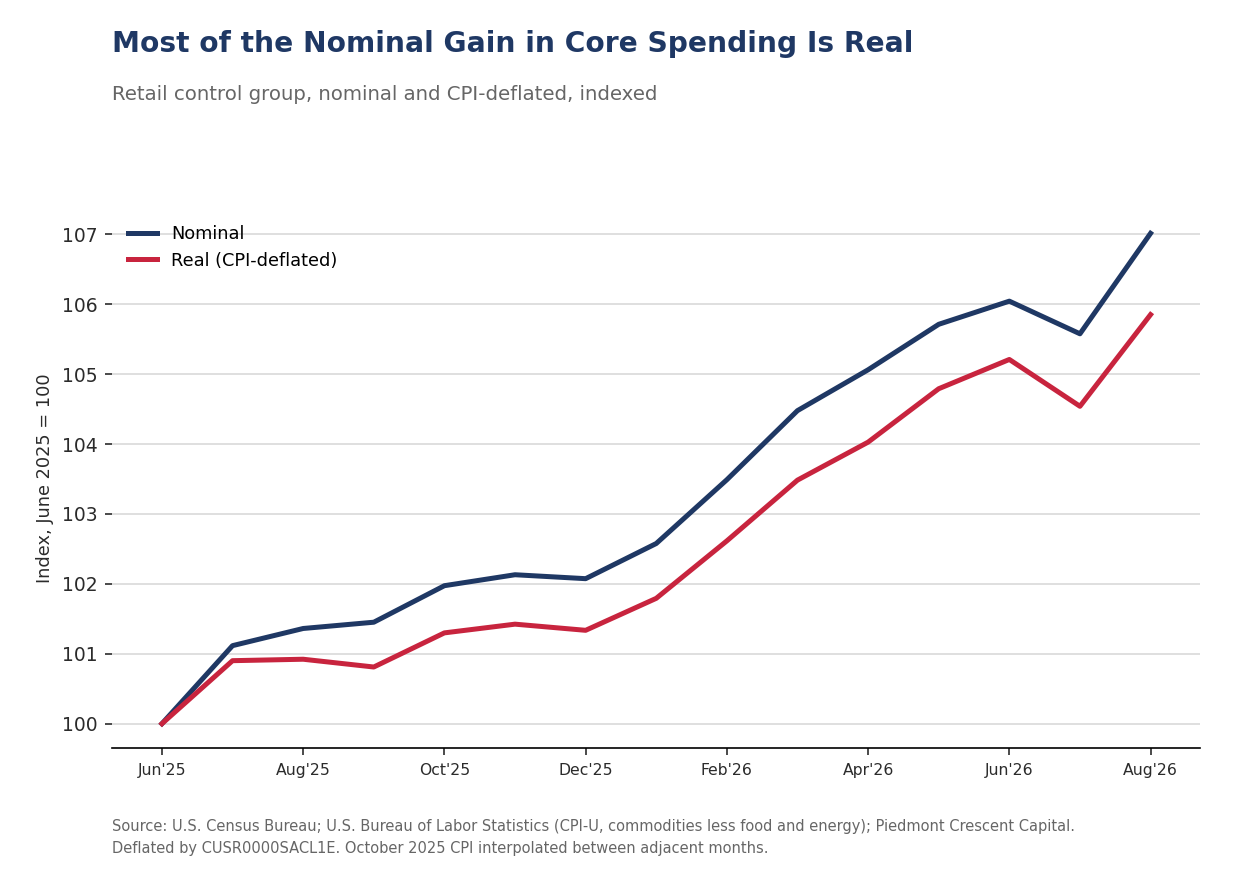
- Nominal is not real. Deflating the control group by the CPI for commodities less food and energy puts real core spending up 1.3% on the month and 4.9% over the past year. Consumers bought more in August; they did not simply pay more for the same basket. The strength is at odds with weaker consumer sentiment numbers but largely follows the K-shaped story that has been a hallmark of this expansion. A good part of this strength is coming from the growing retiree-aged population, which is benefitting from rising asset prices.
Key Takeaways
| Key Concept | Findings |
|---|---|
| Headline retail sales | Up 1.2% in August; up 6.0% over the year. Gasoline and the control group did the lifting; building materials was the only category to fall. |
| Retail control group | Up 1.4%. The GDP-relevant read. Running a 4.4% annualized pace over the past three months. |
| Motor vehicles | Up 0.6%, consistent with light-vehicle unit sales rising to a 16.8 million annual rate from 16.3 million in July. |
| Gasoline stations | Up 3.1%. The average retail price rose from $3.93 to $4.06 a gallon; the dollar gain is almost entirely price, not volume. |
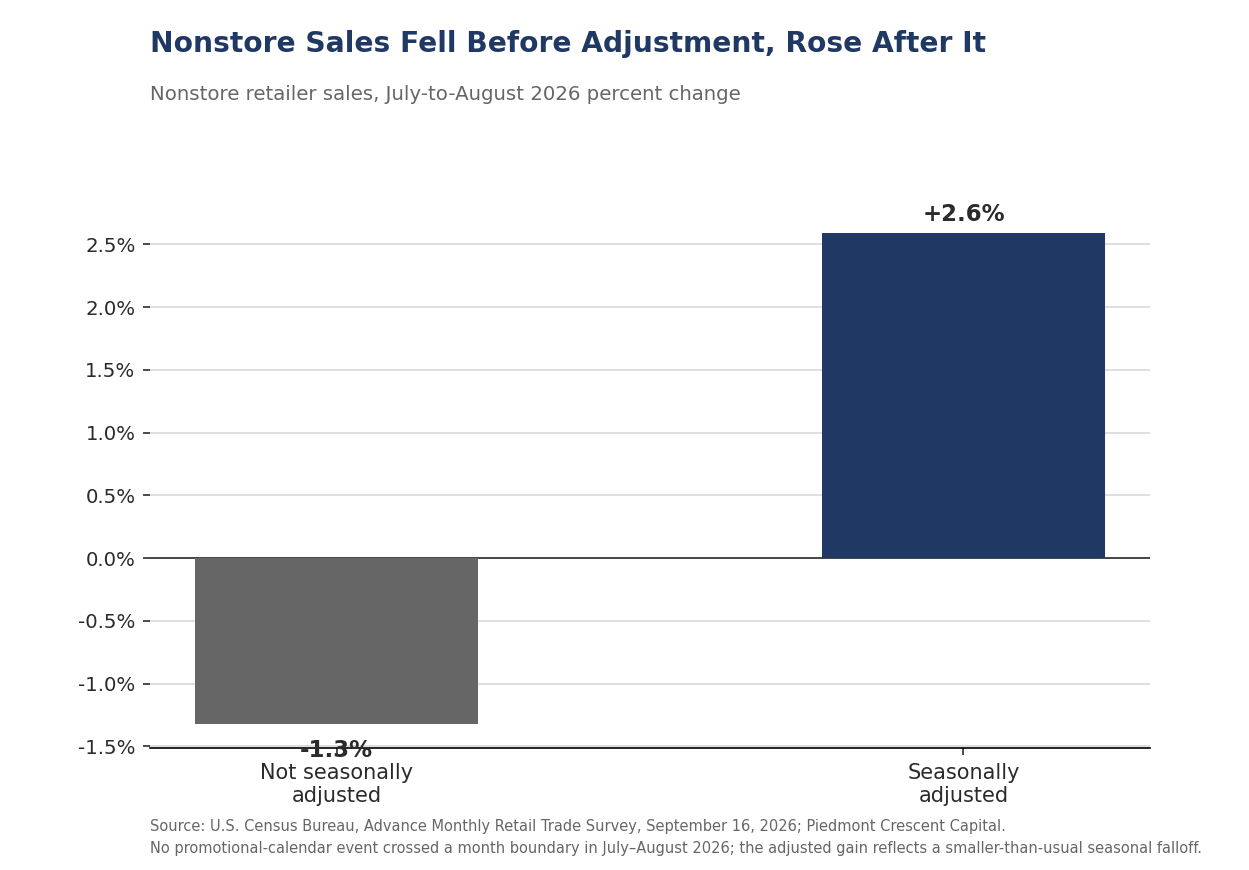
| Nonstore retailers | Up 2.6%. No promotional-calendar shift this month; the gain reflects a smaller-than-usual seasonal falloff in the unadjusted data. |
| Restaurants and bars | Up 1.2%. The discretionary services read; restaurants' share of total sales held steady at 13.6%. |
| Revisions | July revised from -0.6% preliminary to -0.5% in this release. Revisions of this size are typical; Census puts the average absolute revision at about two-tenths of a point. |
| Real spending | Control group deflated by core-commodity CPI: up 1.3% on the month, up 4.9% over the year. |
The Overview
August's retail sales report is a good one, and it does not take much interpretation to get there. Sales rose 1.2%, every one of the thirteen major categories Census tracks is higher than it was a year ago, and the control group, the piece that actually feeds goods consumption in the national accounts, rose 1.4% and is running a 4.4% annualized pace over the past three months. Real core spending, adjusted for the CPI for commodities less food and energy, is up 4.9% over the past year. Consumers bought more. They did not simply pay more for the same basket.
Twelve of the thirteen major retail categories rose in August, and every one of the thirteen is higher than it was a year ago.
But the headline leans in part on two categories that are not, in the plainest sense, about the consumer. Gasoline stations added 0.24 percentage points to the total, and almost all of it is the average pump price, which rose from $3.93 to $4.06 a gallon in August and has kept climbing since, to $4.32 by the week of September 14, a run consistent with the Hormuz-related supply disruptions we have been tracking since late February. Strip gasoline out and the ex-gasoline total still rose 1.1%, and the control group's 1.4% gain stands on its own. This is a report about a consumer spending more, not one merely paying more, with gasoline being one major exception.
Where the Month's Noise Came From
Motor vehicles and gasoline together run about a quarter of the headline and, as usual, accounted for most of its month-to-month swing. Motor vehicle and parts dealers, 18.5% of total sales, rose 0.6% and added 0.11 percentage points to the headline. Gasoline stations, 7.9% of the total, rose 3.1% and added 0.24 points on their own, nearly a fifth of the entire 1.24-point gain, from one category that measures dollars, not gallons.
The average retail price of regular gasoline rose from $3.93 a gallon in July to $4.06 in August, an increase of about 3.3%, almost exactly the size of gasoline stations' 3.1% sales gain. That is not a coincidence: when the price of gasoline moves roughly in step with gasoline station sales, the volume of gasoline actually purchased is close to flat, and a rising gasoline bill is a transfer out of the rest of the household budget rather than new demand. Prices have kept climbing since the report's reference period, to $4.32 a gallon by the week of September 14, a five-week run consistent with the Hormuz-related disruptions to tanker traffic we have been tracking since late February. If that continues, expect September's gasoline station sales to keep outrunning the volume story, and expect it to start showing up as a drag on the categories households can trim first.
The Control Group: What Actually Feeds GDP
The control group, total retail and food services less motor vehicles and parts, gasoline stations, building materials and garden equipment, and food services, rose 1.4% in August to $422.0 billion. It is running a 4.4% annualized pace over the past three months and is up 5.6% over the past year. This is the series BEA uses as the primary monthly input to goods consumption, and it says July's softness (the control group fell 0.4% that month) did not carry into August.
The Promotional Calendar
Retail sales are shaped every summer and fall by a handful of manufactured shopping events whose dates move, and August is normally the quietest of them: back-to-school buying and most state sales-tax holidays, rather than a single Amazon-scale event. Unlike July, when Prime Day's move into late June scrambled the seasonally adjusted figures for two months running, nothing shifted across the June-July-August boundary this year.
The evidence is in the not-seasonally-adjusted data. Nonstore retailers fell 1.3% in August before seasonal adjustment, the ordinary late-summer pattern as the promotional peak fades. Census's seasonal factors expected an even larger decline, so the smaller-than-usual drop translated into the seasonally adjusted 2.6% gain shown in Exhibit 2. That is the adjustment working as intended, not a distortion to correct for.
The recurring calendar. July: back-to-school promotions begin in the last week; Amazon Prime Day fell in July every year from 2015 through 2025 except 2020 (October) and 2021 (June), and moved to late June in 2026. August: back-to-school peak, most state sales tax holidays. October: the second Prime event, "Prime Big Deal Days," since 2022. November: Black Friday and Cyber Monday, whose split between November and December turns on the Thanksgiving date. December: the number of shopping days between Thanksgiving and Christmas, which has ranged from 26 to 32. Easter moves between March and April. Census adjusts for trading days and for Easter, but there is no Prime Day regressor in the seasonal adjustment.
A Seasonal Read on August
August is normally a strong, unambiguous month for retailers: it carries the back-to-school peak and the bulk of state sales-tax holidays, both of which land in the first three weeks of the month in most years. This year's pattern is consistent with that. Clothing and accessories rose 0.7%, sporting goods and hobby stores, which carry school supplies, rose 1.2%, and general merchandise rose 0.7% even as department stores specifically fell 0.8%, the ordinary substitution toward warehouse clubs and off-price retailers that shows up every back-to-school season. Back-to-school sales provide a good early prediction of the holiday shopping season.
August, specifically. August is usually the cleanest read of the three summer months. The back-to-school season is in full swing rather than just beginning, most state sales-tax holidays have already landed, and the model-year vehicle changeover that complicates July has mostly worked through the system. This year's August looks like a clean read: broad, positive, and free of the calendar noise that shaped the July report. The one caveat is gasoline, addressed above, where a genuine price move, not a calendar effect, did some of the headline's work.
Goods, Services and the Restaurant Line
Food services and drinking places, the only services line in this report and worth about a seventh of the total, rose 1.2% in August and are up 5.8% over the past year. Restaurants and bars are the discretionary category households can cancel first when they are worried about the outlook, and their share of total retail and food services sales held essentially flat at 13.6%, unchanged from July. That share has not eroded, which argues against a consumer pulling back on services to protect goods spending, or the reverse.
Where this report and the broader spending data could still diverge is on the income side. The August personal income and outlays report, due from BEA in the final week of September, will show whether income growth is keeping pace with the spending described here, or whether households are drawing down savings to fund it.
From Nominal to Real
This report is nominal, and August's price backdrop makes the distinction matter less than usual. The CPI for commodities less food and energy rose just 0.1% in August and 0.7% over the past year, so deflating the control group barely changes the monthly read: real core spending rose 1.3% on the month, is running a 4.3% annualized pace over three months, and is up 4.9% over the past year, faster than the nominal figure since goods prices excluding food and energy have been essentially flat. The gain here is real, not just higher prices.
What This Means for Third-Quarter Consumer Spending
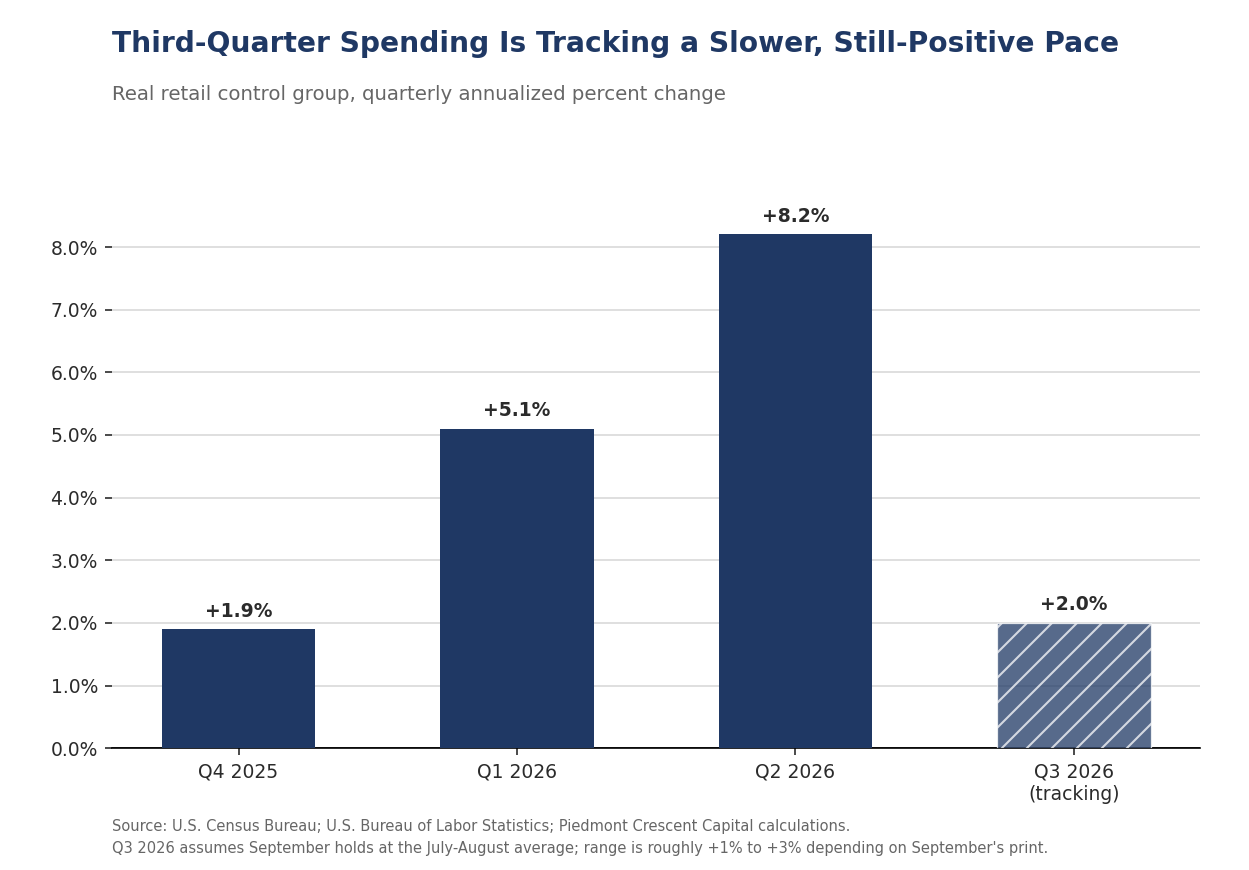
August is the second month of the third quarter, so a real tracking estimate is possible before September reports. Real core spending rose 1.3% in August after falling in July; averaging the two months and holding September flat at that average tracks a 2.0% annualized gain for the third quarter against the second quarter's average, a step down from the second quarter's 8.2% pace but still a positive one. A September as strong as August would lift the tracking estimate toward 2.9%; a September as soft as July would pull it down toward 1.2%. Our forecast remains at 2.1%.
The condition that would break this call: if September's real control group falls back to July's weaker level rather than holding near the July-August average, the quarter's pace slows toward 1%, and the case that August marked a genuine reacceleration weakens.
Our Call
Our Call
The August retail sales report supports the house view that the consumer is not cracking. Broad-based, real gains across twelve of thirteen major categories, with every category higher than a year ago, are not the profile of a household retrenching ahead of a downturn.
The mechanism is the K-shaped, capital-led expansion we have described in prior issues: income and spending remain concentrated among households whose earnings track capital and high-skill labor rather than the broad wage base, and that group's spending has held up even as gasoline prices climb on Hormuz-related supply disruptions. Real core-goods spending accelerating to a near-5% annual pace, even as underlying inflation stays contained near our 2.9% estimate, gives the Federal Reserve no cover for a near-term cut.
We expect the September retail sales report, due October 15, to show the control group holding a 3% or better annualized pace; a reading below that, especially if paired with a nonstore retreat, would be the first real evidence that August's strength was a back-to-school pull-forward rather than a trend. Our call remains no cut in 2026, with the next move more likely a hike in the first half of 2027.
Bottom Line
August was a good, broad retail sales report, and the one place it leans on something other than demand, gasoline, is easy to identify and separate out. The control group rose 1.4%, real core spending is running near a 5% annual pace, and every major category is higher than a year ago. The report does not argue for a Federal Reserve in a hurry to cut, and we do not think it should.
What We Are Watching
- September retail sales, Census Bureau, October 15, 2026. The control group should hold near a 3% annualized pace or better; a slip back under that would suggest August's strength leaned more on back-to-school timing than we think.
- Census's benchmark revision, tentatively scheduled for September 28, 2026, drawing on the 2023-2024 Annual Integrated Economic Survey. A material downward revision to the recent control-group path would weaken the case made here.
- The weekly EIA retail gasoline price. If it holds above $4.30 a gallon into early October, expect gasoline stations to keep outrunning volume growth, and expect the squeeze to spread into the discretionary spending we track elsewhere in this report.
Appendix: Retail Sales Detail
| Category | Aug. m/m | 3-mo ann. | 12-mo |
|---|---|---|---|
| Retail and food services, total | 1.2% | 4.9% | 6.0% |
| Retail trade | 1.2% | 4.1% | 6.0% |
| Control group | 1.4% | 4.4% | 5.6% |
| Motor vehicle and parts dealers | 0.6% | 8.2% | 2.1% |
| Furniture and home furnishings | 0.9% | 2.8% | 1.9% |
| Electronics and appliances | 1.6% | 4.5% | 7.8% |
| Building materials and garden | -0.2% | 4.1% | 5.1% |
| Food and beverage stores | 0.4% | 0.4% | 0.5% |
| Health and personal care | 0.9% | 2.4% | 1.9% |
| Gasoline stations | 3.1% | -7.0% | 21.0% |
| Clothing and accessories | 0.7% | 3.7% | 4.3% |
| Sporting goods, hobby, book and music | 1.2% | 7.8% | 10.7% |
| General merchandise | 0.7% | 3.7% | 4.5% |
| Miscellaneous store retailers | 1.9% | 18.8% | 14.0% |
| Nonstore retailers | 2.6% | 6.6% | 9.9% |
| Food services and drinking places | 1.2% | 11.2% | 5.8% |
Computation notes: Three-month annualized rates are computed on seasonally adjusted levels as the compound annual rate of change of the latest three-month average over the prior three-month average. Real series deflate the control group by the CPI for commodities less food and energy commodities, not seasonally adjusted where the nominal series is not. Quarterly tracking estimates use the average of monthly levels within the quarter, annualized against the prior quarter's average. The advance report is based on a subsample and is revised in the full Monthly Retail Trade Survey two weeks later; the second revision often exceeds the original monthly change.
Sources: U.S. Census Bureau, Advance Monthly Sales for Retail and Food Services, August 2026; U.S. Bureau of Labor Statistics, Consumer Price Index; U.S. Bureau of Economic Analysis, Personal Income and Outlays; U.S. Energy Information Administration, Weekly Retail Gasoline Prices; Piedmont Crescent Capital.
Disclaimer: This report is provided for informational purposes only and does not constitute investment, legal, tax or accounting advice. Information is believed to be reliable but is not guaranteed. Opinions are those of the author as of the date of publication and are subject to change without notice.
Mark P. Vitner
Chief Economist, Piedmont Crescent Capital
mark.vitner@piedmontcrescentcapital.com · (704) 458-4000