2023 Economic Outlook: Recession, Soft Landing or Something Else
- Most forecasts for the coming year call for a ‘mild’ recession beginning the middle of 2023 and lasting for around six months.
- Recent economic reports (employment, ISM surveys and consumer spending) have been more supportive of the possibility the Fed will achieve a soft landing.
- Inflation has proven more persistent than policymakers expected, yet inflation expectations continue to trend back toward pre-pandemic levels.
- The Fed is now expected to raise the federal funds to more than 5% and hold rates at that higher level, even if nonfarm payrolls decline modestly later this year.
- The yield curve is widely expected to remain negative through 2024, implying a prolonged period of sluggish economic growth or ‘low-altitude stagflation’.
One common theme in economic forecasts this year is an expectation the economy will slip into a ‘mild’ recession around the middle of 2023, largely in response to the Fed’s aggressive interest-rate hikes. A small handful of forecasters expect the economy to narrowly avoid a recession, with growth decelerating just enough to allow inflation to ease but not so much that the unemployment rate spikes. Another alternative is a return of the rolling recessions we saw in the 1980s, where parts of the economy fall into recession, but the overall economy continues to grow.
Our forecast is a bit of hybrid. While we still see a narrow path to a soft landing, we fear the rolling recessions currently underway in the technology sector, housing, and commercial real estate will ultimately spread to the financial sector and pull the broader economy into recession later this year.
The National Bureau of Economic Research (NBER) – the organization responsible for determining when recessions begin and end – defines a recession as “a significant decline in economic activity that is spread across the economy and that last more than a few months.” The NBER assesses a variety of indicators to confirm whether a decline in economic activity has been significant and widespread enough to qualify as a recession, including nonfarm employment, real personal consumption, real wholesale and retail sales, household employment and industrial production

What constitutes a mild recession is open to debate. The word mild sharply contrasts with the NBER’s definition of ‘a significant decline’. The last two recessions were the two deepest in the postwar era, with real GDP plunging 9.6% during the short 2-month recession that coincided with the lockdowns at the start of the pandemic and tumbling 4.0% over the course of the long recession that accompanied the housing bust and Global Financial Crisis. By contrast the average post-World War II recession has seen real GDP decline 2.7% and lasted 10.3 months. If the short pandemic downturn is excluded, the average decline falls to 2.1% and length extends to 11.1 months.
By definition, a mild recession should be less severe than the average recession. As such, real GDP, employment, and real after-tax income should decline less than they did in the average downturn and the unemployment rate should rise less. The contraction in economic activity should also be shorter than the average postwar recession.
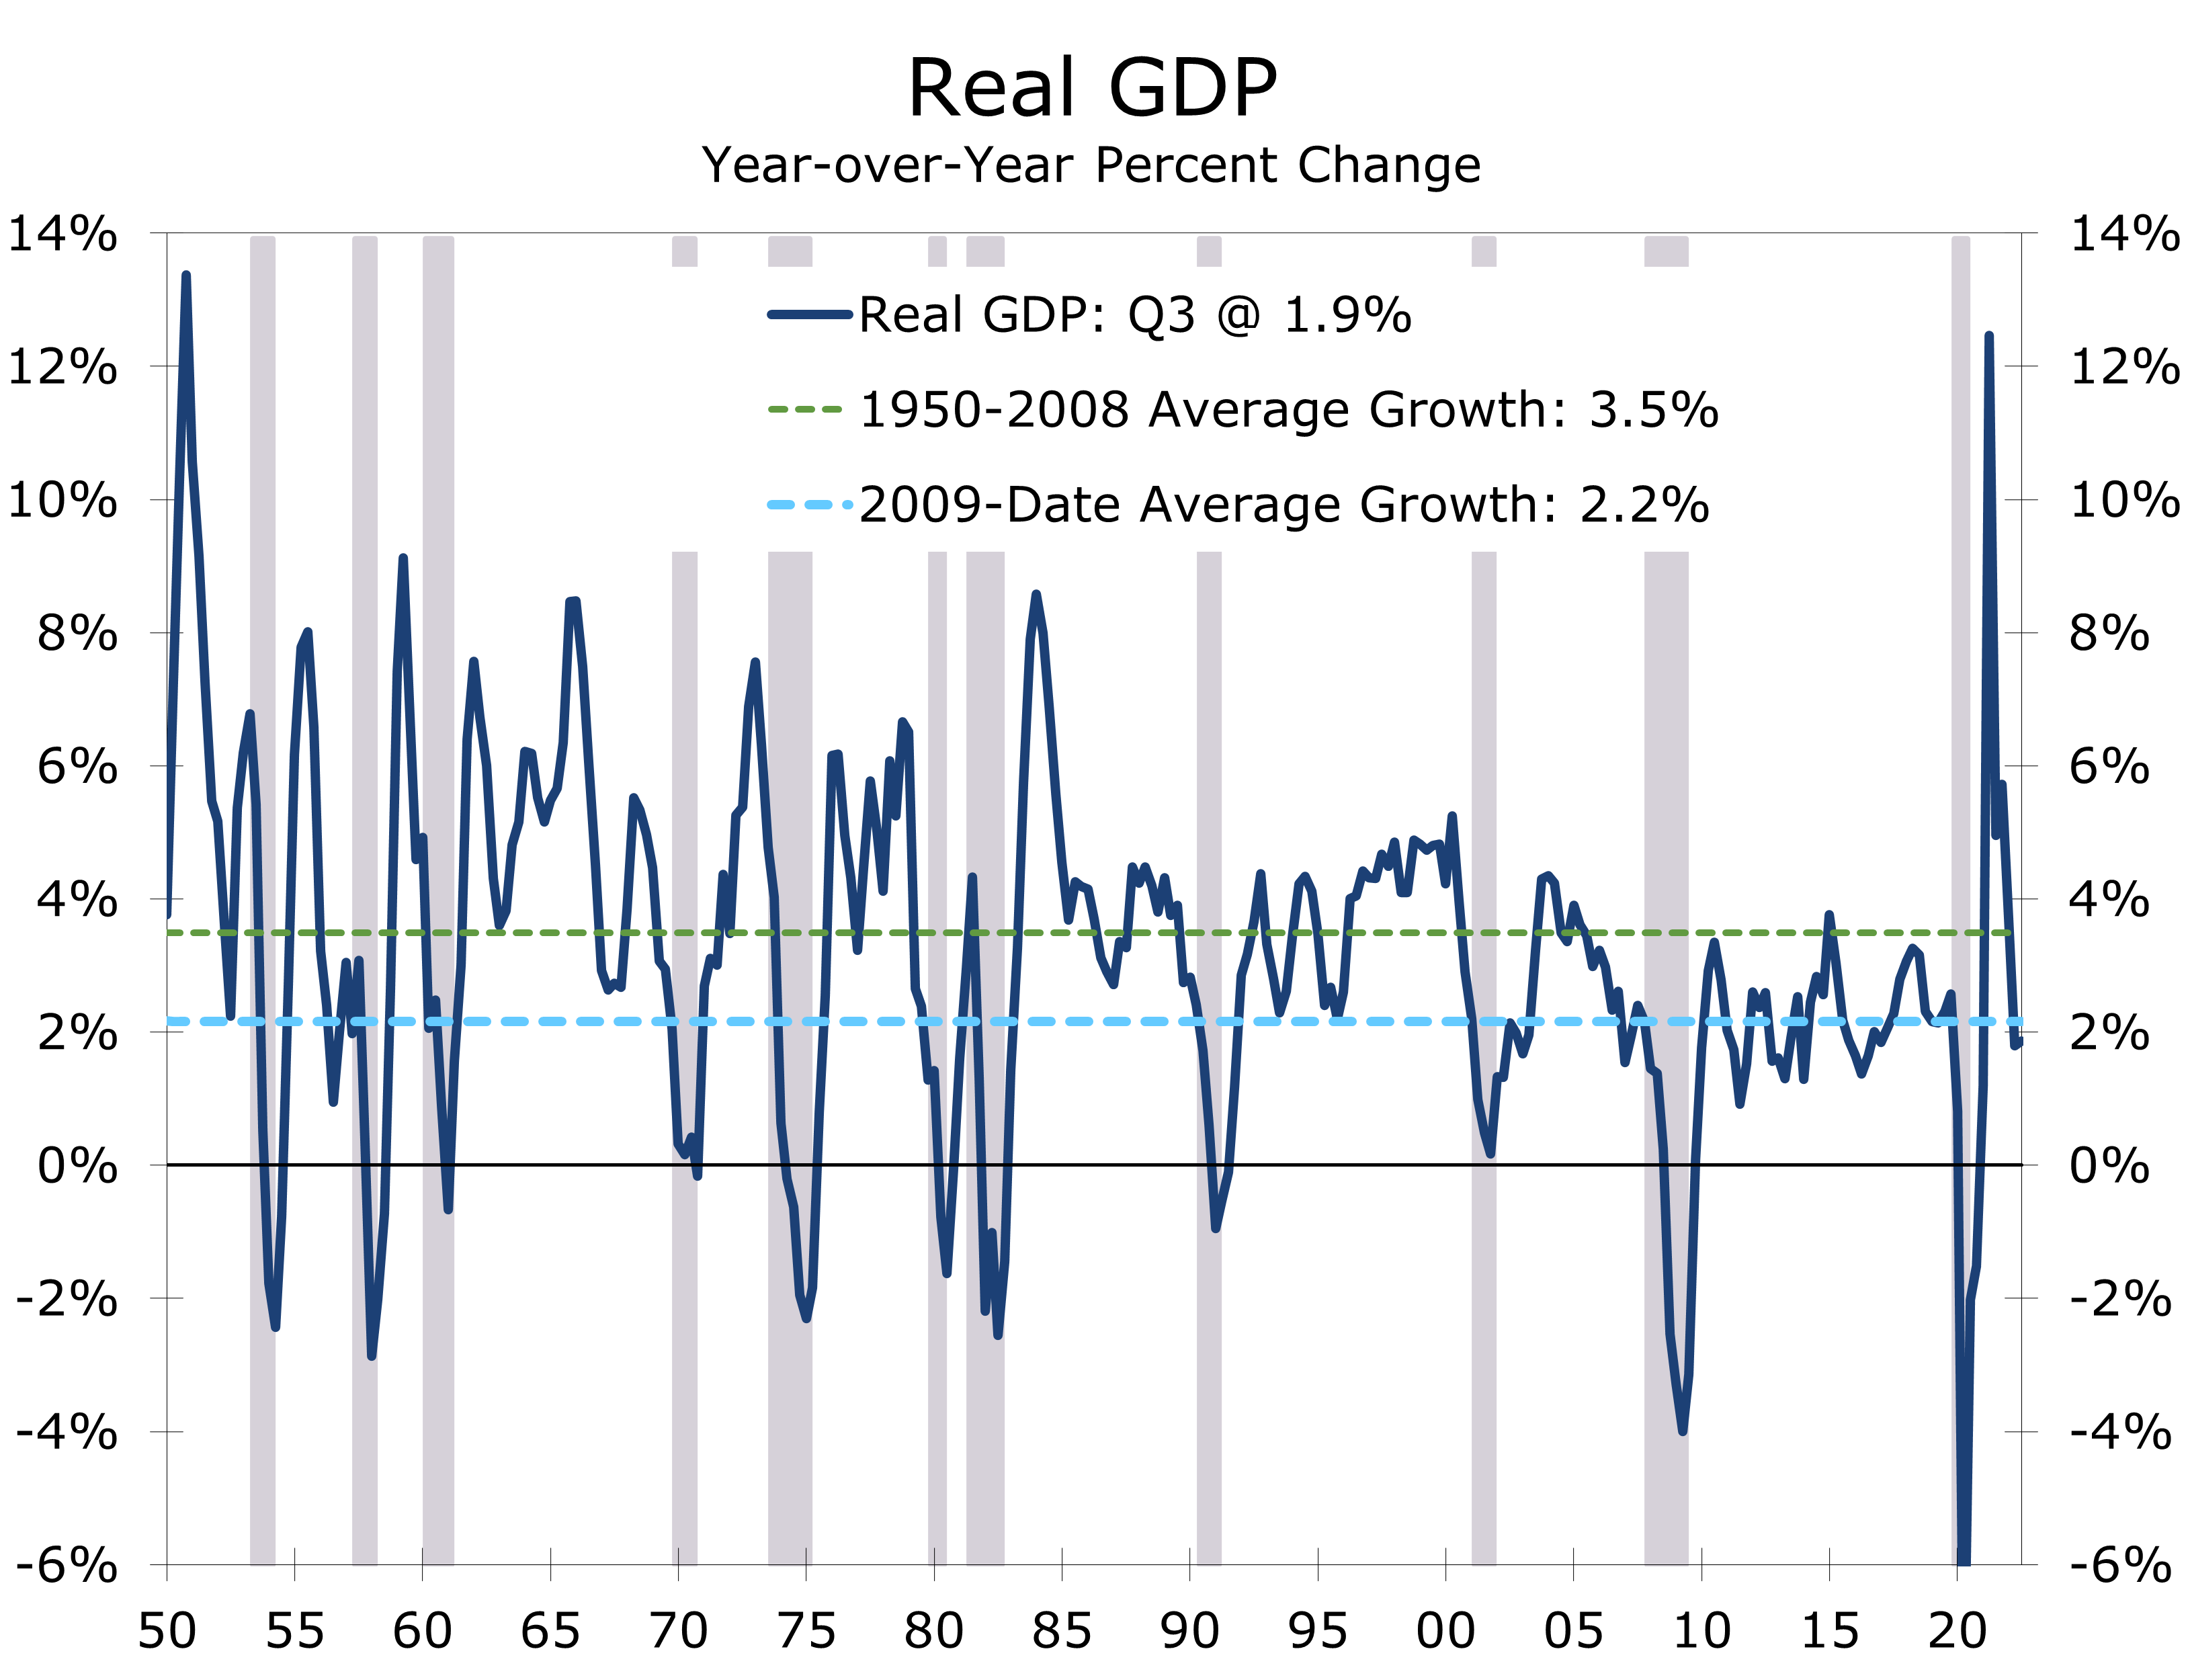
The prospect of a short and shallow recession brings back memories of the 1990-91 downturn, which lasted just 8 months and saw real GDP fall 1.4%, or two-thirds the average drop for postwar recessions. Prior to that recession, the Fed had engineered a near-perfect soft landing, having raised rates aggressively in 1989 to reverse the stimulus put in place following the 1987 stock market collapse.
The Fed’s good work was undone by Saddam Hussein’s invasion of Kuwait in early August 1990, which sent oil prices soaring and led to a spike in uncertainty that almost immediately sent the economy into a recession. As was the case then, the thinking was the recession would be short and shallow because there were no obvious imbalances. That recession did prove short, ending right after the fighting ended and with only a modest drop in real GDP.
Unfortunately, the recovery from that short and shallow recession had an unusually hard time gaining traction. Nonfarm employment did not bottom out for another couple of months after the recession “officially” ended and the unemployment rate continued to climb until June of the following year, peaking 15 months after the recession ended and just a few months before the 1992 presidential election.
The jobless recovery from the 1990 recession made a reappearance following the relatively short 2021 downturn, which was brought about by the September 11 attacks. The economy had topped out several months earlier, but the decline in economic output was not significant enough to qualify as a recession until the sharp pullback in demand that followed the September 11 attacks. That recession was once again short and shallow, lasting just 8 months. Real GDP declined just 0.4% and nonfarm employment fell 2%, or half the average postwar recession drop. The unemployment rate, however, continued to trend higher, peaking 19 months after the recession ended.
Our walk down memory lane is a reminder that all recessions bring painful consequences. While a short and shallow recession appears preferable to the alternative, the ensuing recovery has often proven excruciatingly slow. One theory as to why recoveries from short and shallow recessions tend to struggle is they do not allow enough time for imbalances built up during the preceding expansion to be unwound. This often-overlooked cleansing property of recessions is a key element for a strong recovery.
The apparent absence of imbalances is one reason so many forecasters are projecting the next recession to be short and shallow. We beg to differ. Imbalances almost always exist, as capital seeks its highest risk adjusted rate of return when credit is easy and tends to overshoot. Policy changes, exogenous shocks, demographics shifts, and technological innovations constantly keep that elusive highest rate of return on the move between asset classes, encouraging capital to shift from one sector to another.
There are several imbalances present today that may potentially make a recession more severe
There are several imbalances today that will make it more difficult to achieve a soft landing and potentially make a recession more severe. One obvious imbalance is all the resources that followed the shift in consumer preferences during the pandemic, many of which are now being unwound. The impact is most apparent in the tech sector, where many businesses expanded operations and staffed up believing shifts toward remote work, home entertainment, online shopping, and all other thing digital were permanent or at least reflected an accelerated shift.
As Covid fears subsided, consumer behavior shifted back toward their pre-pandemic norm. Rising interest rates have made the payback all that more painful because higher interest rates make investments in risky, or even promising but uncertain profitability timelines, less attractive. The Nasdaq, where shares of many of the nation’s largest publicly traded tech firms trade, declined 33.1% in 2022.
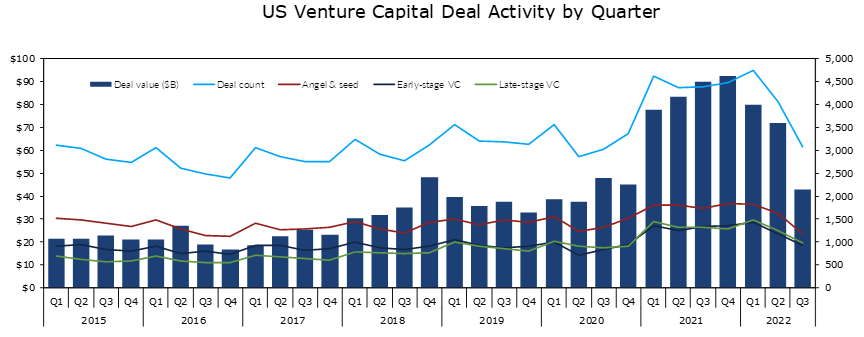
Lower share prices have made it more difficult for companies to go public. The lack of exits has sent chills through the venture capital market. The number of early-stage deals fell sharply this past year, and there were fewer Unicorns – startups reaching $1 billion valuations – than any time in the past five years. With capital dearer, businesses are curbing capital spending, consolidating operations, slowing hiring, and increasingly cutting staff.
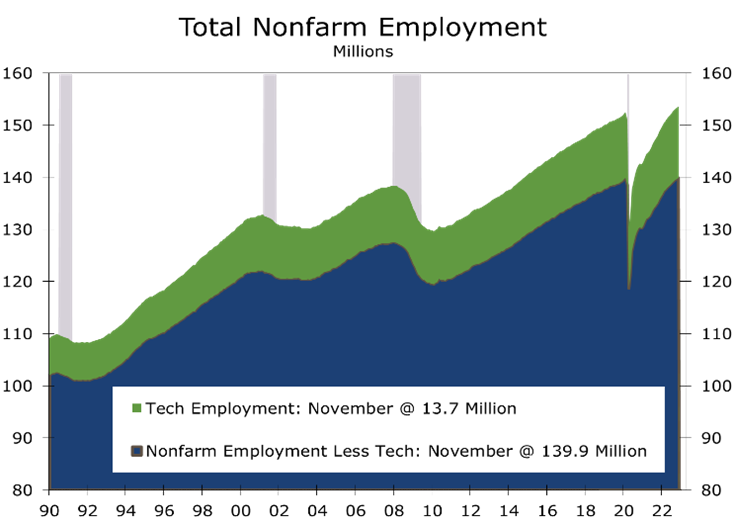
While some analysts have emphasized the tech sector accounts for only a small share of nonfarm payrolls (8.9% based on the latest BLS data), the sector punches well above its weight. Tech employment, which we define as information services and professional and technical services, rose throughout the pandemic and the sector employs 1,080,700 more workers today than it did prior to the pandemic. Without the tech job gains, nonfarm payrolls would have not eclipsed their pre-pandemic peak until December and would only be a paltry 158,300 jobs above that February 2020 level.
Even this past year, amidst a surge in hiring at restaurants, bars, hotels, health care and other services; the tech sector still accounted for an outsized share (13%) of job gains. Moreover, the tech sector has accounted for an even larger share of job gains in many tech-centric markets, such as the San Francisco Bay area, Seattle, Southern California, Denver, and Austin.
The CHIPS & Science Act and Inflation Reduction Act will spur more activity in parts of the tech sector. Most of the near-term impact, however, will be in construction and design & engineering, with projects likely to take years to reach the point where meaningful numbers of workers are hired on the operations side. In the meantime, software firms, digital streaming companies, social media and biotech firms are having to learn to live in an environment where demand is growing more slowly, capital is more expensive, and investors are much more discerning.
Most of the economy’s other imbalances derive from everything inflated by low interest rates. Housing is front and center. Demand for new and existing homes has fallen precipitously ever since the Fed pivoted away from the notion inflation was transitory and started raising interest rates aggressively. Sales of existing homes have fallen for the past 10 months and the latest data show sales down 35.4% year-to-year.
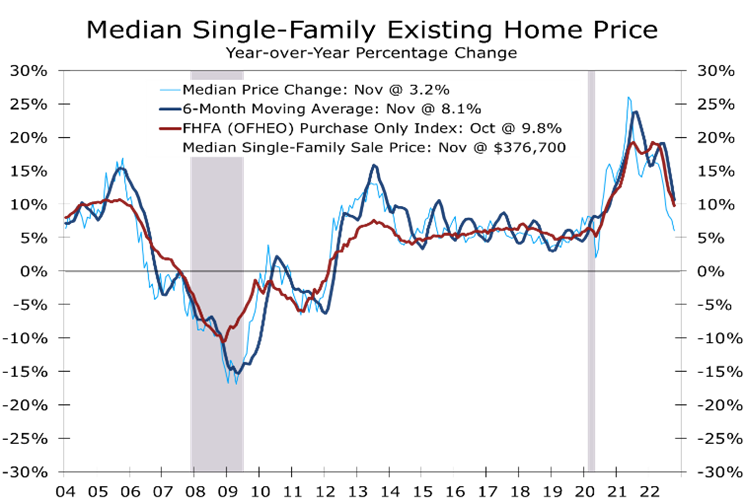
The slowdown in home sales has helped arrest the surge in home prices that began after the lockdowns ended. The median price of an existing home, as measured by the National Association of Realtors, has fallen in each of the past 5 months, on a non-seasonally adjusted basis, and is now up just 3.2% year-to-year. Year-to-year home price appreciation peaked for the cycle at 26.2% in May 2021. The median price appears to have peaked at $420,900 in June 2022 and had fallen back to $376,700 in November.
One of the more unusual aspects of this housing cycle has been the persistent lack of inventory. The recent slide in sales is helping correct this, as homes are taking longer to sell. The number of existing homes available for sale has risen off its recent lows and is currently 5.2% above its year ago level. That increase, however, was off record low levels and for-sale inventory remains well below its pre-pandemic norm.
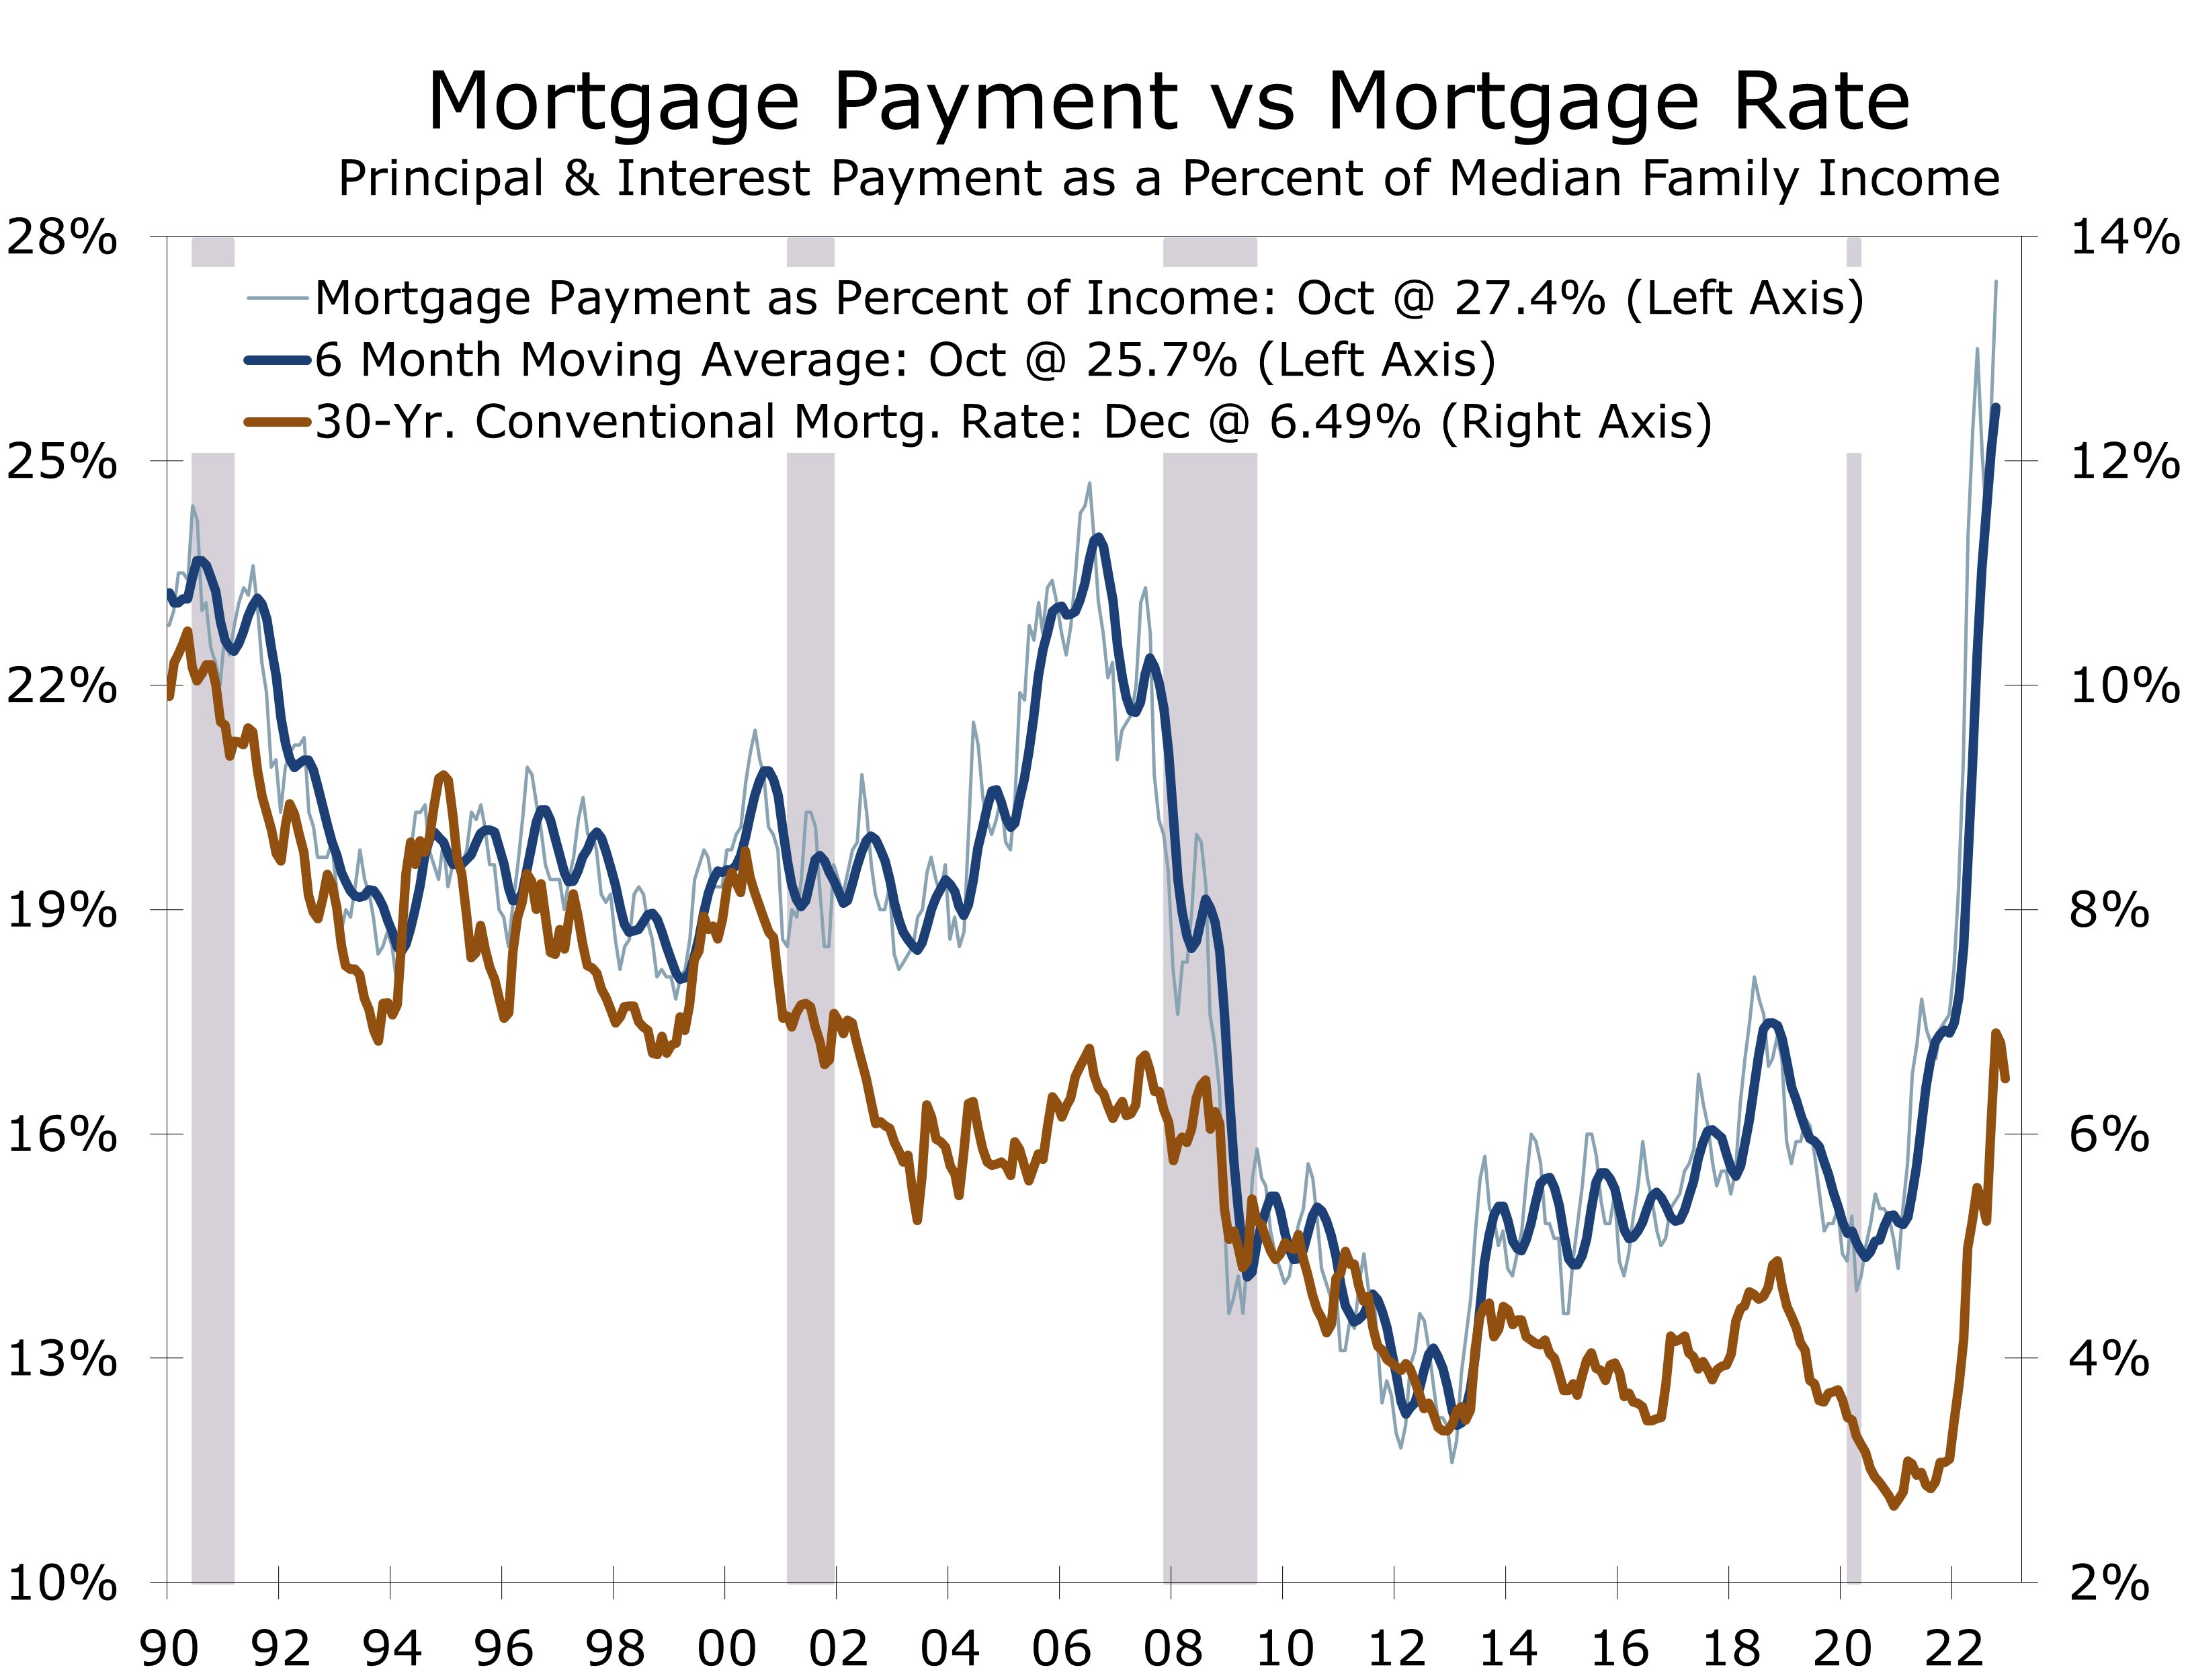
The sharp pullback in home price appreciation amidst historically low for-sale inventory of new and existing homes, suggest that there is more at play in the housing market today than merely a cyclical slowdown. Affordability has been stretched well beyond what was seen in prior cycles, with a record 27.4% of median family income needed to service principal and interest payments on the median home purchase today. While higher interest rates account for part of that surge, there appear to be numerous structural impediments on the supply side as well, which have effectively steepened the supply curve.
Investors have been extremely active in markets where inventories are the lowest and home prices have risen the fastest. The conversion of single-family homes to rentals has substantially reduced housing turnover and severely limited buyer options at lower price points. More stringent land-use policies, persistently tight labor markets and higher building materials prices have also restrained new home construction and will likely continue to do so.
The historic pandemic migration away from gateway cites to rapidly growing metro areas in the Sun Belt also likely exaggerated the swing in home prices. The share of homes in the South sold at prices between $500,000 and a $1 million has more than doubled from what was seen prior to pandemic. The surge in demand for higher-priced homes in the South, where home prices have historically been more moderate, is likely driven by the influx of equity-rich buyers from the higher-cost markets along the West Coast and in the Northeast.
The impact from the pandemic affordability migration is apparent in the widely followed home price indices. Prices have increased more rapidly in the broader Case Shiller 20-City and National Index than in the narrower 10-City index, which includes most of the Gateway cities seeing the greatest outflows. This is opposite of what happened during the housing bubble. The implication is that while home price will not likely fall as much as they did from 2009-2011, the decline will likely be broader and impact more households.
While home prices may not fall as much as they did from 2009-2011, the decline will likely be broader based and impact more households
Falling home prices are likely to constrain consumer spending, even amongst consumers that have amassed considerable home equity. The impact is apparent in the rising saving rate, which reflects a pullback in major purchases such as motor vehicles, furniture, major household appliances and home renovations. Falling home prices will also keep mortgage credit relatively tight, which will push a meaningful recovery in home sales out to 2024.
The apartment market has also dealt with enormous swings driven by the historic out-migration from densely populated Gateway cities to the Sun Belt. Demand for apartments surged in most Sun Belt markets as the economy reopened and led to a surge in housing formation. Rents sky-rocketed, as vacancy rates fell to all-time lows. Sales prices for apartment communities also surged, as investors competed for properties throughout the Sun Belt and drove cap rates to all-time lows.
Apartment demand appears to have topped out in late 2021 and early 2022. Data from Apartment List show year-to-year increases in contract rents topped out at 18% in December 2021 and vacancy rates bottomed out 2 months earlier at 4.1%. Apartment absorption appears to have peaked in the first quarter of 2022 and turned negative for the first time since 2009 in fourth quarter, according to data from Real Page.
Rents moderated throughout much of last year and fell in the last 4 months of 2022. Rents typically decline at the end of the year. This past year’s drops, however, were larger than usual. Rents ended 2022 up 3.9% from last December, while vacancy rates have risen 2.3 points to 6.4%.

The moderation in rents would appear to be good news for the Federal Reserve. Housing costs account for roughly 40% of the core CPI. The moderation in market rents is not yet apparent in the CPI, however, and Fed Chair Jerome Powell noted at the December FOMC press conference that even though rents had moderated, tenants renewing leases are doing so at much higher rents. With rents already accounting for a record share of income, higher rents are likely to fuel additional wage demands. Hence, the Fed sees nothing in the most recent moderation in market rents that would prompt it to accelerate any pivot toward a more neutral policy stance.
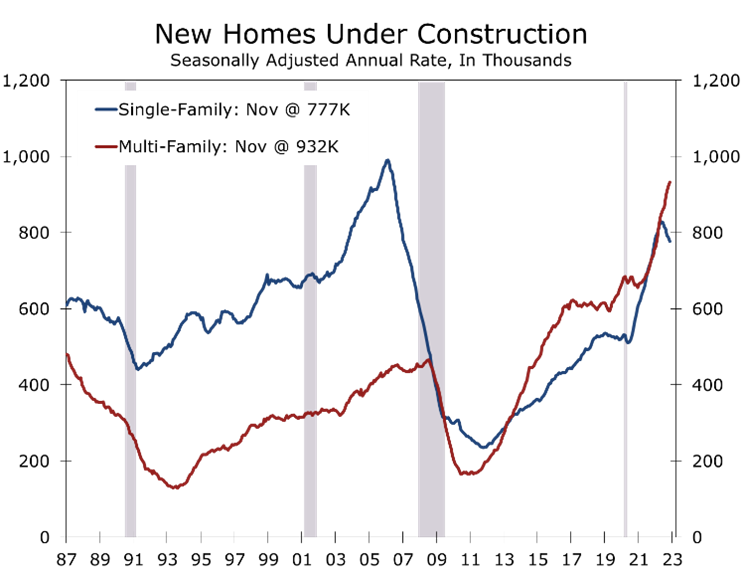
Rents are likely to moderate further. More than 900,000 multi-family homes, mostly apartments, are currently under construction, which is the most since the early 1970s. Around half a million apartments are slated to be completed in 2023, when demand will likely to be soft. We expect apartment vacancy rates to rise another 2.5 to 3 points this year. Rents should turn negative on a year-to-year basis by midyear. The deterioration in operating fundamentals will slow new development. The backlog of projects underway, however, should keep builders busy throughout much of this year.
Commercial construction is another area ripe for a larger than usual correction. Commercial property prices appear to have peaked in 2021 or early 2022 and have since weakened. Most of the attention is focused on the office sector, which has seen numerous tenants consolidate space to accommodate more flexible work arrangements. The office vacancy rate has risen 0.6 percentage points this past year to 18.7%, reaching its highest level since 1992 according to Moody’s Analytics REIS. Tech-centric metro areas like San Francisco have seen vacancy rates spike even higher, with some reports putting the effective vacancy rate at around 27%.
Other commercial property types might also face meaningful corrections. The industrial market has been the single hottest product, particularly warehouses near ports and around key inland distribution hubs. Efforts to build resiliency into supply chains may have gone overboard, however. With consumption of goods flagging, several retailers have found themselves with too much inventory. We look for demand for warehouse space to be a surprising area of weakness this year.
Retail centers also face tougher times in 2023 as consumer spending on goods slows further. The sector held up surprisingly well during the pandemic thanks to stimulus checks and remote work, which provided consumers the means and time to shop in person.
The hurdles facing residential and commercial real estate are important because in the past, recessions centered in residential and commercial real estate have tended to be deeper, last longer and be followed by slower recoveries. There are reasons to believe this time will be different. Housing is not grossly overbuilt like it was 15 years ago. Moreover, other than office space, commercial vacancy rates remain relatively low.
The biggest challenge for housing is affordability. Not only do mortgage payments account for a record share of median income, but rents also consume a record high share of income. Bringing the market back into balance will require stronger income growth, which will be tough to come by in a recession or a soft landing. The other alternative is through declines in home prices, mortgage rates and rents or some combination of income gains and price/rent declines. None of this will happen quickly.
As for commercial real estate, the correction in the office market looks like it will be a long one. There is considerable space currently under construction, which may push the vacancy rate above 20% in 2023. Conversions of office space into apartments or some other use is possible and indeed likely. The timeline on such projects, however, is extremely long and will likely require prices of existing buildings to decline further.
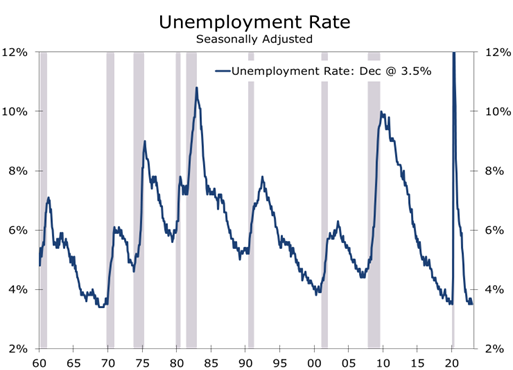
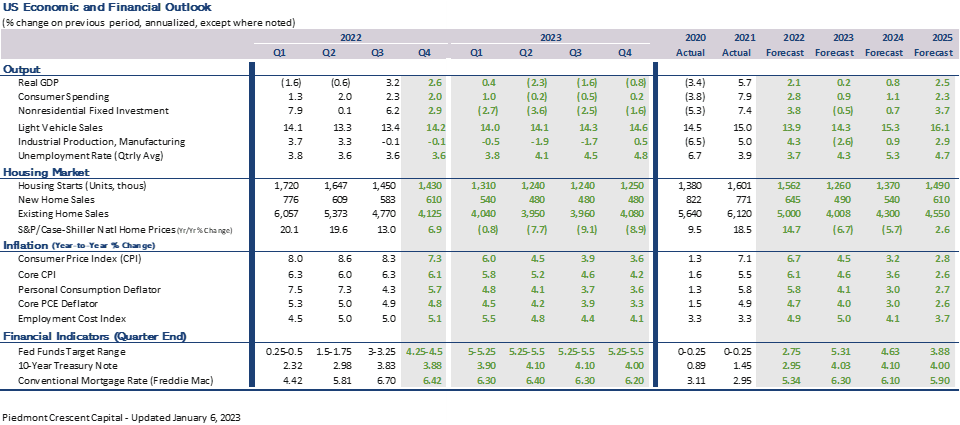
The latest data suggest a recession is a little further off. Employers added 223,000 jobs in December and the unemployment rate remain fell to 3.5%. Total hours worked in the private sector rose at a 1.1% annual rate during the fourth quarter, which means real GDP likely grew at around the 2.6% pace we are projecting for the fourth quarter. Even with the stronger yearend data, we still see a better than even chance of a downturn beginning by the middle of 2023.
Soft landings are hard to pull off and the Fed’s path is particularly narrow today because the economy’s potential growth rate is so much slower. Potential economic growth, or the sum of labor force growth and productivity growth, has typically been close to 2%. Today, potential growth is likely closer to 1.5%, with both the labor force (0.2%) and productivity (1.3%) growing much more slowly than in the past.
Soft landings are hard to pull off and even harder to sustain
Soft landings are also hard to sustain, as slower growth leaves little room for error. The Fed needs to slow real GDP growth to less than 1.5% and hold it there for a year or more to bring inflation back down to its 2% target. Such a pace would imply job growth slow to around 100,000 jobs per month and would gradually push the unemployment rate higher. Such sluggish growth also leaves the economy vulnerable to exogenous shocks, which is why soft landings are so hard to maintain beyond a few quarters.
Our forecast calls for a recession to begin by the middle of the year. While a recession is more likely than not, we see the next most likely alternative to be a continuation of the rolling recessions hitting the technology, housing and commercial real estate sectors. The critical question for 2023 will be whether this weakness spreads to other areas of the economy. One of best indicators to watch will be the ISM surveys, which report on the breadth of economic strength and weakness and have fallen into contraction territory.
We expect the Fed to continue to hike interest rates as inflation remains persistently above their target. We look for a 50 basis point hike at the February FOMC meeting, followed by a quarter-point hike in March. The yield curve will likely remain negative all year, which is consistent with an average recession followed by a below average economic recovery.
Disclaimer: This publication has been prepared for informational purposes only and is not intended as a recommendation offer or solicitation with respect to the purchase or sale of any security or other financial product nor does it constitute investment advice.