
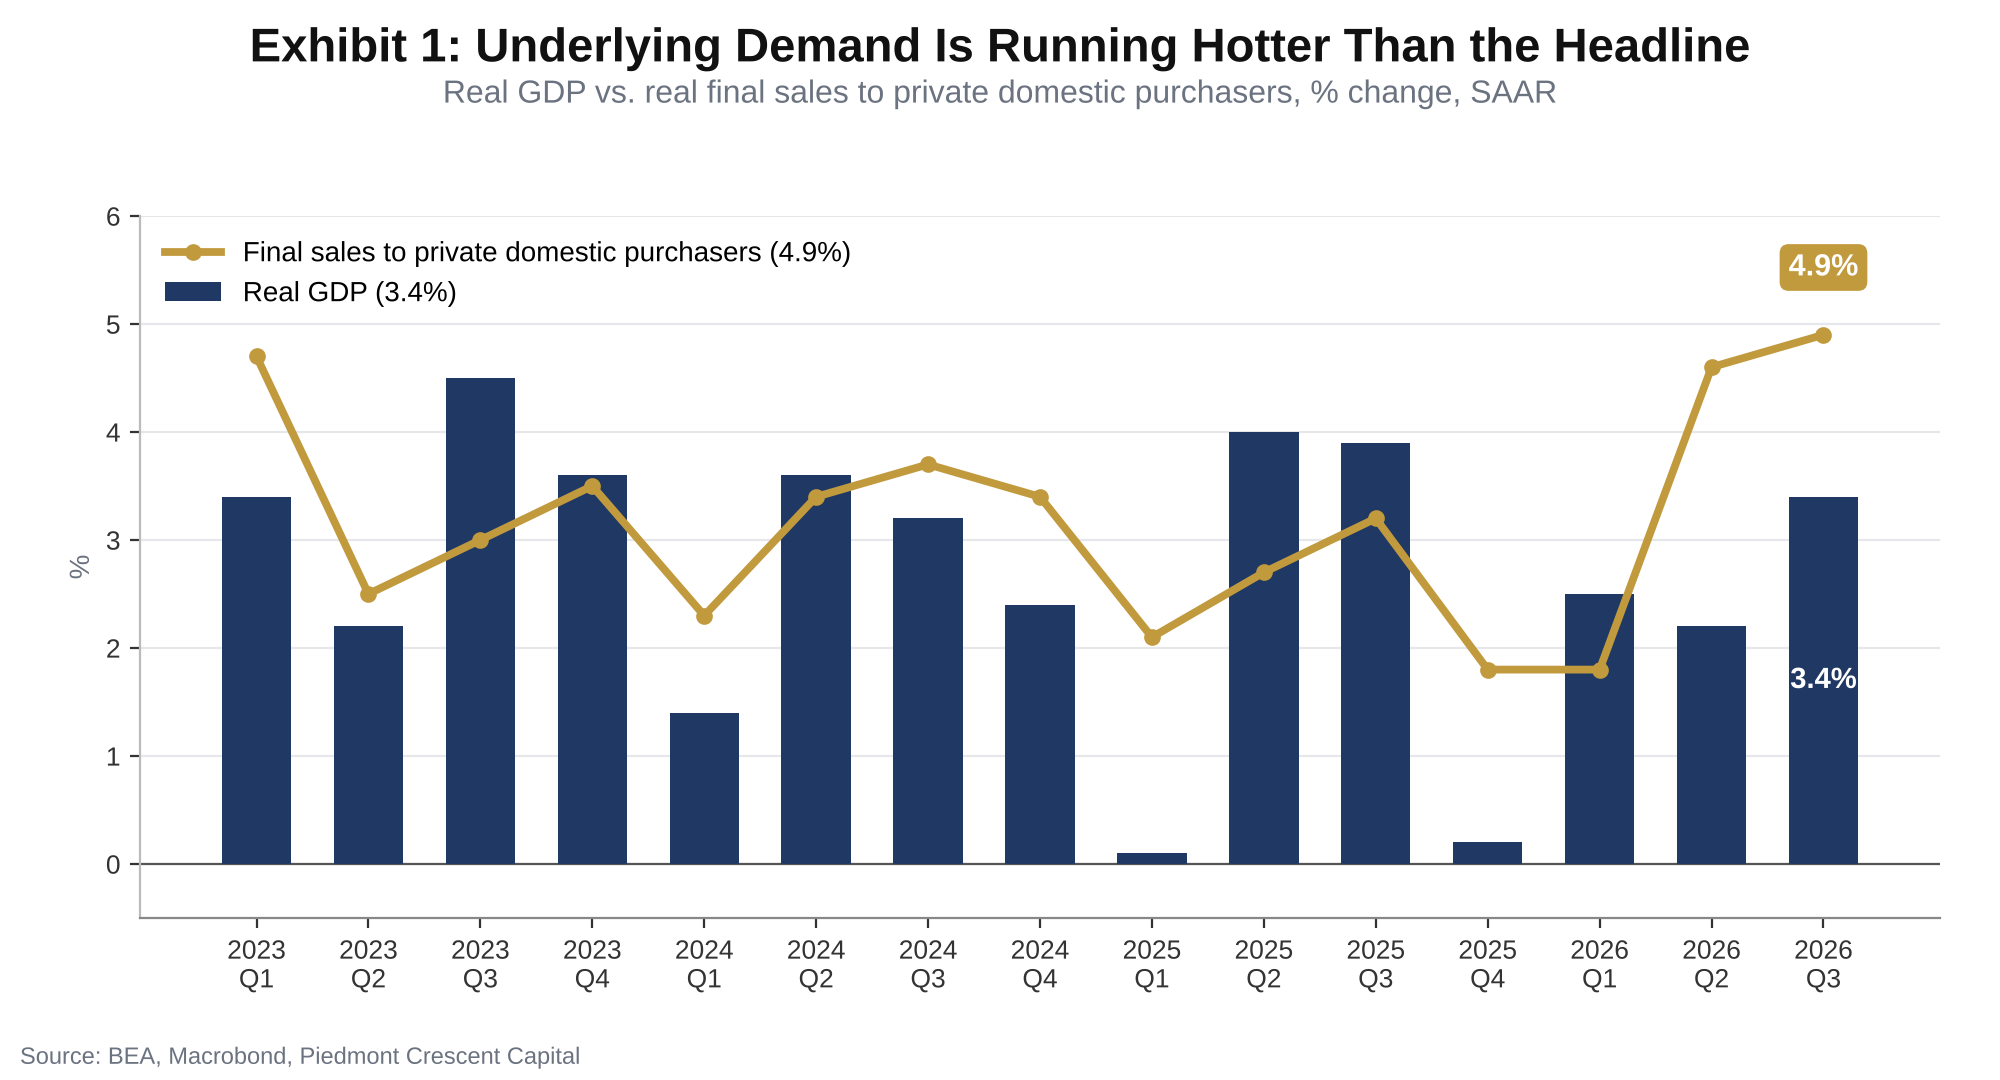
Real GDP rose at a 3.4% annual rate, up from 2.2% in the second quarter, and real final sales to private domestic purchasers rose 4.9% as quarterly price pressures cooled.
Early Signal
- Real GDP rose 3.4% at an annual rate in Q3. Growth was 2.2% in Q2, revised up from 1.5% in the advance estimate, and 2.5% in Q1. The 3.4% matches our forecast and tops the 3.0% consensus.
- Real final sales to private domestic purchasers rose 4.9%. That is up from 4.6% in Q2, 1.5 points faster than the headline, and the fastest pace in any quarter since the start of 2023. It is our preferred measure of underlying demand.
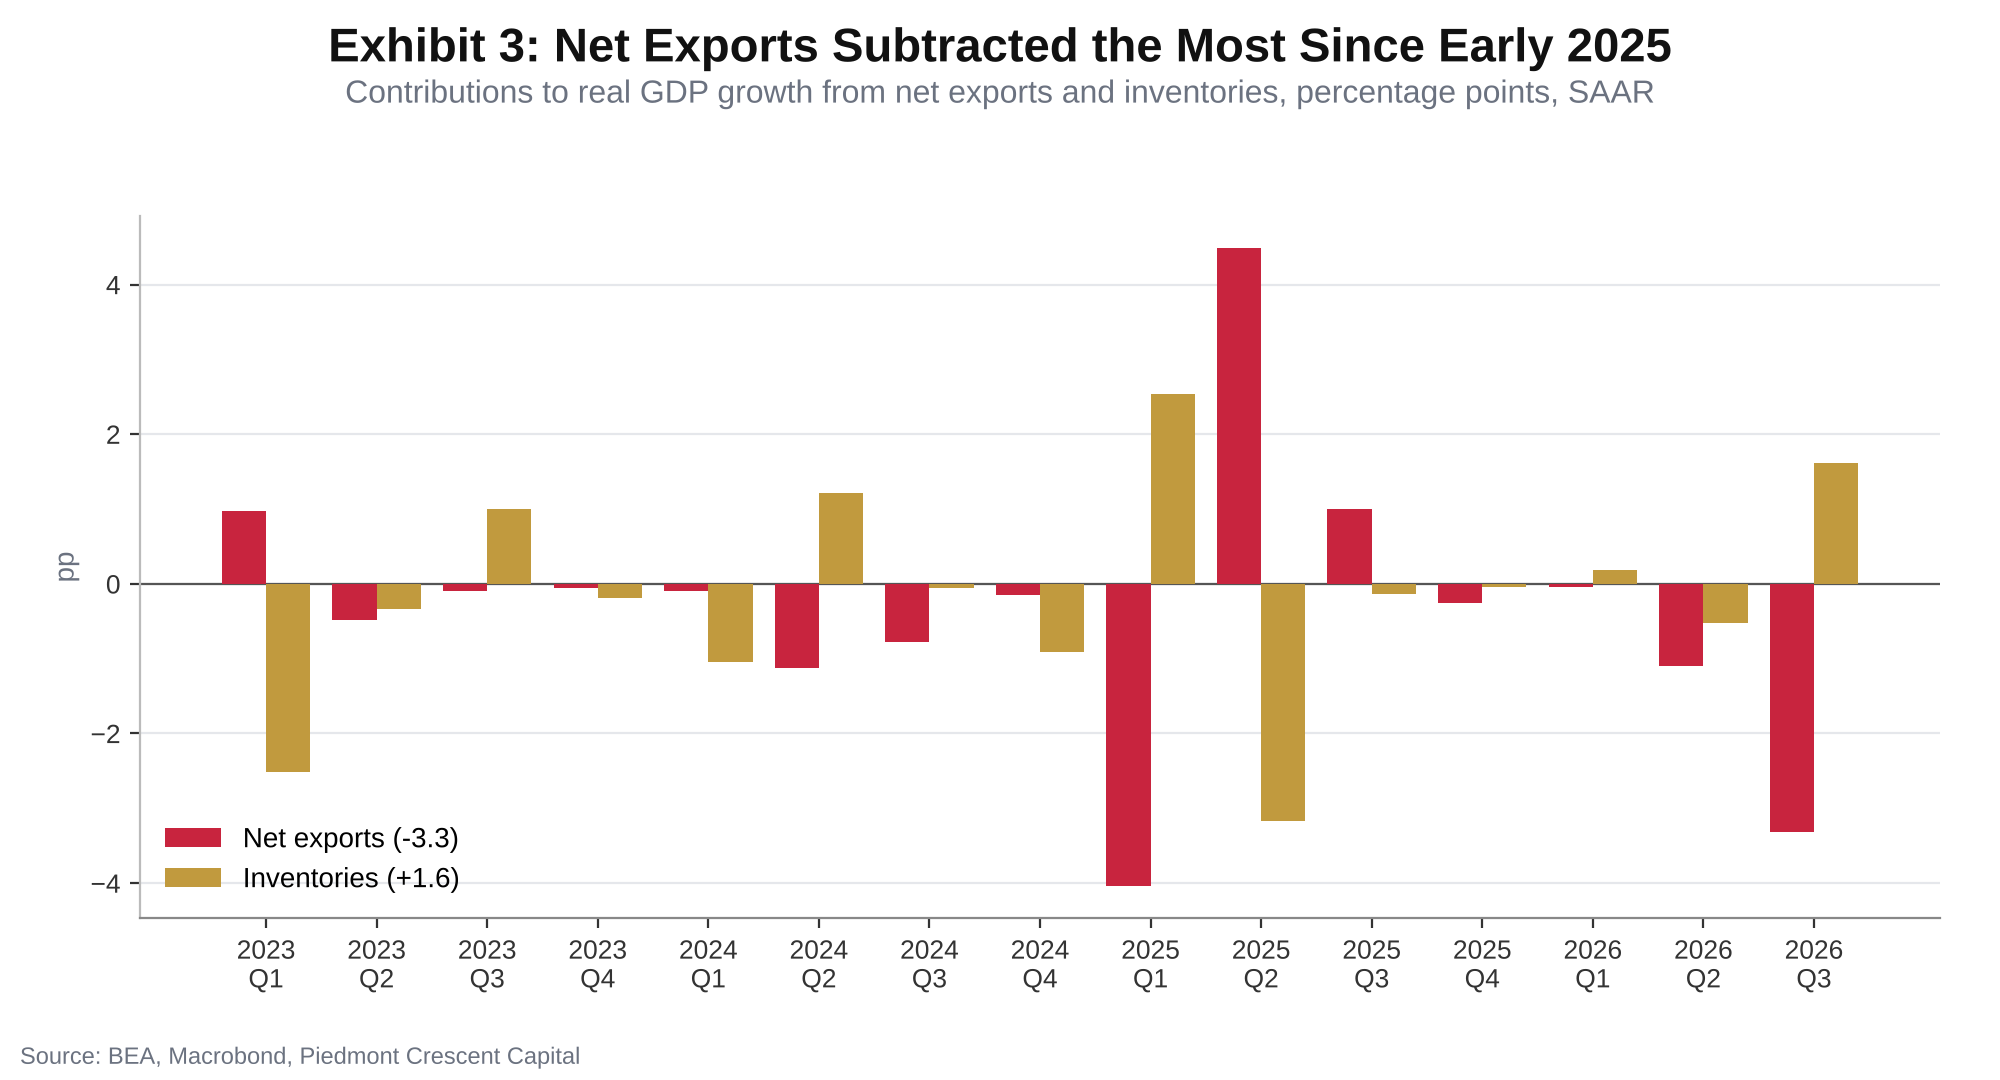
- Net exports subtracted 3.3 points, and inventories and investment more than made up for it. Inventories added 1.6 points, fixed investment added 1.7 points and government added 0.9 point.
- Consumer spending contributed 2.5 points, the same as in Q2. Services were led by health care and by food services and accommodations, and goods were led by prescription drugs.
- Quarterly inflation cooled sharply. The PCE price index rose 2.1%, down from 5.0%, and the index excluding food and energy rose 2.5%, down from 3.3%.
- September inflation did not cool. The PCE price index rose 0.5% on the month and 3.6% over the year, while personal income rose only 0.2%.
Overview
Real GDP rose at a 3.4% annual rate in the third quarter, up from 2.2% in the second quarter. Current-dollar GDP rose 5.6%. The advance estimate is a first look that rests on incomplete September data. The second estimate arrives November 25 and the third on December 23.
It is a rarity to hit a GDP forecast on the button. Economists are said to carry decimal points to show that we have a sense of humor, and most quarters the joke is on us. This quarter the decimal point was kind. We will take the bullseye and a sly smile, for what it is worth, while keeping in mind that the first estimate is not the last.
The Underlying Pace of Demand
Real final sales to private domestic purchasers rose 4.9%, 1.5 points faster than the headline, and that gap is the useful part of this report. The measure leaves out government, inventories and net exports. Government and inventories together added 2.5 points, so net exports were a drag of 3.3 points, large enough to pull the headline below the private demand figure. That is a very different quarter from one in which inventories flatter a soft private economy.
Where the Growth Came From
Business investment in equipment and an inventory rebuild led the gain. Fixed investment added 1.7 points, with information processing equipment leading, which fits the AI buildout we have described all year. Inventory building in wholesale trade and manufacturing, concentrated in nondurable goods, was the other major source, and it likely reflects the timing of tariffs and efforts to stay a step ahead of them.
Consumer spending held its pace. Spending added 2.5 points in both Q2 and Q3, led by health care, restaurants and prescription drugs. This strength reflects another growth driver we have highlighted, which is Peak 65, the rising number of people reaching the traditional retirement age.
Government added to growth, but the boost is mostly accounting. The increase reflects smaller sales of crude oil from the Strategic Petroleum Reserve than in Q2. Those sales are deducted from government consumption and the oil sold shows up elsewhere in GDP, so there is no direct effect on the headline. This is not fiscal stimulus.
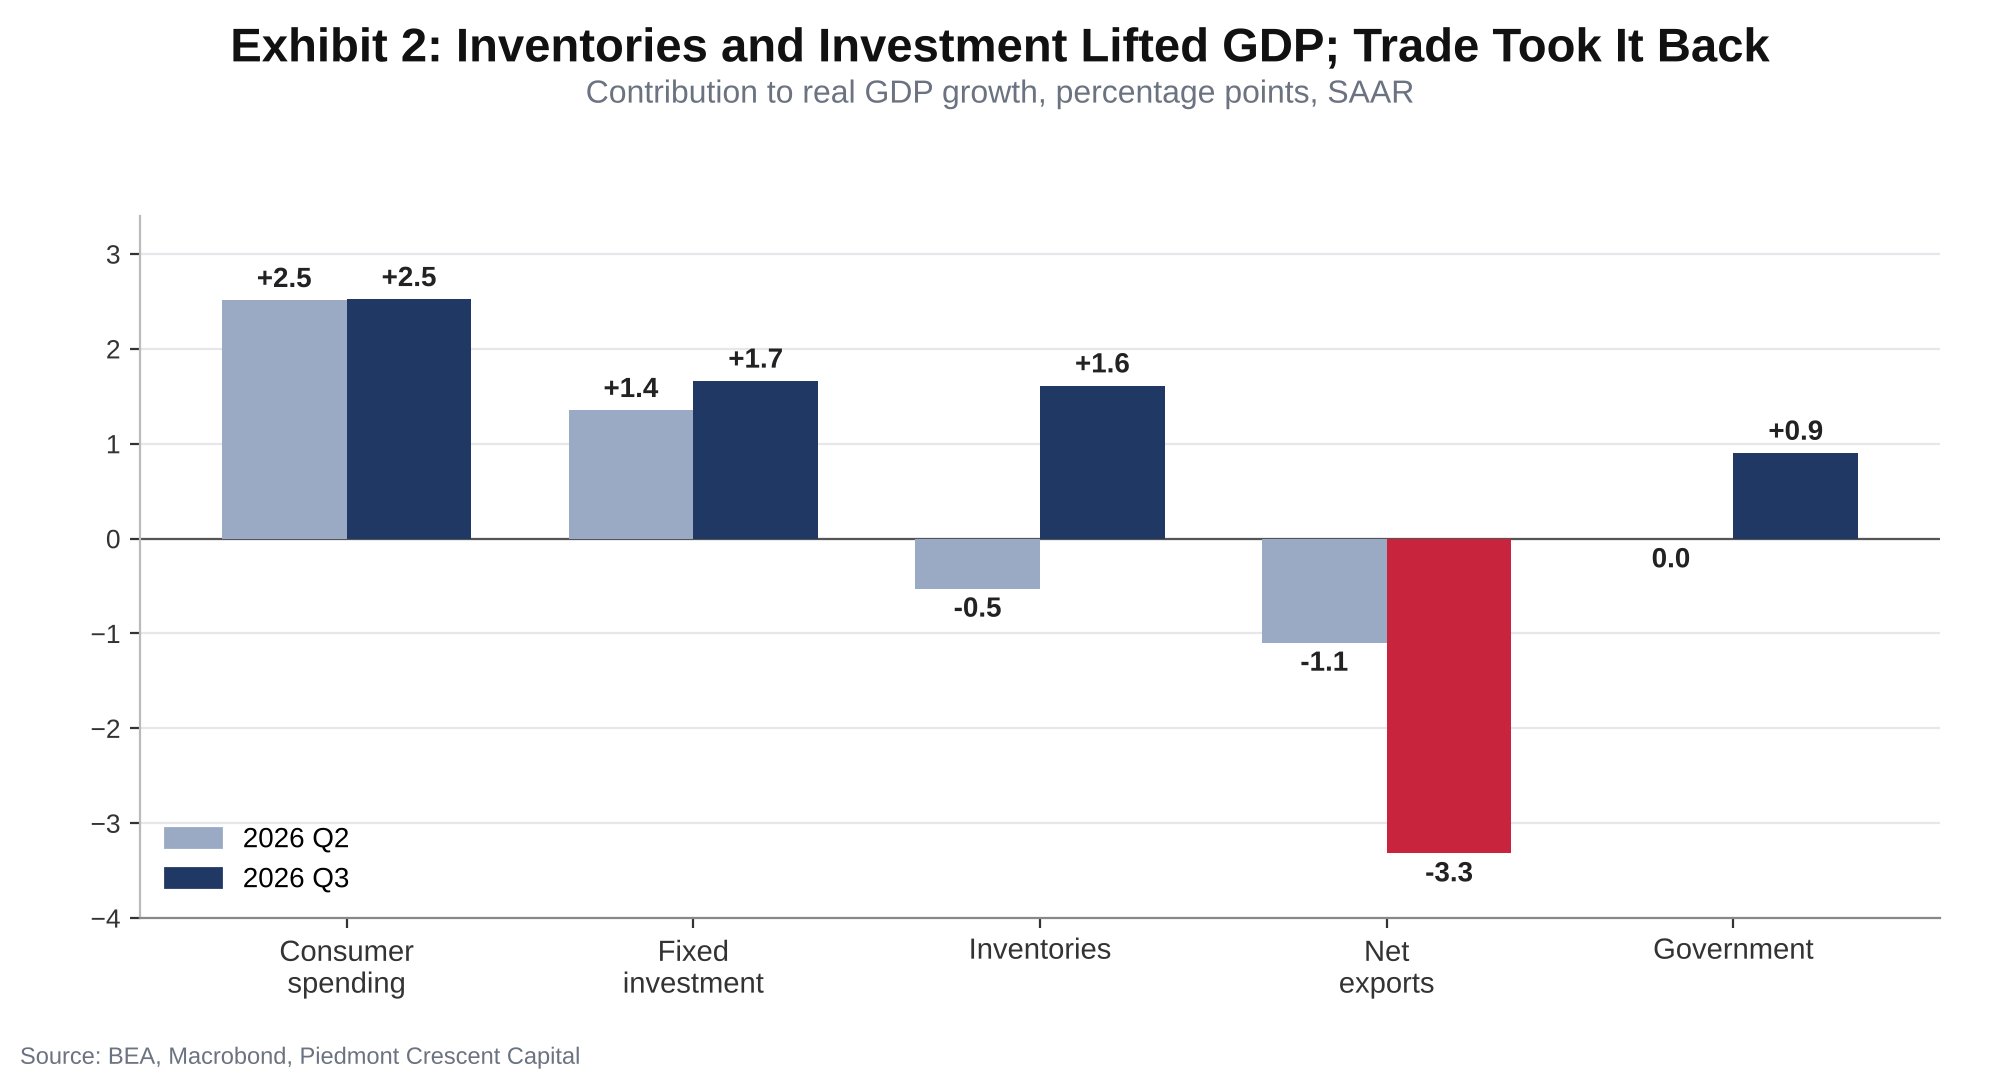
Net trade was the drag. Net exports subtracted 3.3 points, the largest drag since the first quarter of 2025. Capital goods imports are the other side of the equipment gain, so we do not read the drag as a sign of weak domestic demand.
Consumers, Income and Prices
The September personal income and outlays report, also out this morning, shows why we are cautious about reading the consumer strength as durable. Personal income rose 0.2% and spending rose far more, so the difference comes out of saving. That works for a while, but it is not a foundation for growth at a 3.4% pace.
The quarterly price data were the welcome surprise. The PCE price index rose 2.1% at an annual rate, from 5.0% in Q2, and the core index rose 2.5%, from 3.3%. The headline slowed by 2.9 points and the core by 0.8 point, so most of the cooling came from food and energy. A 2.5% core reading is a step in the right direction, but it is not yet a trend.
The Midterms and Real Income
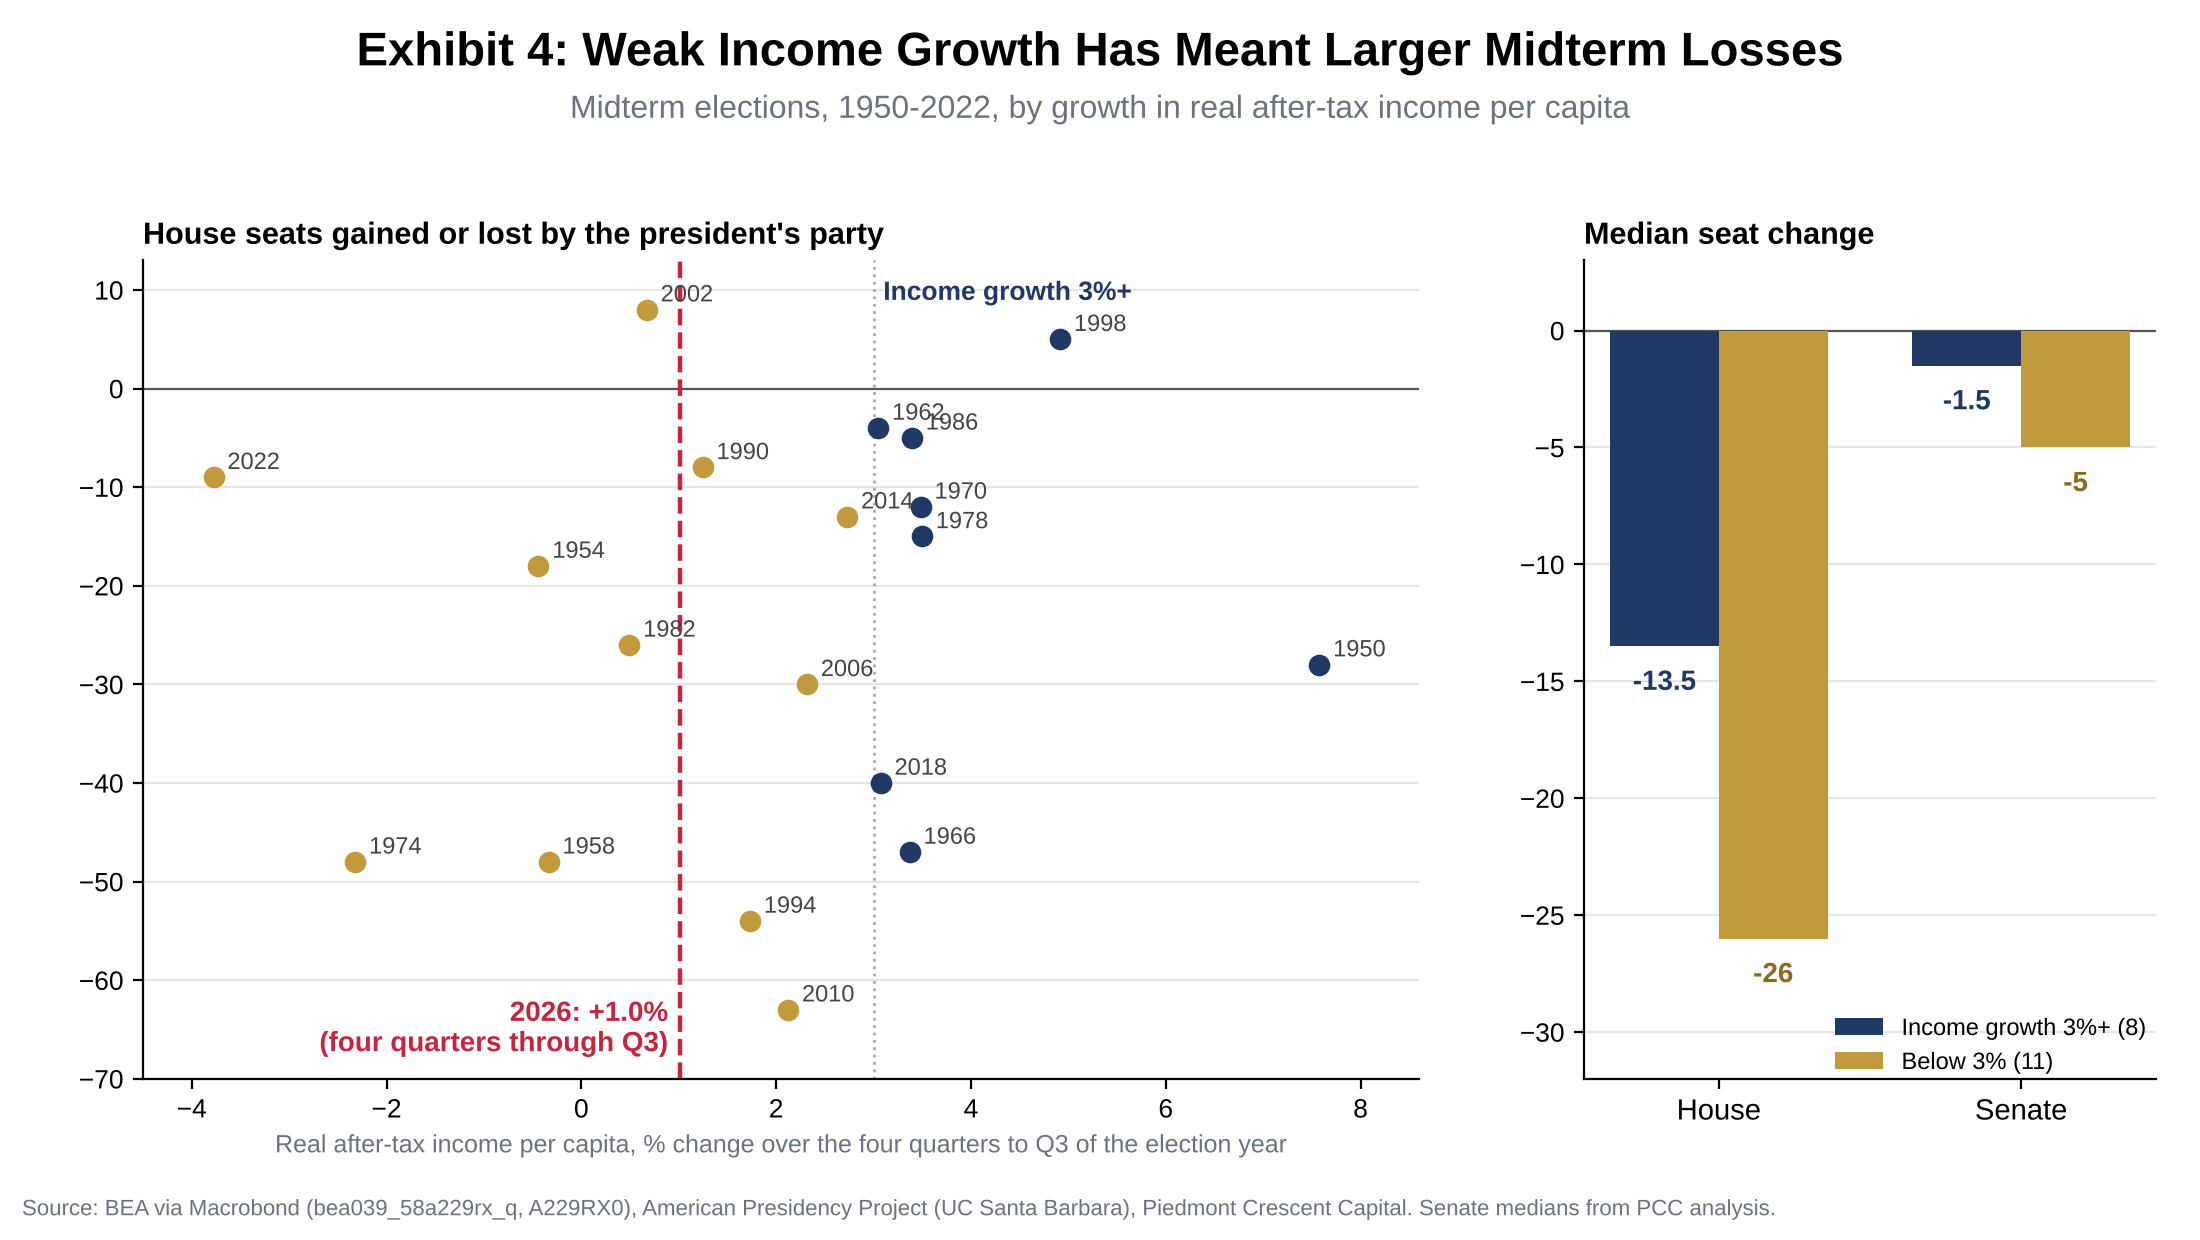
Real after-tax income per person rose 1.0% over the four quarters ending in the third quarter, a pace that history says is too slow for the party in the White House. Since 1950, the president’s party has lost a median of 26 House seats in the 11 midterms when real per capita income grew less than 3% in the year leading up to the election, compared with 13.5 seats in the 8 midterms when it grew 3% or more. At 1.0%, 2026 is the seventh weakest of the 20 readings since 1950. Prediction markets already lean toward a change in control. While the numbers certainly look dismal, we believe the prediction markets are overexuberant, and their users skew younger than this year’s electorate. We expect a closer outcome because of redistricting and poor candidate selection, and we look for Republicans to narrowly retain the Senate.
The Fed and Rates
A 4.9% gain in private final demand will keep the Fed in a tightening mindset, even with cooler quarterly inflation. The Fed raised rates on September 16, and we expect a second quarter-point increase at the December 9 FOMC meeting and at least one more in 2027. The 30-year mortgage rate was 7.32% in the week ended October 22, which weighs on residential investment. Residential investment fell at a 3.3% annual rate in Q3.
Our Call
The third quarter confirms the capital-led expansion and leaves our forecasts in place. We carry real GDP growth of 2.3% in 2026 and 2.6% in 2027, and we hold our forecast for real consumer spending growth of 2.5% in 2026 and 2.0% in 2027. We expect growth to moderate in the fourth quarter as the inventory rebuild and the swing in government accounting fade, while real final sales to private domestic purchasers hold close to trend. We leave the Fed call unchanged: a second quarter-point increase on December 9 to 4.00%-4.25% and at least one more in 2027.
We are less certain than the markets on the midterms. Real per capita income growth of 1.0% points to sizable losses for the party in the White House, but we believe the prediction markets are overexuberant and skew toward younger participants. We expect a closer election because of redistricting and poor candidate selection, and we look for Republicans to narrowly retain the Senate.
We will watch the composition. If the second estimate shows consumer spending weaker than the services strength suggests, or revises inventories sharply lower, we will take our growth forecast lower. If real final sales to private domestic purchasers stay near 4% and the labor market differential in the Conference Board survey stays above +5%, we will keep the forecast where it is.
Bottom Line
Third-quarter growth of 3.4% matched our forecast, and the mix was better than the headline suggests. Private final demand grew 4.9%, the capital cycle kept fueling growth, and quarterly inflation cooled. The risks are the usual ones: inventories that give back, a consumer living on thin income growth, and energy prices that refuse to retreat. The expansion is intact, and the questions are about the pace of growth and inflation, not direction.
What We Are Watching
- The second estimate on November 25: revisions to inventories and consumer spending will show how much of the 3.4% holds.
- Consumer spending against income: personal income rose 0.2% in September while spending rose far more, and a falling saving rate cannot carry spending for long.
- The November 3 midterms and the November 10 CPI: the October CPI arrives a week after the election and will show whether the cooler quarterly PCE readings carry into the fourth quarter.
- The December 9 FOMC meeting: we expect a second quarter-point increase, and the November 24 consumer confidence report will show how households are taking the Fed.
Sources: U.S. Bureau of Economic Analysis, Gross Domestic Product (Advance Estimate), Third Quarter 2026, October 29, 2026, and Personal Income and Outlays, September 2026; Macrobond (BEA National Accounts series); Federal Reserve Bank of Atlanta, GDPNow; The Conference Board, Consumer Confidence Survey, October 2026; U.S. Energy Information Administration, weekly retail gasoline and diesel prices; Freddie Mac, Primary Mortgage Market Survey, week ended October 22; American Presidency Project, University of California, Santa Barbara; Kalshi and Polymarket, average as of October 23, 2026; Piedmont Crescent Capital, Consumer Confidence Report, October 27, 2026, and forecast vintage of October 16, 2026.
© 2026 Piedmont Crescent Capital, LLC. For informational purposes only. Not investment advice.