
A Piedmont Crescent Capital Special Report
More Measured Guidance, Not No Guidance
Chairman Warsh wants monetary policy off the emergency footing it has held since 2008. We expect a Fed that says less, owns less and sets a more normal policy rate. It will still look little like the Fed of 2006, but will be striving for a more normal operating process.
Last week’s reset of October rate expectations showed what Chairman Warsh is trying to do and how far the Committee can take it. Warsh has said he wants investors to watch the economy and not the Fed. At his July 29 press conference he put it as “market participants are learning to play the ball, not the referee.” After the September 16 increase to 3.75%-4.00%, the market-implied odds of another in October climbed to about 70%. Then New York Fed President John Williams said a further increase “late this year” might be appropriate but that there was “no need for urgency,” Vice Chair Philip Jefferson struck a similar tone, and the odds fell to about 25% before the September jobs report pushed them lower still. A week earlier Williams had told an audience in London that the era of forward guidance was over.
The episode marks the edge of the experiment, and the edge is a useful guide to the destination. Eric Rosengren, who ran the Boston Fed until 2021, told the Journal’s Nick Timiraos that “you don’t have to promise a path of rates for people to find an implied path of rates.” Loretta Mester, who led the Cleveland Fed for a decade, observed that “nature abhors a vacuum” and that only the chair can speak for the Committee. EY-Parthenon’s Gregory Daco has described the same pattern from the market side, with Williams and Governor Christopher Waller filling a communication void and investors reading individual data points as policy tests. Each of those officials described a reaction function, a statement of what he or she would do if nothing else changes, and something else always changes. Investors treated the conditional as a plan.
Warsh’s own words describe a smaller role for forward guidance and stop short of abolishing it. At Jackson Hole on August 28 he said the practice “was adopted by my colleagues and me during the Global Financial Crisis,” that it was “essential at the time” and that it “has overstayed its welcome.” He then said, “In normal times, the role of forward guidance should be limited and circumscribed.” His objection, as he told senators at his April 21 confirmation hearing, is that the Fed tells the world its forecasts and then holds “on to those forecasts longer than they should.” The problem is commitment, and an explanation of how the Committee reads the economy does not create one. Warsh appears to agree, having introduced his Jackson Hole remarks as an outline or a trail map and added, “just don’t call it forward guidance.” Reuters called the result a “smidgen of guidance.” We prefer measured, or disciplined, forward guidance, which means less of it but not none.
The Fed used to say much less, and that was probably too little. I remember when the Fed kept to itself. Until February 4, 1994, the Committee issued no statement after its meetings, and the market had to work out what it had done by studying the Desk’s open market operations and, after 1979, the weekly money supply numbers. In 1988 the funds rate target changed 13 times, and only 3 of the changes came at or around a scheduled meeting, while 4 were relayed to the Committee on impromptu calls and 6 were tied to no recorded FOMC communication. The policy directive was published with a lag, about 90 days at first and later 45 days, and the lag survived a Freedom of Information Act suit filed in 1975. Observers weighed those scraps, along with the economy’s recent performance, against the projections the Chair laid out in the semi-annual Humphrey-Hawkins testimony. The Committee tended to move on the back of key reports, mostly the employment report and occasionally the purchasing managers’ survey when it held a major surprise. On January 3, 2001, a day after that survey fell to 43.7, its lowest since April 1991, the Committee cut the funds rate 50 basis points to 6.00% on an unscheduled conference call, nearly four weeks before its January 30-31 meeting. William Greider’s 1987 account of the Volcker era, Secrets of the Temple, described a Fed run like a temple whose priests held the secrets. Allan Meltzer, whose two-volume History of the Federal Reserve drew on the Committee’s own records, argued that discretionary policy had failed in 1929-33 and 1965-80 and called for more rule-like behavior, in part because a Fed that can tell Congress whatever it wishes is hard to hold to account. Silence matched a time before 24-hour news channels, dedicated financial channels and the internet. Even then, economists scrutinized the Fed’s statements and testimony for how it would react if growth or inflation ran above or below its projections. That is a reaction function, and it is the kind of guidance we think the Committee should keep.
The pre-crisis Fed was not silent, which is the case for calling this a normalization. The Committee has announced its funds-rate decision after every meeting since 1994, and in the years before the crisis it described its leanings in plain language. In August 2003 it said policy accommodation could be maintained for “a considerable period,” in January 2004 that it could be “patient” and in May 2004 that accommodation would be removed at a pace “likely to be measured.” Those phrases carried no date, no threshold and no projected path. What followed the crisis was different in kind. The Committee tied the funds rate to a calendar in August 2011 (“at least through mid-2013”) and to a 6.5% unemployment threshold in December 2012, began publishing the dot plot in January 2012, held a press conference after every meeting from 2019 and in 2020 promised to hold the rate at zero until inflation reached 2% and was on track to moderately exceed it. Returning to the pre-crisis template means keeping the first kind of language and retiring the second.
Forward guidance and large asset purchases were emergency tools because the policy rate had no room left to work with. When the funds rate sits at zero, a central bank that wants to ease further can change what investors expect for the rate in the future, which is guidance, or buy long-term securities, which is quantitative easing. Waller drew the same line on September 3, describing forward guidance as a tool for the effective lower bound and agreeing with Warsh that it is not appropriate now. The effective funds rate averaged less than 0.25% in 36 quarters between the start of 2009 and early 2022, in two separate episodes. It is 3.88% today, and each tool built to substitute for the rate should recede as the rate returns.
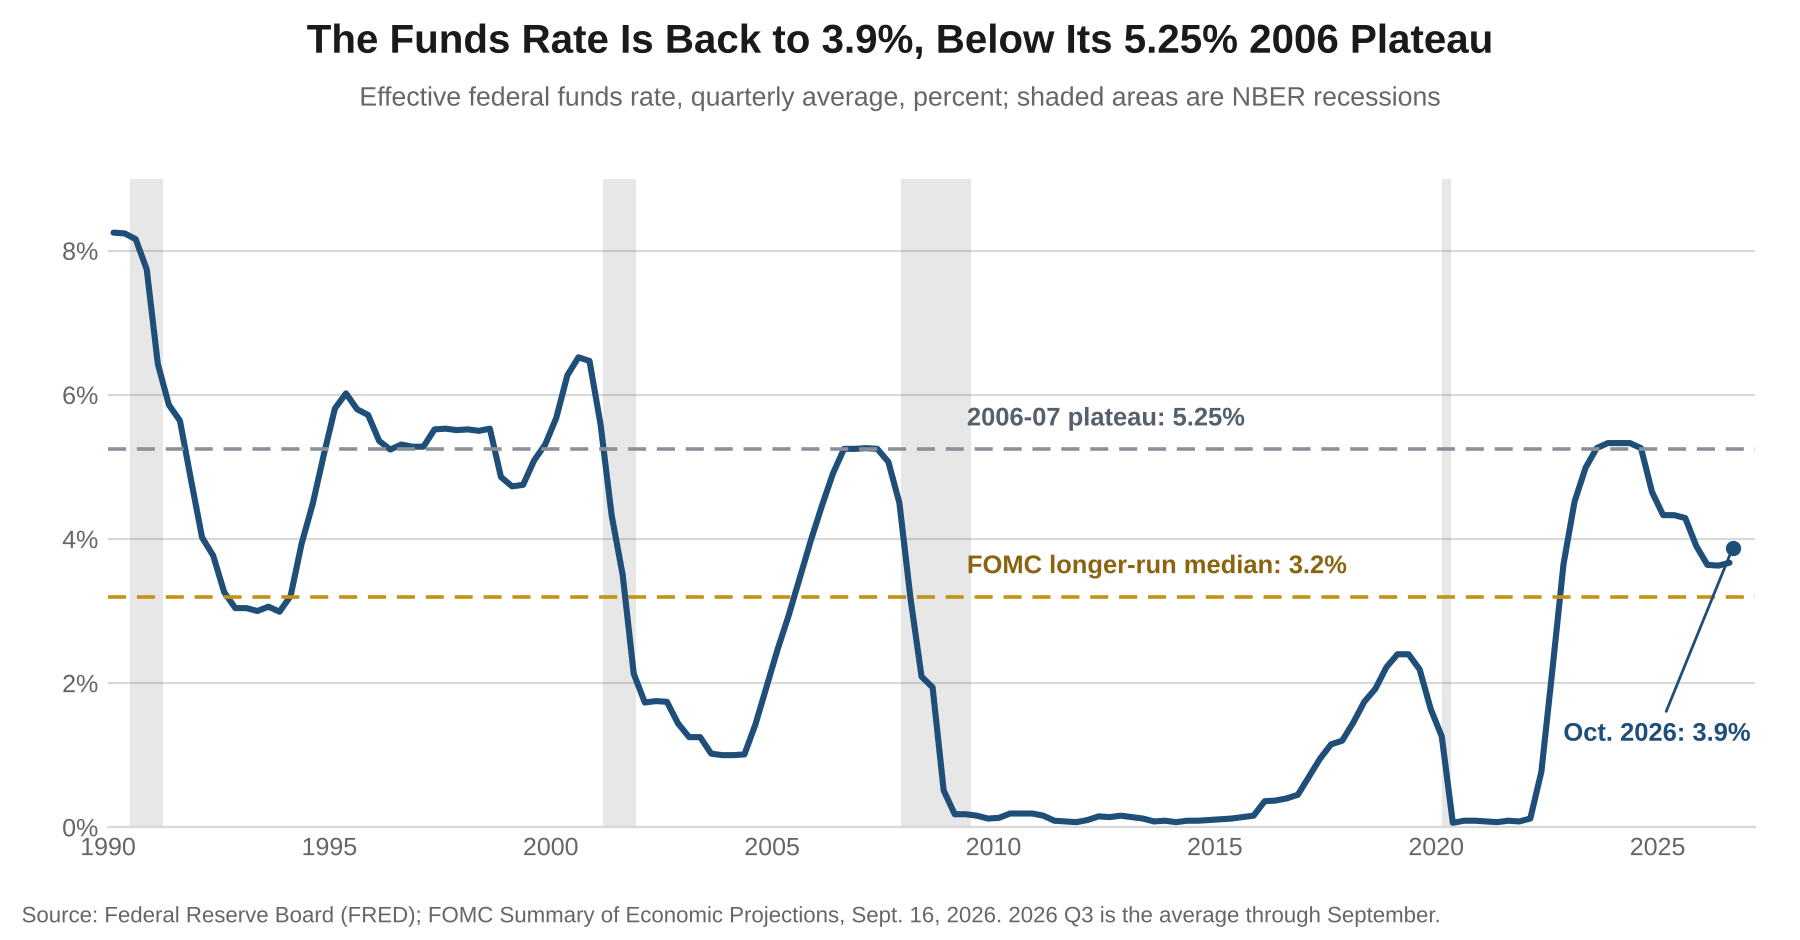
The list of emergency measures is longer than the three that get the headlines. The Committee cut the funds rate to a range of zero to 0.25% on December 16, 2008, and then bought assets in four waves, starting with up to $600 billion announced in November 2008 and enlarged by $1.05 trillion in March 2009, followed by $600 billion of Treasury securities in November 2010, $40 billion a month of mortgage-backed securities beginning in September 2012 with $45 billion of Treasury securities added that December, and open-ended purchases in March 2020. Operation Twist, which sold short-dated Treasury securities to buy long-dated ones, began in September 2011 at $400 billion and was extended by $267 billion in June 2012. Alongside came interest on reserves, emergency lending facilities, swap lines with foreign central banks, the dot plot, average inflation targeting and, as late as March 2023, the Bank Term Funding Program. Several of those are retired already, among them the unemployment threshold, Twist and the term funding program. Interest on reserves, the dot plot and a very large balance sheet remain.
The research on what these programs accomplished supports measured guidance. Much of the effect arrived on the day of the announcement. Gagnon, Raskin, Remache and Sack of the New York Fed found that longer-term rates fell by as much as 150 basis points around eight key announcements between November 2008 and November 2009, including 91 basis points on the 10-year Treasury yield. Krishnamurthy and Vissing-Jorgensen concluded that signaling, the market’s reading of purchases as a promise to keep the funds rate low for longer, played the primary role in the second round of purchases, and they asked whether guidance alone could have done the job. Eric Swanson, then at the San Francisco Fed, found that six announcements in the original 1961 Operation Twist moved long-term Treasury yields by about 15 basis points. The researchers disagree on the mechanism, since Gagnon and his coauthors attribute most of the decline to a lower term premium and not to lower expected short rates, and Greenlaw, Hamilton, Harris and West argued in 2018 that the effects of Fed announcements tended not to persist. Event studies also have a limitation, because purchases were often announced alongside bad economic news. Markets look forward, and they priced in what the Committee said it would do before it did it. Words carry real power, which is the reason guidance should be measured, and a balance sheet reduction that is announced and gradual should move yields by little. Jonathan Wright estimated in a 2022 Brookings paper that running off Treasury holdings would raise the 10-year term premium by only about 10 basis points.
The balance sheet is the hardest of the three to normalize, and we do not expect it to return to its pre-crisis size. Total assets were $6.74 trillion at the end of September against $0.87 trillion in the first quarter of 2007 and a peak of $8.94 trillion in the first quarter of 2022. Runoff ended on December 1, 2025, and purchases of Treasury bills to manage reserves lifted assets about $100 billion before the Desk paused them, and the September minutes released today say the pace of any resumption is “not on a preset course” and will be set to keep reserves ample. Jon Faust of Johns Hopkins writes that most of the growth since 2008 reflects the 2019 shift to an ample-reserves system, which most economists consider superior to the scarce-reserves system it replaced. Regulation has also raised banks’ demand for reserves, which now stand at about $3 trillion, roughly 9% of GDP against less than 1% before the crisis (First Trust; MetLife Investment Management). Stanford’s Darrell Duffie argues that shrinking the balance sheet without first reducing demand for reserves will not work, and he lists regulatory changes, payment-system redesign and tiered interest on reserves as ways to reduce it.
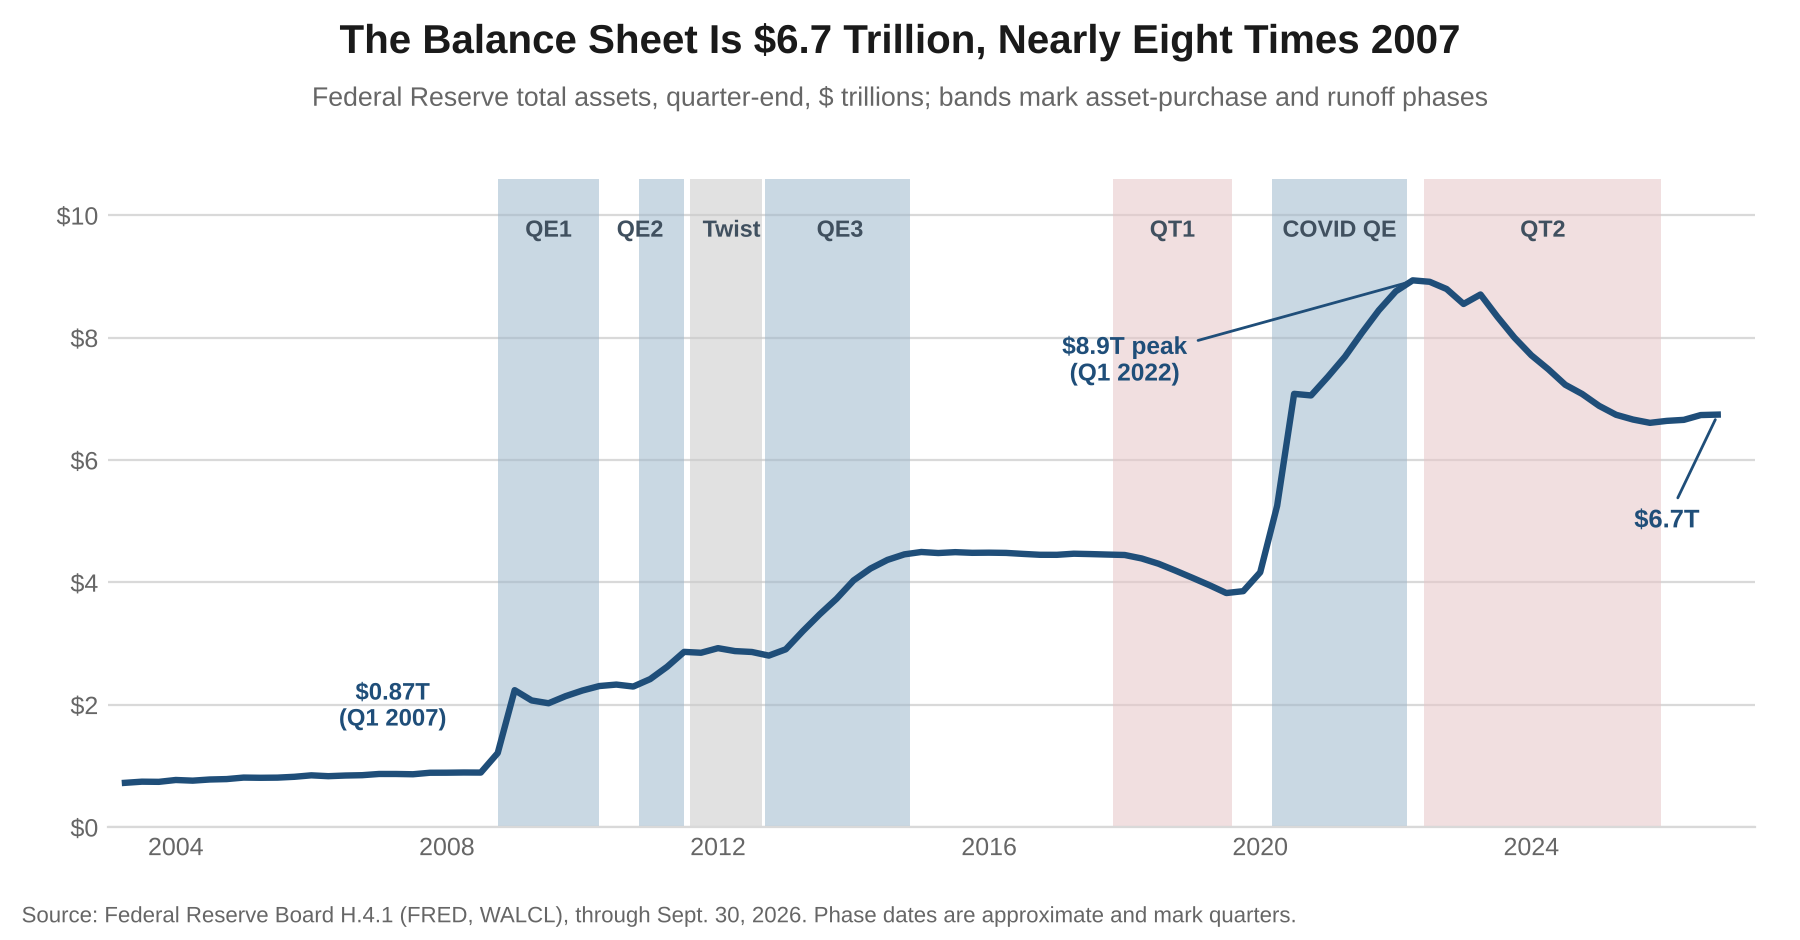
Even the most ambitious proposal in circulation leaves a balance sheet nearly three times its 2007 size. Donald Luskin of TrendMacro has proposed a new Fed-Treasury accord that would take Fed assets down to the $2.4 trillion of currency outstanding, which is 2.8 times the 2007 level, and Jai Kedia and Norbert Michel of the Cato Institute would exit mortgage-backed securities and hold only short-term Treasury securities. Allianz expects a hybrid, with a leaner balance sheet backed by standing repo facilities, and ABN AMRO expects a gradual shortening of the Treasury portfolio, a Twist in reverse. The portfolio’s weighted average maturity is a little over eight years against 3.25 years before the crisis, and the $1.9 trillion of mortgage-backed securities is running off at about $20 billion a month, which takes eight years. Warsh announced task forces in June, one of them on the balance sheet, and hopes “most, if not all of them” conclude by year end. We expect a portfolio that is shorter in maturity, lighter in mortgage-backed securities and somewhat smaller, with the size coming down only as fast as the demand for reserves does.
A smaller balance sheet adds supply of long-dated paper to a bond market that is already pushing back. The 10-year Treasury yield climbed from about 5% after the September 16 increase to around 5.25% by the start of last week, part of a global rise in long-term rates, and Jefferson cited the rise in his remarks. The minutes released today add that nominal yields rose about 35 basis points across the two- to ten-year range in the weeks before the meeting, and they note market commentary linking higher term premiums partly to uncertainty about the Treasury buyback program and heavy private debt issuance for AI infrastructure. Our August view was that the long end, and not the funds rate, is the binding constraint on the economy, because federal borrowing, an energy shock and the debt issuance behind the AI buildout are all competing for the same pool of capital. Warsh has said that unconventional policies should otherwise be “used sparingly, if at all” outside genuine crises, and a Fed that runs off duration into that market would add a fourth source of supply. That is the reason we expect the Committee to change the composition of the portfolio before it tries to change the size.
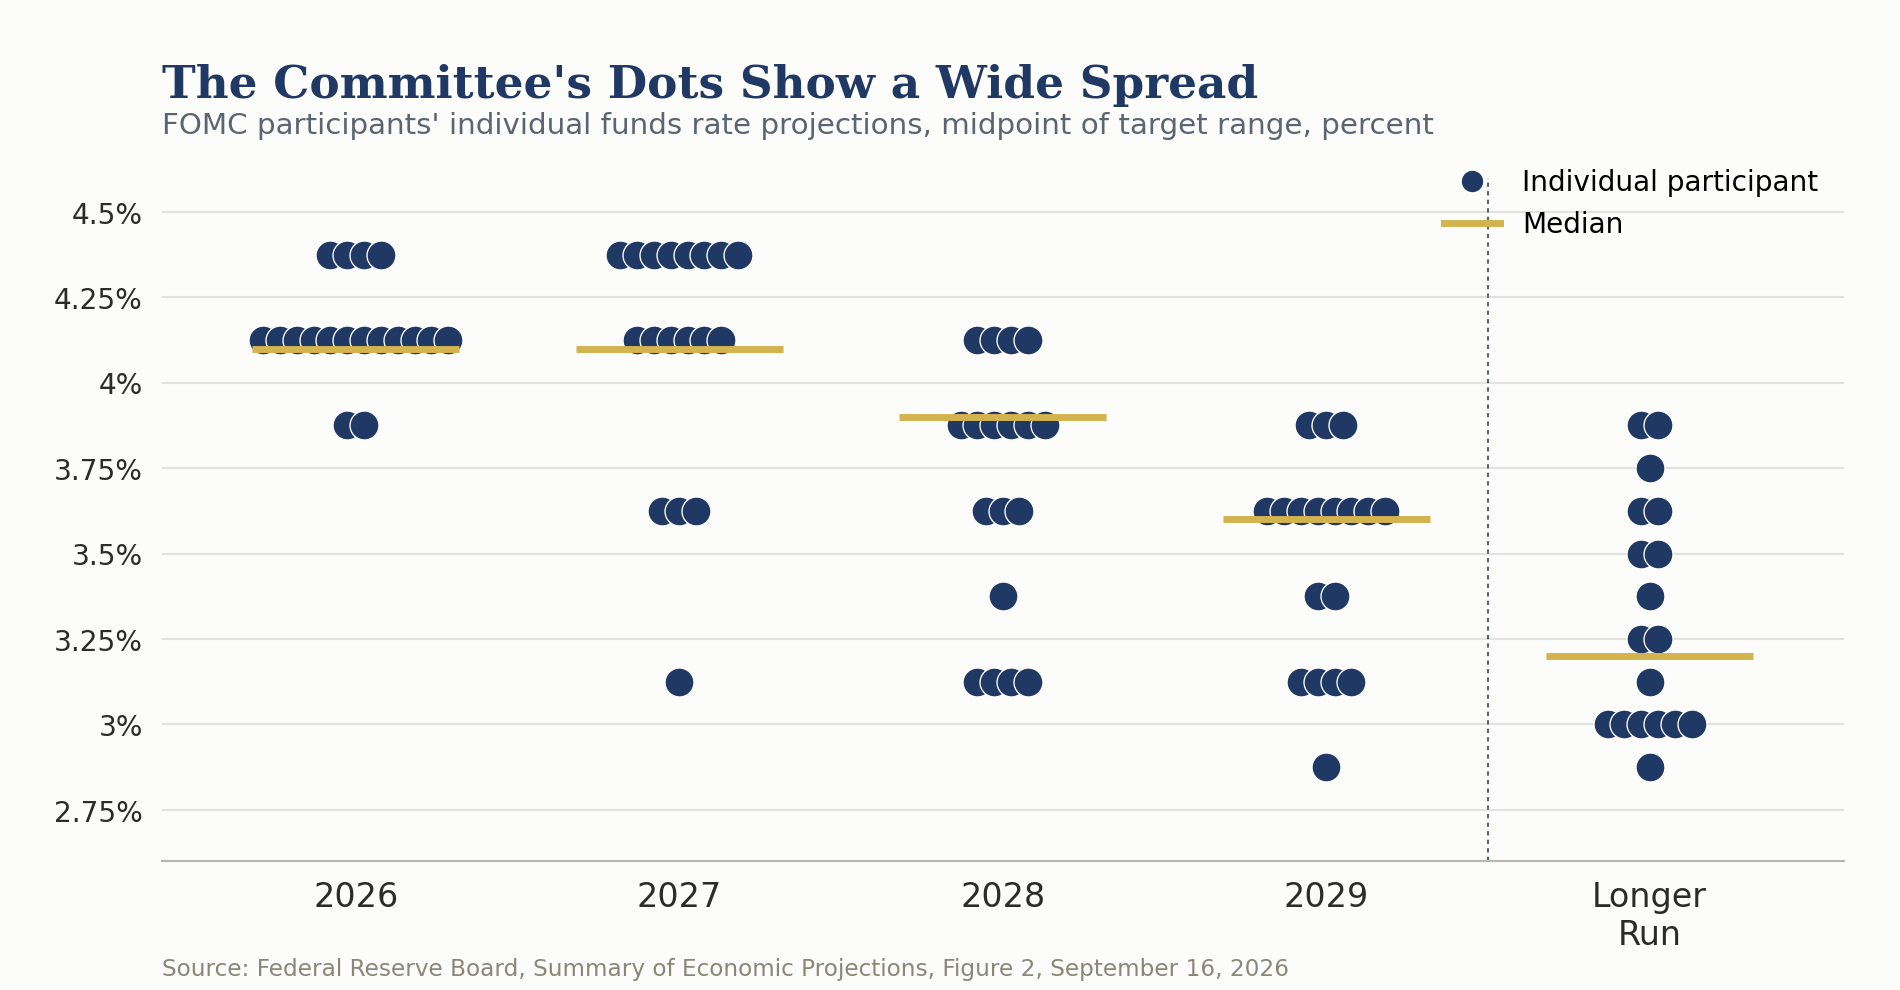
The policy rate also needs to look more normal, though it will not return to its pre-crisis norm. The effective funds rate held at 5.25% from mid-2006 to mid-2007 and averaged 4.4% over 1990-2007 by our calculation. The Committee’s longer-run median in the September projections is 3.2%, up from 3.1% in June, with individual participants ranging from 2.9% to 3.9%. A May note from the St. Louis Fed averaged several alternative models and put the real neutral rate at about 1.4% in the fourth quarter of 2025, which at 2% inflation corresponds to a funds rate a little above 3.4%, and it found that the Committee’s own estimate tends to adjust toward that average with a lag. We believe the AI capital buildout, the persistence of large federal budget deficits and rising risks to global supply chains, which are encouraging more investment in the U.S., argue for a neutral rate at least half a percentage point above the Committee’s 3.2% median and in the neighborhood of 4%. One reason we are not raising our estimate of neutral more aggressively is that so much of the recent growth has come from capital spending, which expands the economy’s ability to grow and so works mainly on the supply side. Demand for housing, the traditional transmission mechanism for monetary policy, remains quite soft, with real residential investment about 3% below its level a year earlier. The unusually wide dispersion in the Fed’s dot plot suggests the Committee is deciding whether to agree, and the minutes released today show that a couple of participants have already raised their estimates of neutral.
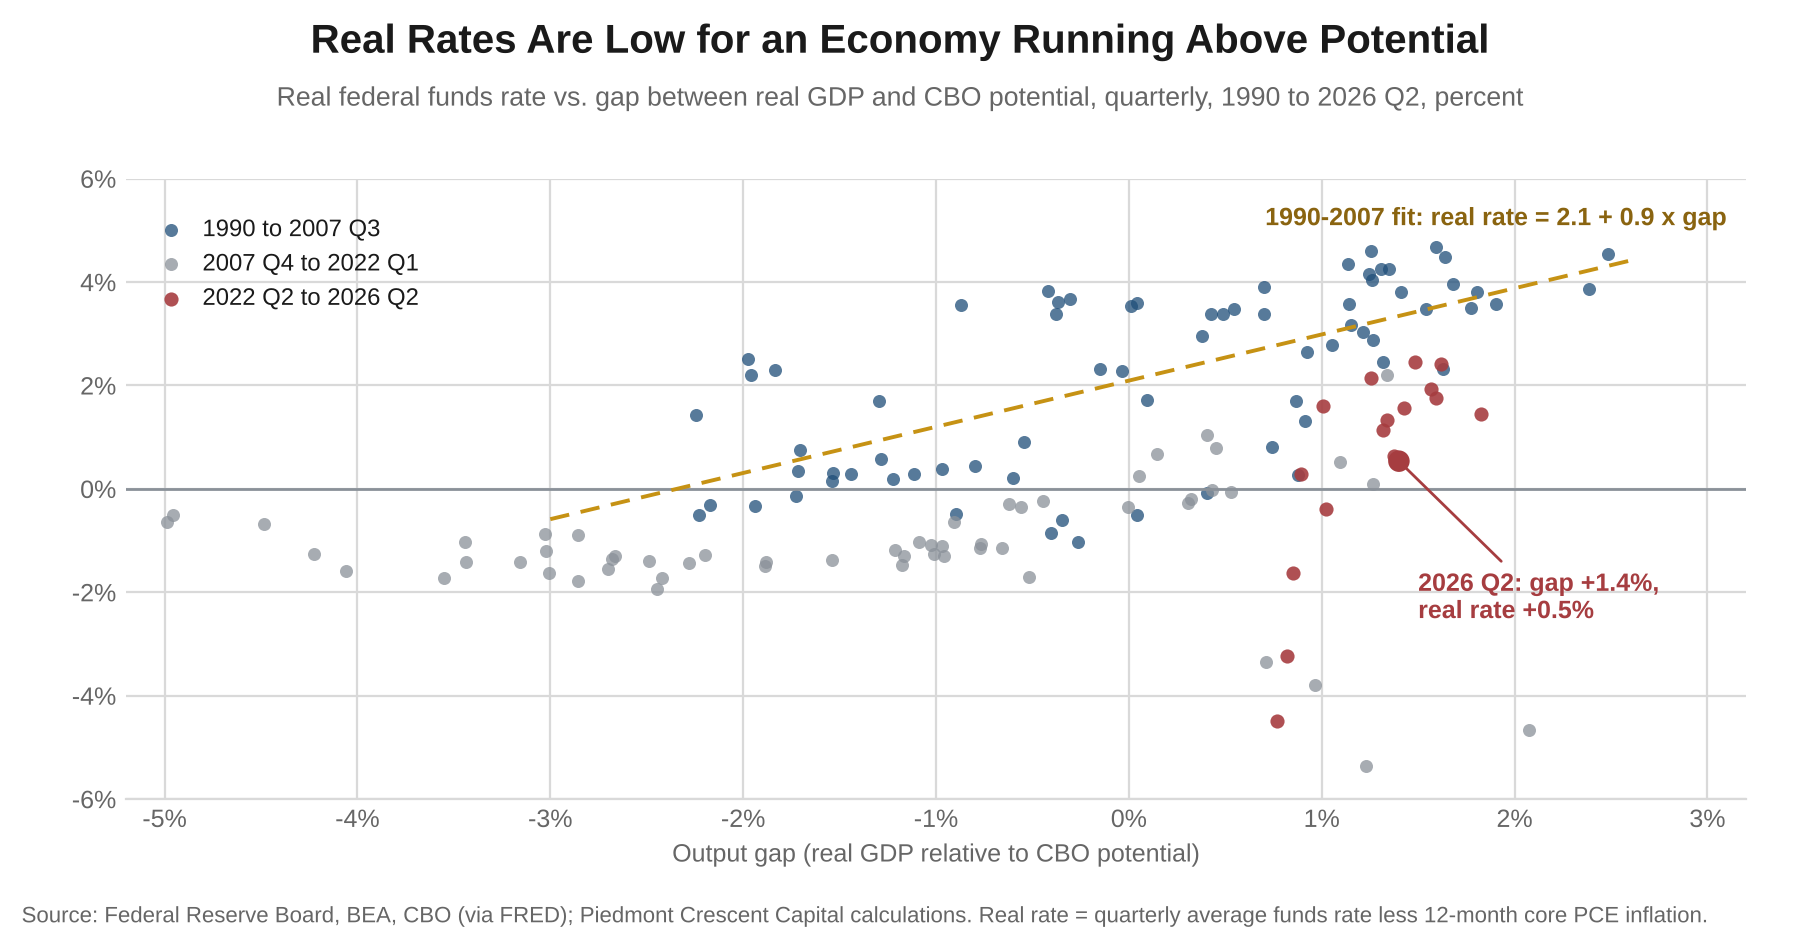
The real policy rate tells the same story. We have long found it useful to compare the real federal funds rate with the gap between actual and potential GDP, and the comparison is informative now. From 1990 to mid-2007 real GDP averaged almost exactly CBO’s estimate of potential, and the real funds rate, measured against core PCE inflation, averaged 2.2%. From the third quarter of 2009 through the third quarter of 2015 the real rate averaged about -1.4% while output ran about 2.6% below potential. In the second quarter of 2026 output is 1.4% above potential and the real rate is only 0.5%. The pre-crisis relationship is crude, with one variable and an R-squared of 0.45, but it implies a real rate of about 3.3% for a gap of that size. Our neutral estimate of about 4%, or roughly 2% in real terms, is close to the pre-crisis experience, so the distance shows that policy remains accommodative for an economy that has moved beyond the post-crisis and post-pandemic periods. Several participants said in the minutes released today that they view the current policy rate as not restrictive or only mildly restrictive. It also bears on the path below, since a funds rate of 4.25%-4.50% with core inflation near 3% would put the real rate at roughly 1.25% to 1.5%, close to the St. Louis Fed’s 1.4% estimate of neutral and still short of the roughly 2% implied by ours.
Our own path takes the funds rate to the old average and no further. We expect an increase on December 9 to 4.00%-4.25% and another in the first quarter of 2027 to 4.25%-4.50%. The minutes released today say most participants judged that another increase “would likely be appropriate by year end,” and many favored a higher path as insurance against inflation staying above target. The midpoint of 4.375% matches the 1990-2007 average and sits nearly 0.9 percentage point below the 2006-07 plateau. The Committee’s own median path then eases to 3.75%-4.00% in 2028 and 3.50%-3.75% in 2029 as inflation returns to 2%. A policy rate that settles near 4% leaves roughly 350 to 400 basis points of room before zero, and that room is the real argument for normalization, because the less often the rate sits at zero the less often the Committee needs guidance and asset purchases to do the work of a rate. Quantitative easing stays in the toolkit for genuine crises, as Warsh’s own formulation allows, and Faust expects “extremely strong pushback” inside the Committee to any move to restrict it once rates reach zero.
The dots show a Committee that has not settled on where the rate ends up. The longer-run projections of the 18 participants span a full percentage point, from 2.9% to 3.9%, with the largest cluster at 3.0% and a median of 3.2%. Our estimate of neutral in the neighborhood of 4% sits just above the top of that range. The near-term dots lean our way. Eight of the 18 participants place the funds rate at 4.25%-4.50% at the end of 2027, double the 4 who do at the end of 2026, and that is where our path puts it. The median still eases to 3.9% in 2028 and 3.6% in 2029, but the spread widens from half a point in 2026 to 1.25 points in 2027 and a full point in 2028 and 2029. We read that spread as a debate about neutral.
Three things could make this wrong, and the first is the calendar. The October 27-28 meeting falls six days before the midterm elections, and Rosengren notes that a one-meeting delay “won’t make a big difference economically but could make a big difference politically.” The second is the bond market, because if long-term yields keep climbing a Committee that says little has few ways to calm them. The third is the communications task force. Robeco’s analysts suggest the review could lead to a scenario-based projection format like those at the European Central Bank and the Bank of England, and a change of that kind would fit our view as long as the Committee still explains how it reads the data.
Most of our calls in this piece can be scored by the end of the year, and the balance sheet call by the end of 2027. The October 28 statement should carry no calendar, threshold or path language, as in every statement since June. The minutes released today, which record a 12-0 vote, show a Committee that approaches each meeting with “an open mind” and ties its decisions to incoming information, with no promised path. By year-end, the task forces should report, and we expect the communications review to leave a projection release in place in some form, so an outright end to the dot plot would mean we have the destination wrong. We expect the December 9 increase, which Williams has called “a reasonable way of thinking about it.” On the balance sheet, we expect total assets to be lower at the end of 2027 than today’s $6.74 trillion and no lower than $5 trillion, with composition changing first. The median respondent in the New York Fed’s July survey of market expectations sees assets of $6.90 trillion at the end of 2027, so the market does not yet agree with us on direction.
The end state we expect is a Fed that says less, owns less and sets a more normal policy rate. It describes how it reads the economy and stops short of promising a path, holds a portfolio that is shorter and smaller than today’s and still several times its 2007 level, and runs a funds rate that peaks near its old average and settles below its old plateau. Our call would break if long-term yields or credit spreads tightened financial conditions faster than the Committee intends, because a Fed that has just spent a year teaching markets to expect silence would then have to decide whether to speak.
Appendix A. The emergency toolkit, 2008 to 2026
| Tool | Introduced | Scale | Status, October 2026 | Our expectation |
|---|---|---|---|---|
| Zero policy rate | Dec. 16, 2008; again Mar. 2020 | Effective funds rate below 0.25% in 36 quarters | Retired; effective funds rate 3.88% | Peaks at 4.25%-4.50% in Q1 2027; settles near 4% |
| Large-scale asset purchases | Nov. 25, 2008; Mar. 18, 2009; Nov. 3, 2010; Sept. 13, 2012; Mar. 2020 | Assets from $0.9T in early 2008 to $4.5T at end-2014 and $8.9T in Mar. 2022 | Runoff June 2022 to Dec. 1, 2025; assets $6.74T; bill purchases to manage reserves, now paused | Smaller than today, above $5T by end-2027 |
| Maturity extension (Operation Twist) | Sept. 21, 2011; extended June 20, 2012 | $400B plus $267B, $667B in all | Completed in 2012; Treasury portfolio maturity a little over 8 years against 3.25 before the crisis | Portfolio shortens |
| Calendar and threshold guidance | Aug. 9, 2011; Dec. 12, 2012 | "At least through mid-2013"; 6.5% unemployment threshold | Retired | Not revived |
| Outcome-based guidance and average inflation targeting | Aug. and Sept. 2020 | Hold the rate at zero until inflation reached 2% and was on track to moderately exceed it | Dropped in the 2025 framework review | Not revived |
| Summary of Economic Projections (dot plot) | Jan. 25, 2012 | Median and range of participants’ funds-rate paths | Published Sept. 16, 2026; Chairman Warsh submitted no projection | Survives in some form |
| Press conference after every meeting | Jan. 2019 | Chair explains the decision at each meeting | Held at the June, July and September 2026 meetings, with little narrative | Continues, with less narrative |
| Interest on reserves and ample reserves | Oct. 2008; ample-reserves system from 2019 | Reserve balance rate 3.90% since Sept. 17, 2026; reserves about $3T | In place | Stays; size depends on reducing demand for reserves |
| Emergency lending facilities and swap lines | 2007-09; Mar. 2020; Bank Term Funding Program Mar. 2023 | Facility sizes varied | Emergency facilities closed; standing repo facility in place since 2021 | Held in reserve for crises |
| Reserve management purchases | Dec. 2025 | Treasury bills | Paused in September; pace set month to month to keep reserves ample | Pace revisited after the task force reports |
Appendix B. How far back toward the 2006-07 norm
| Measure | 2006-07 level | Post-crisis extreme | Today | Share reversed | Where we expect it to end |
|---|---|---|---|---|---|
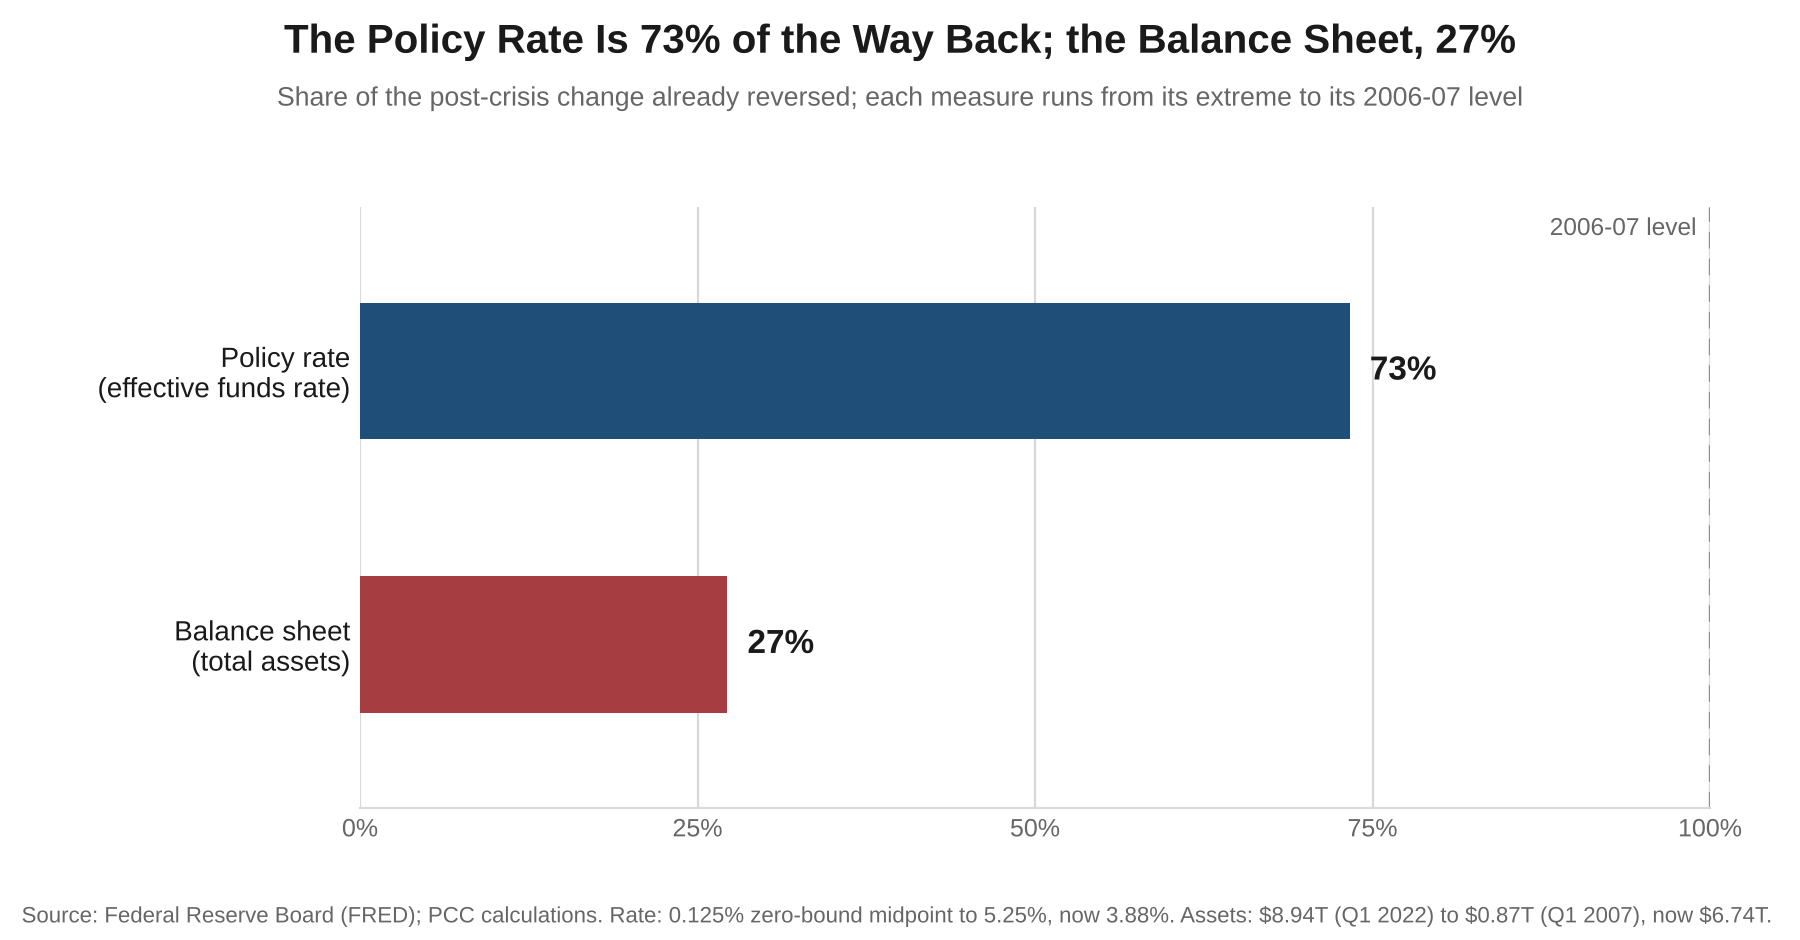
| Effective funds rate | 5.25% | 0.125% (zero-bound midpoint) | 3.88% | 73% | Peaks near 4.4% in 2027; settles near 4% |
| Fed total assets | $0.87T (Q1 2007) | $8.94T (Q1 2022) | $6.74T (Sept. 30, 2026) | 27% | Lower than $6.74T by end-2027 and above $5T |
Sources and Notes
Sources. Federal Reserve Board (FOMC statements, press release of January 3, 2001, Summary of Economic Projections of September 16, 2026, minutes of the September 15-16, 2026 meeting released October 7, 2026, H.4.1, Chairman Warsh’s Jackson Hole remarks of August 28, 2026); Allan H. Meltzer, A History of the Federal Reserve; William Greider, Secrets of the Temple (1987); Money and Banking (FOMC communication history, 2019); CNN Money (January 2-3, 2001); Marvin Goodfriend, “Monetary Mystique: Secrecy and Central Banking,” Journal of Monetary Economics, 1986; Federal Reserve Bank of St. Louis (FRED; “Comparing the FOMC’s Estimate of R-Star with Alternative Estimates,” May 2026); Federal Reserve Bank of New York (Survey of Market Expectations, July 2026; Gagnon, Raskin, Remache and Sack, “Large-Scale Asset Purchases by the Federal Reserve: Did They Work?,” Staff Report 441); Federal Reserve Bank of San Francisco (Eric Swanson, “Let’s Twist Again,” 2011); Brookings Papers on Economic Activity (Krishnamurthy and Vissing-Jorgensen, 2011; Jonathan Wright, 2022); National Bureau of Economic Research (Greenlaw, Hamilton, Harris and West, Working Paper 24687); Congressional Budget Office and Bureau of Economic Analysis (via FRED); Kitco (Chairman Warsh’s July 29, 2026 press conference); The Wall Street Journal (Nick Timiraos, October 6, 2026); Reuters; American Banker; Johns Hopkins Krieger School of Arts & Sciences (Jon Faust); Axios (Darrell Duffie); TrendMacro (Donald Luskin); Cato Institute (Jai Kedia and Norbert Michel); First Trust Portfolios; MetLife Investment Management; ABN AMRO; Allianz; Robeco; Piedmont Crescent Capital calculations. © 2026 Piedmont Crescent Capital. All rights reserved.
Mark P. Vitner
President & Chief Economist, Piedmont Crescent Capital
mark.vitner@piedmontcrescentcapital.com · 704-458-4000
Piedmont Special Reports are published by Piedmont Crescent Capital for informational purposes only and do not constitute investment, legal, or tax advice. Views expressed are those of the author as of the date of publication and are subject to change.