
A View from the Piedmont — Our Weekly Commentary on Money, Credit, Exchange Rates & Geopolitics
Tight Labor, Tight Money
New York Fed President John Williams said another rate hike by year end is a reasonable bet, and the bond market took him at his word: the 10-year Treasury touched its highest level since 2007. Underneath, a labor force that keeps shrinking raises the odds that a falling unemployment rate will make it exceedingly difficult to bring inflation down to the Fed’s 2% target.
Editor’s note: This issue covers the full data slate released since our last edition, New York Fed President John Williams’ September 24 remarks calling another rate hike by year end a reasonable expectation, and a diplomatic calendar that produced a signed U.S.-Denmark-Greenland framework and a Trump-Xi meeting that extended the trade truce without breaking new ground.
Market Dashboard
(as of Friday, September 25 close, unless noted)
| Rates & Credit | Rates & Credit | Equities & Commodities | Equities & Commodities |
|---|---|---|---|
| Fed funds target range | 3.75%-4.00% (unchanged since Sept 16 hike) | S&P 500 | 7,743.41 (+0.51% Fri) |
| 10-yr Treasury | 5.17% (Fri close, highest since 2007) | Dow Jones | 51,828.62 (+0.93% Fri) |
| 30-yr Treasury | 5.49% (Fri close, highest since 2004) | Nasdaq Composite | 27,068.72 (+0.48% Fri) |
| 2-yr Treasury | 4.81% (Fri close) | Russell 2000 | 2,837.55 (+0.07% Fri) |
| 2s-10s spread | 36 bp | Brent crude (Nov) | $104.32 (-2.1% Fri, +0.4% wk) |
| 30-yr mortgage | 7.03% (Freddie Mac, wk of Sept 24) | WTI crude (Nov) | $92.41 (-2.3% Fri, -7.9% wk) |
| Retail diesel | $6.50/gal (AAA) | Gold (Dec) | ~$4,300 (spot +0.1% Fri, -2% wk) |
| Core CPI (Aug, y/y) | 2.4% (core goods +0.1% m/m) | U.S. Dollar Index (DXY) | 100.97 (-0.3% Fri) |
| Initial jobless claims (wk ended 9/19) | 197,000 | UMich 1-yr inflation exp. (Sept, final) | 4.6% (up from 4.0%) |
| Chicago Fed NAI (Aug) | -0.04 | UMich Consumer Sentiment (Sept, final) | 48.1 (-3.6 pts m/m) |
Treasury yields are the official daily par yield curve for Friday, September 25, including a completed 30-year close. The mortgage rate is the Freddie Mac PMMS survey for the week ended September 24. Retail diesel is the AAA national average for September 25.
Summary
New York Fed President John Williams said Thursday that another rate hike by year end is a reasonable expectation, and the bond market has priced that in as merely a starting point. Speaking in London at a National Institute of Economic and Social Research conference, Williams called it “a reasonable way of thinking about it,” an unusually direct signal from a sitting FOMC voter this early in the intermeeting period. A weak $70 billion five-year Treasury note auction the same week added its own pressure. The 10-year Treasury touched its highest level since 2007, near 5.17% to 5.23% intraday, and Freddie Mac’s weekly survey put the 30-year mortgage rate at 7.03%, the highest since January 2025.
Underneath the rate story is a labor-market story that should make it more difficult to bring inflation down to the Fed’s target. The U.S. civilian labor force is smaller than it was a year ago. Immigration enforcement and falling participation have done the work a hiring boom usually does, and that arithmetic lowers the payroll growth needed to hold the unemployment rate steady. A falling jobless rate that merely tracks a shrinking labor force against soft demand is not inflationary; the same decline with GDP holding at or above potential is a different problem, and the September projections put growth a touch above the Committee’s own speed limit.
The diplomatic calendar mostly resolved loose ends rather than breaking any significant new ground. Trump and Xi met in Washington September 23-25 and extended the Busan trade truce to January 10, 2027, a technical extension Treasury Secretary Bessent called a placeholder rather than a breakthrough. The United States, Denmark and Greenland signed their framework agreement September 22, opening new U.S. sites beyond Pituffik. Two fronts we flagged last issue moved the wrong way: Pakistan struck ten targets inside Afghanistan on September 24, and Ukraine struck two more Russian refineries, taking roughly 370,000 barrels a day of capacity offline.
Two releases we expected this week did not arrive. The third estimate of second-quarter GDP and August core PCE inflation, the Fed’s preferred gauge, are due out September 30, landing alongside August JOLTS the day before and ahead of the ISM manufacturing report and the September employment report, four market-moving releases inside one five-day stretch a month before the Committee meets again.
This Week’s Argument
A falling unemployment rate, a shrinking labor force
The unemployment rate is 4.1%, down from 4.3% a year earlier, and that decline has not come from a hiring boom. The civilian labor force is down about 1.0 million from August 2025. Participation has slipped to 61.6% from 62.3%. Net immigration has collapsed, and the foreign-born labor force is smaller than a year ago; the pullback is not confined to workers without legal status, as tighter enforcement and new work-authorization restrictions have pulled some immigrants with legal work status out of the labor force as well. Prime-age participation has held up better than the headline rate, so the squeeze is demographic and policy-driven, not a collapse in core-age attachment. That mix has cut the payroll pace consistent with a stable unemployment rate to something like the mid-teens to as much as 80,000 a month, depending on the migration assumption and assumptions about the return of foreign-born workers with legal status. Soft job growth can now coexist with a falling or stable jobless rate. We lean toward higher estimates and look for foreign-born workers with legal status to return to the workforce during the coming year.
The inflation question is tidier than that. The risk is a falling unemployment rate while real GDP runs at or above potential. The September projections have 2026 growth at 2.3% and 2027 at 2.4%, against a 2.0% longer-run speed limit, with the jobless rate already a tenth below the Committee’s own 4.2% longer-run median. Potential labor input is nearly flat. Capital spending, especially AI-related equipment and intellectual property, is carrying a disproportionate share of growth, an employment-light expansion running a small positive output gap. Firms ask more of a smaller pool before they bid wages sharply higher. Unit labor costs are the transmission belt: nonfarm productivity is up 2.2% over the four quarters through the second quarter, and unit labor costs are up 1.4%. The Employment Cost Index is stuck near 3.4%. Those readings are compatible with a grind back toward 2% inflation if productivity holds. They are not a reason to assume the labor market will do the Fed’s work for it.
The payroll detail is not one story either. Manufacturing has picked up, adding 16,000 jobs in August and 58,000 since the December low, led by machinery and fabricated metals. Construction is still growing, but the mix has shifted: residential building is roughly flat from a year ago while nonresidential work, factories and data centers, carries the sector. Financial activities have been shedding jobs on the monthly payrolls, and this week’s selloff in banks, brokers and insurers, after Meta’s Muse agent hit No. 1 on the App Store, looks like the market pricing broader AI-disruption risk into consumer-facing service businesses rather than a narrow read on financial-sector hiring. We do not expect a 1970s-style spiral, but we would not rule out a Committee that stays on hold longer than fading energy and tariff effects would seem to justify if the jobless rate keeps edging down while output holds near 2¼% to 2½%.
Behind the Numbers
The Brent-WTI spread is the cleanest read on this week’s oil market, and it reflects two different themes. Brent, the November contract, held near $104 as Ukraine’s strikes on two more Russian refineries, Lukoil’s Perm plant and the Novoshakhtinsk facility in Rostov, took a combined 370,000 barrels a day of capacity offline, against a backdrop of fuel-export bans Moscow already had in place. WTI, also the November contract, fell nearly 8% on the week on hopes for a U.S.-brokered truce with Iran. The spread between the two, more than $11 a barrel, is the widest since May, and it is a geopolitical risk premium on the global barrel, not the domestic one, showing up in the number.
September’s flash PMIs were the strongest since 2021, and that, along with hawkish Fed comments, sent bond yields higher. The composite index rose to 58.4 from 56.0, manufacturing to 57.0 from 53.9, and services to 58.7 from 56.5, but input prices accelerated and suppliers’ delivery times lengthened in the same report, a combination the regional Fed surveys have been flagging all month: the Philadelphia Fed’s prices-paid index jumped to 48.6 in September from 40.9 and its delivery-times index surged to 26.5 from 3.7 even as its headline activity gauge fell to 37.8 from 47.4, and the New York Fed’s Empire State survey showed prices paid rising to 63.1 from 58.6 on a headline reading that eased to 7.6 from 20.6. Growth and renewed price pressure are printing together, which is the data-side argument behind Williams’ line that another hike by year end is a reasonable expectation.
We have focused on the manufacturing revival this year, noting that the factory sector provides the cyclical swing in economic growth. The resurgence in manufacturing is being led by the AI buildout and related energy grid buildout. AI is not the economy’s only strong suit, however. Commercial aircraft assemblies have ramped up this year, as Boeing has gotten the kinks out of its production process. Shipments of nondefense aircraft through August are up 5.0% from the same period a year ago. Defense replenishment is another key growth area, as is the private space industry. Reshoring of critical industries is also driving output, and the pharmaceutical industry is in the midst of a once-in-a-generation expansion, fueled by breakthrough medicines and the desire to bring the supply chain back into the U.S. All of this investment is driving interest rates higher, as private credit needs bump up against persistent large federal deficits and resulting Treasury borrowing.
New home sales rose 6.4% in August to a 684,000 annual rate, an eight-month high, even as the 30-year mortgage rate finished the week at 7.03%. Durable goods orders were flat on the headline in August, but the ex-transportation reading, the cleaner read on underlying business investment, rose 0.3%. The Chicago Fed’s National Activity Index slipped to -0.04 in August from an upwardly revised 0.08 in July, still consistent with growth near trend rather than a slowdown.
The final University of Michigan survey split cleanly between the present and the future. Current conditions eased only a point to 50.9. Expectations fell 5.2 points to 46.3, and year-ahead inflation expectations jumped to 4.6% from 4.0%, the highest reading since June. Consumers are not describing a weaker economy today. They are describing one they expect to cost more.
Bottom Line
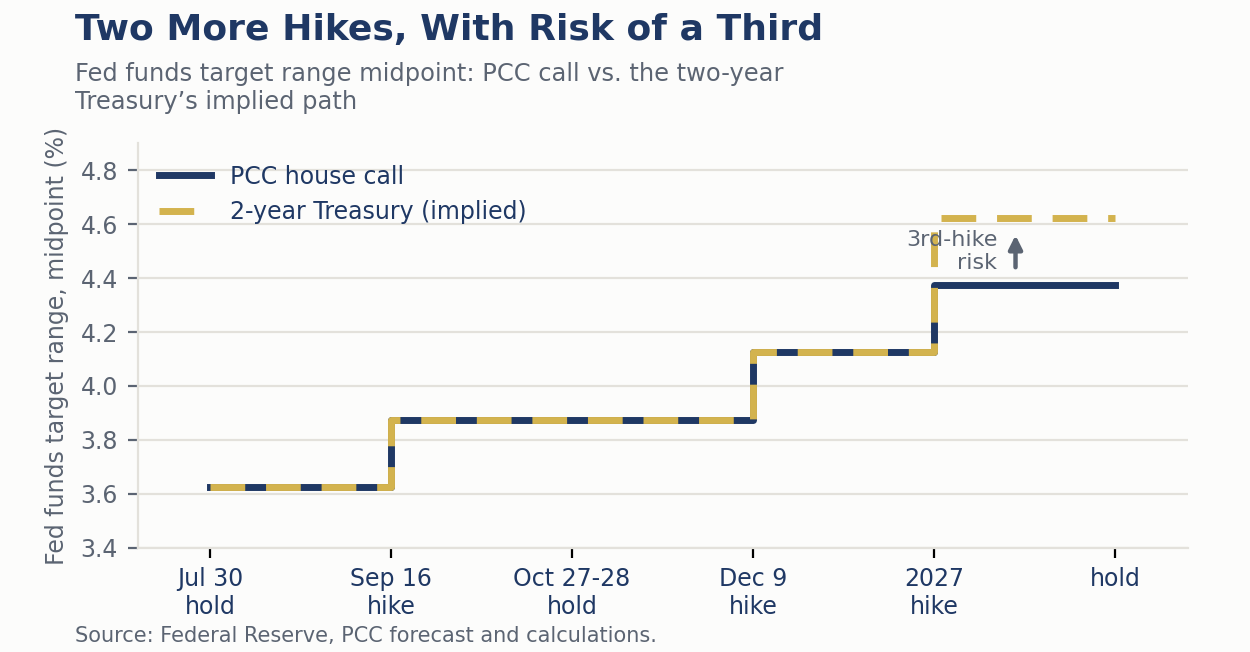
We continue to expect the Committee to pause at the October 27-28 meeting and deliver a second quarter-point hike on December 9, taking the funds rate to 4.00%-4.25% by year-end, with at least one further quarter-point increase in 2027 carrying the terminal rate to 4.25%-4.50% or higher. New York Fed President Williams’ September 24 remarks, calling another hike by year end “a reasonable way of thinking about it,” are consistent with that path but do not pin down which meeting delivers it. That call is ceteris paribus, as it has been every issue since the hike, and less is holding still than it was a week ago: this week’s weak five-year Treasury auction and the strongest flash PMI reading since 2021 both cut toward an earlier move, not a later one. The September employment report, due October 2, and August core PCE inflation, due September 30, are the releases likely to settle the near-term timing before the Committee meets again. A jobless rate that keeps falling while growth holds near or above potential, the risk we lay out above, would argue for an earlier or larger move, not a smaller one.
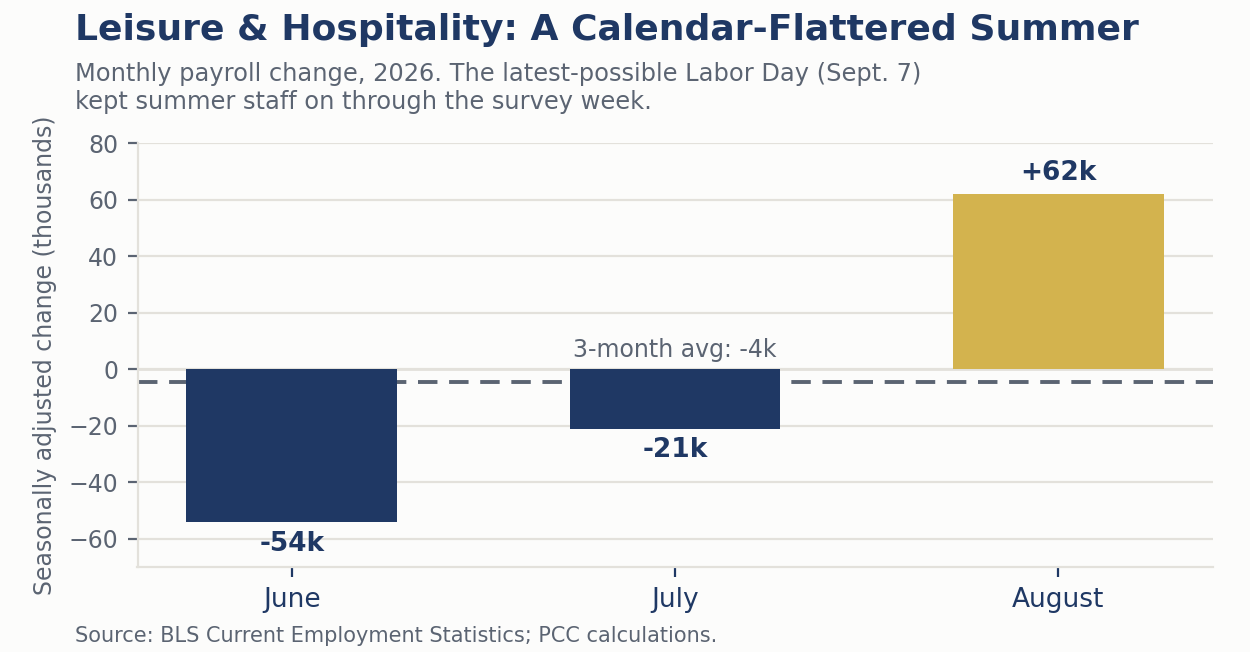
A cut is not on our radar under this path, and we expect the Committee to hold once it reaches it. Only a weakening economy, paired with wider credit spreads and tighter lending conditions, would argue for a cut before then. The two-year Treasury is already pricing close to three hikes, consistent with the upside risk in our call, though that pricing can move quickly against a single month of weaker data. We also think the calendar flattered August’s numbers. The latest-possible Labor Day, September 7, extended the summer season and kept seasonal staff on payrolls through the survey week. September data may benefit the same way, but seasonal factors are built to net to nothing across a full year, so that flattering effect implies a payback later, not a free pass.
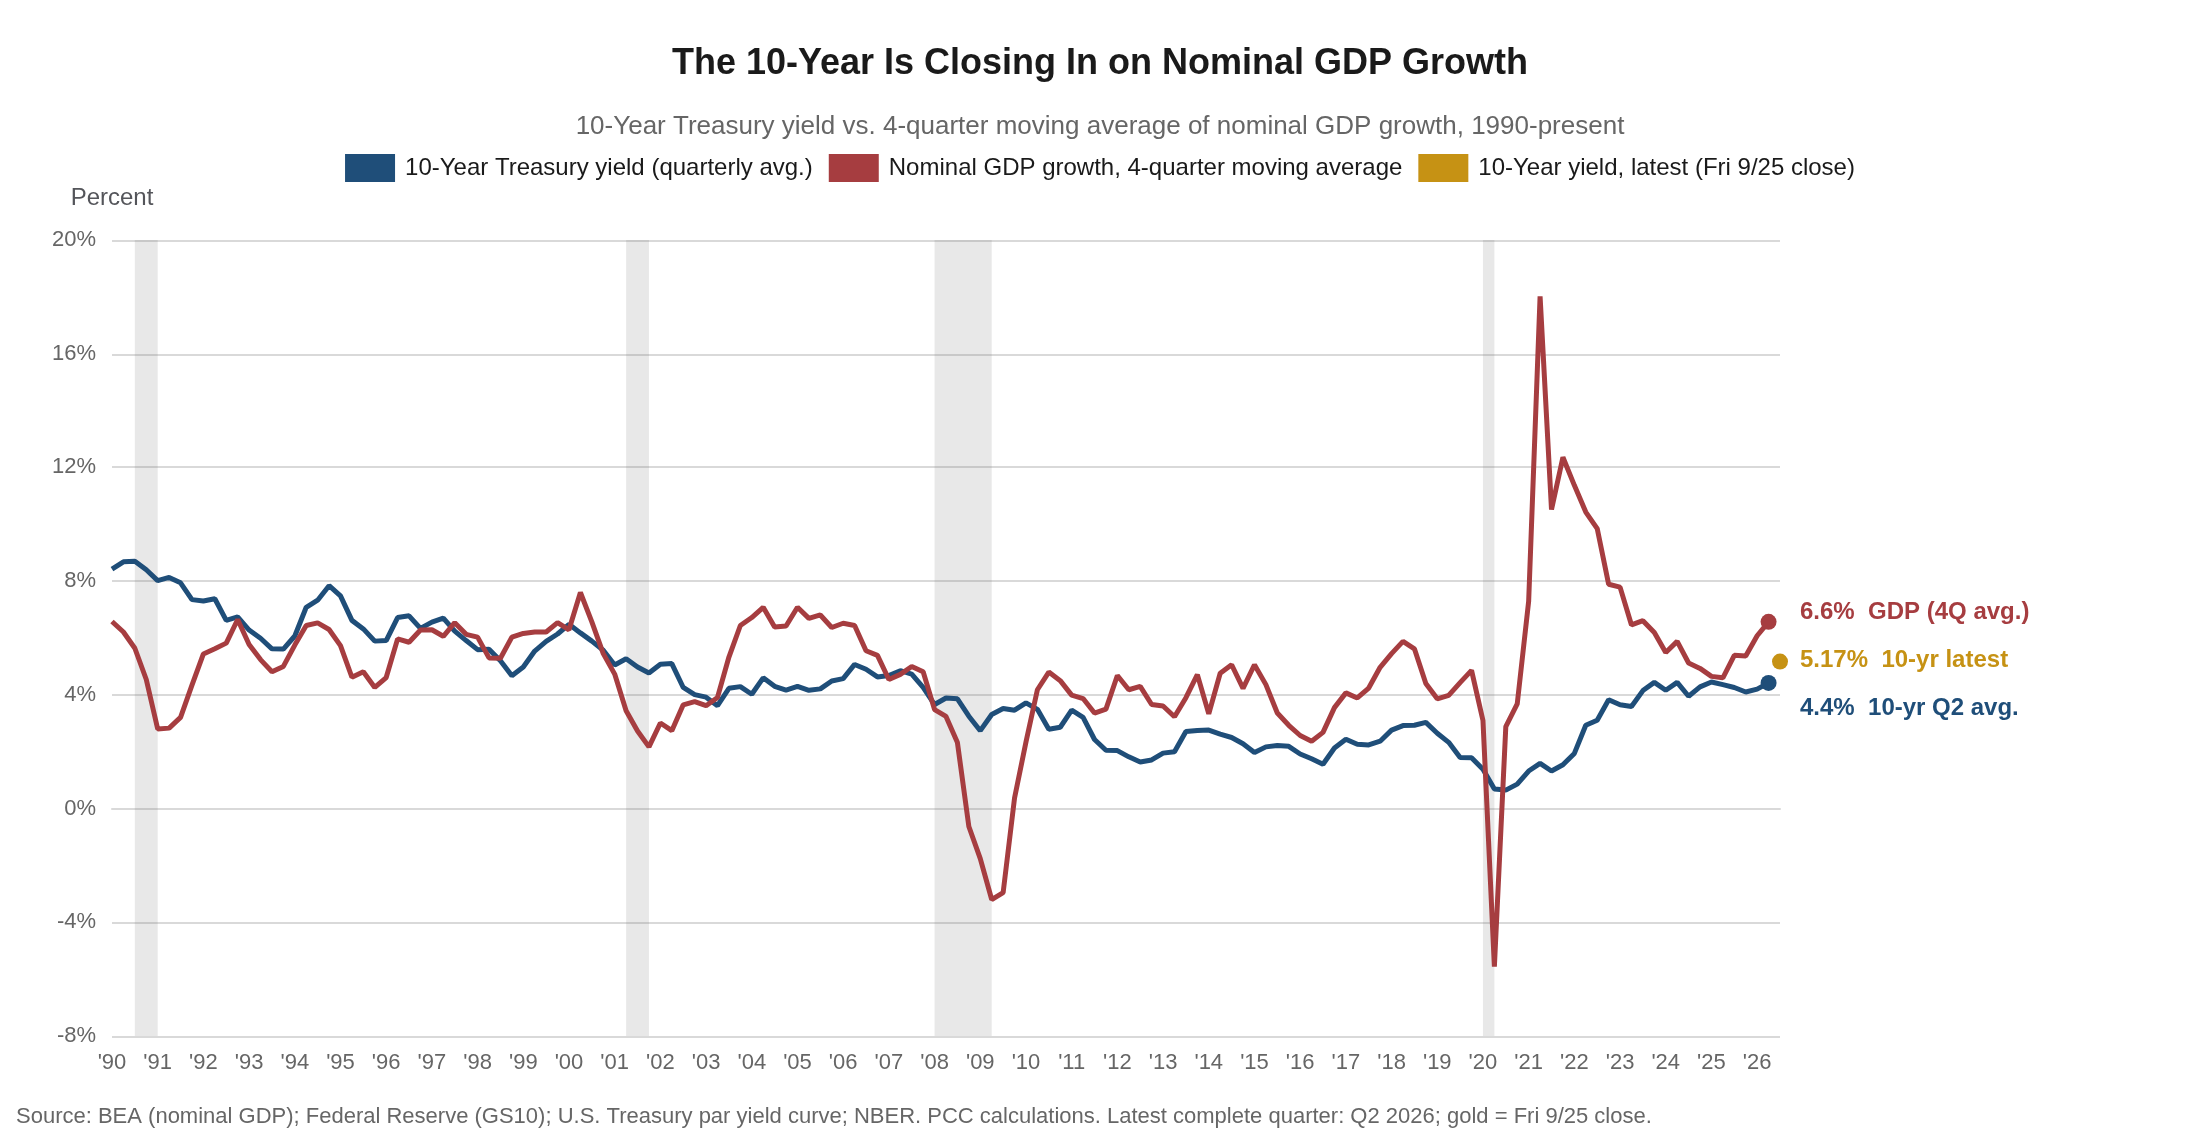
Hold the 10-year where it has moved this week, and we would take residential construction down a little more and start curbing business fixed investment in the second half of 2027. The level that creates real pain is not a fixed number; it is where the 10-year sits relative to nominal GDP growth. Nominal GDP has been growing near 6.6% on a four-quarter basis, and the 10-year, now at its highest level since 2007, has closed roughly a third of that gap since the second quarter. Once the yield actually reaches that growth rate, financing costs exceed the economy’s capacity to generate the income that services them, and investment is what gives first. That is the falsifiable test behind this call: a 10-year that keeps climbing toward the growth rate, or nominal growth that keeps decelerating toward the yield, is the signal to take both calls down further.
CFO and Treasurers Corner
- Refinance and term-out decisions should not wait for a cut that is not coming. This week’s bond market reaction, the 10-year Treasury touching its highest level since 2007, says the market already agrees. Lock in financing against a floor near 4.00%-4.25% by year-end, not a hoped-for easing.
- Budget the diesel crack, not the barrel. Russia’s fuel-export bans, already in force before this week’s refinery strikes, keep pulling barrels out of the diesel and jet-fuel market regardless of what happens next in Ukraine; a Politico report that Washington was weighing its own diesel-export limits was denied by the White House the same day it ran, so that risk is not live for now. Watch for it to resurface if domestic diesel prices keep climbing.
- Widen dollar hedge ratios, and do not assume the post-hike move is done. The dollar index posted a second straight weekly gain even after a Friday dip to 100.97, evidence the hawkish repricing since September 16 has legs. Revisit hedge ratios set before that meeting rather than waiting for a pullback that has not shown up yet.
- Budget labor costs off unit labor costs, not the unemployment rate. Unit labor costs are up 1.4% over the past four quarters against 2.2% productivity growth, and the Employment Cost Index is steady near 3.4%. A falling jobless rate driven by a shrinking labor force is not, by itself, a signal to budget for faster wage growth nationally; in the most recent state employment data, already two weeks old, South Carolina, North Carolina and Nevada stood out as states still adding workers at pace, and that is where the wage-cost risk concentrates.
- Power capacity remains the line item most treasurers still leave out of project underwriting. Nothing this week changes that; the capital-intensive, employment-light expansion described above is still running hardest through the sectors that supply its electricity.
- Treat Red Sea and Pakistan-Afghanistan risk as one supply-chain exposure, not two. Houthi missiles reached Taif and Yanbu inside Saudi Arabia on September 24, widening the target set beyond shipping itself, and Pakistan’s airstrikes into Afghanistan the same day raise the odds of a disruption reaching routes through South Asia or the Bab al-Mandeb. Compare current routing and reinsurance costs against Cape of Good Hope economics for any shipment where the math was close before.
Piedmont Perspective
Inflation Travels Through the Supply Chain, Not Just the CPI Basket
From the Cleveland Fed and European Central Bank’s joint inflation conference, September 24-25, 2026
The Cleveland Fed and the European Central Bank spent Thursday and Friday on a question that has dogged the expansion all year: why inflation has stayed above the 2% objective for more than five years, even after the first round of tariff and energy shocks was supposed to have washed through. The papers were technical. The implication for the outlook is not.
Cleveland Fed president Beth Hammack opened the conference by putting the current mix of shocks on the table: output growing at a solid pace, the labor market close to her definition of maximum employment, and inflation still elevated with risks tilted to the upside. She grouped the shocks the way a regional economist would: tariffs and oil on the supply side, the boom in AI-related capital spending on the demand side. On Friday’s policy panel she went further. The risk that concerns her most is not another one-off price spike; it is the chance that an inflationary mindset takes hold after the Committee has missed its target for more than five years. The ECB’s Boris Vujčić offered the contrast: the euro area had largely converged on its inflation target earlier this year before a second energy shock arrived; August euro-area inflation was back up to 3.2%, and the ECB’s own September projections now put 2027 inflation at 2.5%, up from 2.3% in June.
Several of the papers rested on a simple accounting fact standard models bury: firms sell to other firms, not just to households. Once that is written down, inflation is not one Phillips curve but a system of sectoral ones tied together by the input-output table, and two results follow that cut in opposite directions. An upstream shock, oil, a tariff on intermediates, a jump in semiconductor prices, does not hit the CPI on impact; it walks down the chain, and each sticky link delays how much shows up in core inflation months later. A demand shock does the opposite: intermediate prices rise gradually, downstream firms see higher sales but only modestly higher costs, and they have less reason to reprice, which is why a capital-heavy, employment-light expansion can keep generating growth while the inflation impulse from AI-related equipment and power demand is still working its way through producer prices.
A Cleveland Fed paper presented Thursday adds a piece firm surveys have been hinting at: firms in industries with larger sales relative to GDP and more flexible prices forecast CPI more accurately, and peripheral firms rationally pay less attention. That inattention travels downstream. If a supplier is not watching aggregate inflation, a buyer’s costs are stickier than its own price-setting rule would suggest. A few of the policy-design papers pointed toward a shared implication: optimal policy in a network still looks like stabilizing a price index, but the weights are not CPI or PCE shares. More weight belongs on larger, stickier and more upstream sectors, energy, chemicals, logistics, semiconductors, and less on the downstream services that dominate the consumer basket but sit far from where the cascade starts.
Map this year’s shocks onto the network and the data look less mysterious. Energy is a classic upstream commodity shock; delayed pass-through into core goods and transportation services is the model’s prediction, not a puzzle. Tariffs are a tax on a subset of imported intermediates, and how much shows up in producer prices depends on where the taxed good sits in the chain. AI-related capital spending is a demand shock concentrated in a handful of hubs, semiconductors, electrical equipment, nonresidential construction and utilities, and those hubs can move aggregate inflation by more than their weight in the CPI basket, with the impulse persisting after first-round equipment prices settle because the cost cascade is still moving downstream.
For the Carolinas and the rest of the Piedmont, the same map has a regional reading. The manufacturing and logistics belt from Greenville and Spartanburg through Charlotte, the Triad and into the Virginia Tidewater sits closer to those upstream nodes than the national average. Energy, chemicals, transportation equipment, electrical equipment and the data-center buildout are not rounding errors in this district; when those prices move, local producer and eventual consumer prices tend to move with them, on a lag easy to miss if the only series on the desk is metro CPI. We will get a cleaner test in the next few inflation prints. If oil stays off its spring highs and tariff pass-through continues to fade, core goods inflation should decelerate even if AI-related equipment prices stay firm. If core goods refuse to cool while utilities, electrical equipment and nonresidential construction keep climbing, the network is still transmitting, and the case for looking through the next relative-price surprise gets weaker, not stronger.
The Week Ahead
Tuesday: August JOLTS job openings; the Conference Board’s Consumer Confidence Index for September.
Wednesday: Third estimate of second-quarter GDP; August core PCE inflation, the Fed’s preferred gauge and the last one before the October 27-28 meeting; ADP’s September private-payrolls estimate. What would move us: a core PCE reading materially above 3% would argue for pulling the hike forward from December.
Thursday: ISM Manufacturing PMI for September; August construction spending.
Friday: The September employment report, the last one before the October 27-28 meeting. What would move us: payroll growth holding near this year’s soft pace alongside a jobless rate that keeps falling would sharpen the labor-force argument above rather than resolve it; a clear reacceleration in hiring would call the whole thesis into question.
Watch for further Fed speakers testing Williams’ language on whether October or December carries the next hike, the Danish and Greenlandic parliamentary ratification timeline on the framework signed September 22, and whether Pakistan-Afghanistan and the Houthis’ inland push toward Taiz and Marib stay contained to their own fronts.
U.S. Economic & Financial Outlook
The table below carries our September 23 forecast vintage, updated to reconcile the curve against the Committee’s September 16 projections and this week’s sharp back-up in longer yields. The 10-year Treasury path for the second half of 2026 is now built around 5.10% rather than the roughly 4.40% we had penciled in five days earlier, and the 30-year mortgage path moves with it, closer to 7.00%-7.30% than the high-6% range in our prior vintage. The 2026 year-end funds-rate range we had built in, 4.00%-4.25%, is unchanged from our prior vintage and matches the Committee’s own median dot for year-end 2026; the repricing here is concentrated in the long end, not the policy path itself. That repricing also trims our 2027 growth and housing forecasts modestly and nudges the consumer-spending path lower within the year, the ordinary consequence of a higher discount rate working through the model.
U.S. Economic & Financial Outlook, as of September 23, 2026
| Indicator | Units | 2024 Actual | 2025 Actual | 2026 Forecast | 2027 Forecast | Q1-26 Actual | Q2-26 Actual | Q3-26 Fcst | Q4-26 Fcst | Q1-27 Fcst | Q2-27 Fcst | Q3-27 Fcst | Q4-27 Fcst |
|---|---|---|---|---|---|---|---|---|---|---|---|---|---|
| Output | |||||||||||||
| Real GDP | % q/q SAAR | 2.8 | 2.1 | 2.3 | 2.6 | 2.1 | 1.5 | 3.6 | 3.1 | 2.4 | 2.6 | 2.7 | 2.7 |
| 4th Qtr-to-4th Qtr Chg, Yr/Yr for Qtly Data | % YoY | 2.4 | 2.0 | 2.6 | 2.7 | 2.7 | 2.1 | 1.9 | 2.6 | 2.7 | 3.0 | 2.8 | 2.7 |
| Final Sales to Private Domestic Purchasers | % q/q SAAR | 3.0 | 2.6 | 2.7 | 2.9 | 1.7 | 4.2 | 4.5 | 3.9 | 3.6 | 3.3 | 3.2 | 3.2 |
| Consumer Spending | % q/q SAAR | 2.9 | 2.6 | 2.3 | 2.0 | 0.5 | 3.4 | 2.3 | 2.0 | 2.1 | 2.0 | 2.0 | 1.9 |
| Nonresidential Fixed Investment | % q/q SAAR | 2.9 | 4.1 | 6.2 | 4.6 | 10.6 | 8.5 | 9.0 | 7.7 | 6.6 | 5.9 | 5.7 | 5.4 |
| Residential Investment | % q/q SAAR | 3.2 | -2.2 | -1.8 | 0.5 | -7.8 | 0.0 | -3.8 | -1.3 | -0.5 | 0.4 | 0.8 | 1.2 |
| Industrial Production, Manufacturing | % YoY | -0.9 | 1.0 | 2.0 | 3.9 | 1.0 | 1.6 | 1.6 | 3.6 | 4.0 | 3.6 | 3.7 | 3.7 |
| Light Vehicle Sales | Mil. units, SAAR | 15.9 | 16.2 | 16.1 | 16.4 | 15.5 | 16.4 | 16.2 | 16.3 | 16.3 | 16.3 | 16.4 | 16.4 |
| Labor Market | |||||||||||||
| Unemployment Rate | % | 4.0 | 4.3 | 4.2 | 4.0 | 4.3 | 4.3 | 4.1 | 4.1 | 4.1 | 4.0 | 4.0 | 3.9 |
| Nonfarm Payrolls | Avg. mo. chg., thous. | 150 | 62 | 82 | 95.25 | 73 | 81 | 85 | 88 | 88 | 92 | 98 | 103 |
| Employment Cost Index | % YoY | 3.9 | 3.5 | 3.4 | 3.5 | 3.4 | 3.4 | 3.4 | 3.4 | 3.5 | 3.4 | 3.5 | 3.5 |
| Housing Market | |||||||||||||
| Housing Starts | Thous. units, SAAR | 1,370 | 1,356 | 1,354 | 1,370 | 1,418 | 1,337 | 1,320 | 1,340 | 1,350 | 1,370 | 1,380 | 1,380 |
| New Home Sales | Thous. units, SAAR | 684 | 679 | 636 | 665 | 622 | 650 | 630 | 640 | 650 | 660 | 670 | 680 |
| Existing Home Sales | Thous. units, SAAR | 4,060 | 4,060 | 4,076 | 4,188 | 4,043 | 4,120 | 4,040 | 4,100 | 4,150 | 4,180 | 4,200 | 4,220 |
| Case-Shiller National Home Prices | % YoY | 5.1 | 2.2 | 1.4 | 2.5 | 0.8 | 1.2 | 1.5 | 1.9 | 2.3 | 2.5 | 2.6 | 2.7 |
| Inflation | |||||||||||||
| Consumer Price Index (CPI) | % YoY | 3.0 | 2.6 | 3.3 | 2.7 | 2.7 | 3.8 | 3.4 | 3.2 | 3.0 | 2.3 | 2.6 | 2.6 |
| Core CPI | % YoY | 3.4 | 2.8 | 2.6 | 2.8 | 2.5 | 2.7 | 2.7 | 2.6 | 2.7 | 2.8 | 2.8 | 2.8 |
| PCE Deflator | % YoY | 2.6 | 2.6 | 3.3 | 2.8 | 3.1 | 3.9 | 3.2 | 3.0 | 2.9 | 2.5 | 2.7 | 2.7 |
| Core PCE Deflator | % YoY | 2.9 | 2.8 | 3.1 | 2.7 | 3.1 | 3.4 | 3.1 | 2.8 | 2.7 | 2.4 | 2.6 | 2.6 |
| Interest Rates & Markets | |||||||||||||
| Fed Funds Target Range | Avg./Range, % EOP | 5.14 | 4.21 | 3.63 | 4.06 | 3.50-3.75 | 3.50-3.75 | 3.75-4.00 | 4.00-4.25 | 4.25-4.50 | 4.25-4.50 | 4.25-4.50 | 4.25-4.50 |
| 2-Year Treasury | %, period end | 4.37 | 3.81 | 3.92 | 4.06 | 3.78 | 4.13 | 4.85 | 4.75 | 4.60 | 4.50 | 4.45 | 4.40 |
| 10-Year Treasury | %, period end | 4.21 | 4.29 | 4.74 | 4.89 | 4.35 | 4.40 | 5.10 | 5.10 | 5.00 | 4.90 | 4.85 | 4.80 |
| 30-Year Mortgage Rate | %, period end | 6.72 | 6.60 | 6.77 | 6.89 | 6.10 | 6.49 | 7.30 | 7.20 | 7.00 | 6.90 | 6.85 | 6.80 |
| Brent Crude | $/bbl, period avg. | 79.91 | 68.32 | 92.05 | 85.00 | 78.00 | 100.20 | 98.00 | 92.00 | 90.00 | 88.00 | 82.00 | 80.00 |
| Trade-Weighted Dollar Index | Period average | 122.9 | 122.7 | 119.1 | 119.9 | 119.0 | 119.5 | 119.3 | 118.8 | 119.1 | 119.6 | 120.3 | 120.6 |
| Trade-Weighted Dollar Index | % chg., period | 1.7 | -0.1 | -2.9 | 0.6 | -1.4 | 0.4 | -0.2 | -0.4 | 0.2 | 0.4 | 0.5 | 0.2 |
| Government, Trade & Inventories | |||||||||||||
| Government | % q/q SAAR | 3.8 | 1.1 | 0.0 | 1.2 | 4.4 | -1.0 | 2.4 | 1.8 | 1.5 | 1.3 | 1.1 | 1.1 |
| Net Exports | $ Bil., Chained 2017$ | -1,032.6 | -1,090.7 | -1,002.42 | -1,322.40 | -1,001.8 | -1,083.7 | -1,177.4 | -1,267.4 | -1,312.4 | -1,332.4 | -1,322.4 | -1,322.4 |
| Net Exports (percentage point impact) | Percentage points | -0.48 | 0.39 | -0.03 | -0.22 | -0.37 | -1.14 | -1.53 | -1.46 | -0.72 | -0.32 | 0.16 | 0.00 |
| Business Inventories | $ Bil., Chained 2017$ | 43.5 | 28.5 | -27.33 | 23.13 | -16.7 | -53.1 | 70.1 | 40.0 | 20.0 | 22.5 | 25.0 | 25.0 |
| Inventories (percentage point impact) | Percentage points | -0.17 | -0.21 | -0.12 | -0.06 | 0.23 | -0.72 | 1.93 | -0.41 | -0.16 | -0.12 | 0.04 | 0.00 |
Annual figures are full-year averages or year-over-year percent changes; 2024-2025 are actual, 2026-2027 are forecasts. Q1-26 and Q2-26 are the latest actuals. Source: Piedmont Crescent Capital, BLS, BEA, Census, Federal Reserve, EIA.
Sources and Notes
Sources. Bureau of Labor Statistics (Consumer Price Index; Initial Jobless Claims); U.S. Census Bureau (Advance Monthly Retail Trade; New Residential Construction; Advance Durable Goods); Federal Reserve Bank of New York (President Williams remarks, National Institute of Economic and Social Research conference, London, September 24, 2026; Empire State Manufacturing Survey, September 2026); Federal Reserve Bank of Philadelphia (Manufacturing Business Outlook Survey, September 2026); U.S. Treasury (5-year Treasury note auction results, September 23, 2026); Federal Reserve Bank of Chicago (National Activity Index); S&P Global (flash U.S. Composite, Manufacturing and Services PMI, September 2026); University of Michigan (Surveys of Consumers, final September 2026); Freddie Mac (Primary Mortgage Market Survey, week ended September 24, 2026); U.S. Bureau of Economic Analysis (GDP and Personal Income and Outlays release schedule); Cleveland Fed / European Central Bank (Inflation: Drivers and Dynamics conference, September 24-25, 2026, remarks of Beth Hammack and Boris Vujčić); European Central Bank (September 2026 macroeconomic projections).
Geopolitical. White House and NPR (President Trump’s UN General Assembly address, September 22, 2026); Al Jazeera, CNBC, CBS News and NPR (US-Denmark-Greenland framework signing and terms, September 22); Al Jazeera and NPR (Trump-Xi meeting, September 23-25, and the Busan trade truce extension); Al Jazeera and Reuters (Pakistan-Afghanistan border escalation, September 23-24); Reuters (Houthi missile attacks on Taif and Yanbu, Saudi Arabia, September 24); CNN (Houthi inland offensive toward Taiz and Marib, September 21); Rigzone and Bloomberg (Ukrainian strikes on the Perm and Novoshakhtinsk refineries, September 25); Reuters (Russia’s fuel-export bans, in force since summer 2026); Politico and the White House (reported and denied U.S. diesel-export restriction proposal, September 23).
Market data as of Friday, September 25, 2026 close, unless noted: TheStreet and EnergyNow (equity indices, Treasury yields, Brent and WTI); AAA (retail gasoline and diesel); USAGOLD (precious metals); TradingEconomics and CNBC (ICE U.S. Dollar Index, DXY, including week-over-week performance).
A View from the Piedmont is published weekly by Piedmont Crescent Capital for informational purposes only and does not constitute investment, legal, or tax advice. Views expressed are those of the author as of the date of publication and are subject to change. © 2026 Piedmont Crescent Capital, LLC. All rights reserved.