
A View from the Piedmont — Our Weekly Commentary on Money, Credit, Exchange Rates & Geopolitics
One Hike, Four Fronts
The Fed moved for the first time since 2023. So did geopolitics: Yemen, Ukraine and Pakistan turned more negative, while an agreement among the U.S., Denmark and Greenland looks set to clear this week on good terms for all sides.
Editor’s note: This issue covers the full data slate released since our last edition, the Federal Reserve’s September 16 decision, and a geopolitical scan across four fronts we think investors are underpricing individually and mispricing as a group. The house forecast table carries our September 18 vintage, reconciled below against our call, and the Committee’s new dot plot appears in full in This Week’s Argument.
Market Dashboard
| Rates & Credit | Rates & Credit | Equities & Commodities | Equities & Commodities |
|---|---|---|---|
| Fed funds target range | 3.75%-4.00% (hiked Sept 16) | S&P 500 | 7,650.50 (+0.17% Fri) |
| 10-yr Treasury | 5.01% (Fri close) | Dow Jones | 51,682.64 (-0.18% Fri) |
| 30-yr mortgage | 6.95% (Freddie Mac, Sept 17) | Nasdaq Composite | 26,522.55 (+0.39% Fri) |
| 2-yr Treasury | 4.76% (Fri close, highest since June 2024) | 30-yr Treasury | 5.34% (Fri close) |
| 2s-10s spread | 25 bp | 2s-30s spread | 58 bp |
| IG credit OAS | 78 bp (ICE BofA, Sept 17) | HY credit OAS | 270 bp (ICE BofA, Sept 17) |
| Brent crude (Nov) | $104.33 (+0.3% Fri, +12% on the month) | Russell 2000 | -0.50% Fri (rate-sensitive small caps lagged) |
| Retail diesel | above $6.00/gal | Gold (Dec) | $4,368.60 (+0.6% Fri) |
| Core CPI (Aug, y/y) | 2.4% (core goods +0.1% m/m) | Silver | $67.18 (+3.0% Fri) |
| Initial jobless claims (wk ended 9/13) | 196,000 | Conference Board LEI (Aug) | 99.5 (-0.1% m/m) |
Treasury yields are the official daily par yield curve for Friday, September 18; the 2s-10s and 2s-30s spreads are computed from those par yields. Credit spreads are ICE BofA option-adjusted spreads through Thursday, September 17, the latest published. The mortgage rate is the Freddie Mac PMMS survey for the week ended September 17.
Summary
- The Committee raised the federal funds target range a quarter point to 3.75%-4.00% on September 16, the first hike since 2023, on a unanimous 12-0 vote. Our own technical rule, built on core CPI and core goods breadth, said hold: August core CPI cleared our 0.3% threshold but core goods rose just 0.1%, a quarter of the 0.4% bar the rule required. The dot plot itself shows just two members who see September as the last hike against sixteen who expect at least one more. We are going a quarter point further than the median: at least two more quarter-point increases, with a terminal rate of 4.25%-4.50% or higher by the end of next year.
- Last week’s full data slate was consistent with an economy expanding solidly albeit unevenly. Retail sales rose 1.2% in August, control-group sales rose 1.4%, and utilities output rose 6.2% over the year, the fastest-growing line in the industrial report and the clearest evidence yet of the capital-intensity theme we have carried all year.
- Four geopolitical fronts moved in the same week the Fed did, and we think markets are treating them as separate stories when they add up to one. A bombing in Kohat, Pakistan reopened its border conflict with the Afghan Taliban; the Houthis consolidated control of Yemen’s Red Sea coast; Ukraine struck the Moscow oil refinery itself; and the US and Denmark announced a Greenland framework we called in January. None is a US recession risk on its own. Together they are a standing bid under energy prices and the dollar at the exact moment the Fed has told us it isn’t done.
- Our call: pause October 27-28, hike December 9 to 4.00%-4.25%, and at least one more quarter-point increase in 2027 to a terminal 4.25%-4.50% or higher. That call goes a quarter point past the Committee’s own median dot, and it is ceteris paribus: it assumes the four fronts above do not escalate further.
This Week’s Argument
The rule said hold. The Committee said credibility.
Two weeks ago we set ourselves an explicit test for the September meeting: hike if core CPI cleared 0.3% month over month and core goods cleared 0.4%, hold otherwise. August’s report cleared the first bar. Core goods rose just 0.1%, a quarter of the 0.4% bar the rule required, a reading Oxford Economics’ independent core-goods tracker corroborated. On that test alone, the case for a hold was not close, and we said so in our last issue.
The Committee hiked anyway, 25 basis points to 3.75%-4.00%, unanimously. We think the credibility explanation is the right one, even though it is not what set our framework: a Committee that spent a month guiding markets toward a hike, and watched CME-implied odds run from 58% to roughly 90% over the following week, had more to lose from disappointing a fully-priced market than from a marginal miss on core-goods breadth. That is a credibility argument, not a data argument, and it beat our data-driven rule.
The new Summary of Economic Projections tells us the Committee is not finished. The median dot now shows the funds rate at 4.1% at both the end of 2026 and the end of 2027, 3.9% in 2028, 3.6% in 2029, and 3.2% longer run, all up from June’s projections of 3.8%, 3.6%, 3.4% and 3.1%. Core PCE inflation is projected at 3.4% this year, easing to 2.5% in 2027, 2.2% in 2028 and 2.0% in 2029. GDP growth is projected at 2.3% this year and 2.4% next, and unemployment is expected to hold near 4.1% through 2028. The dot plot below shows only two members who consider Wednesday the last increase; twelve see one more move before year-end and four see two. A Committee that just hiked, with sixteen of eighteen members penciling in at least one further move, is not a Committee we would call finished.
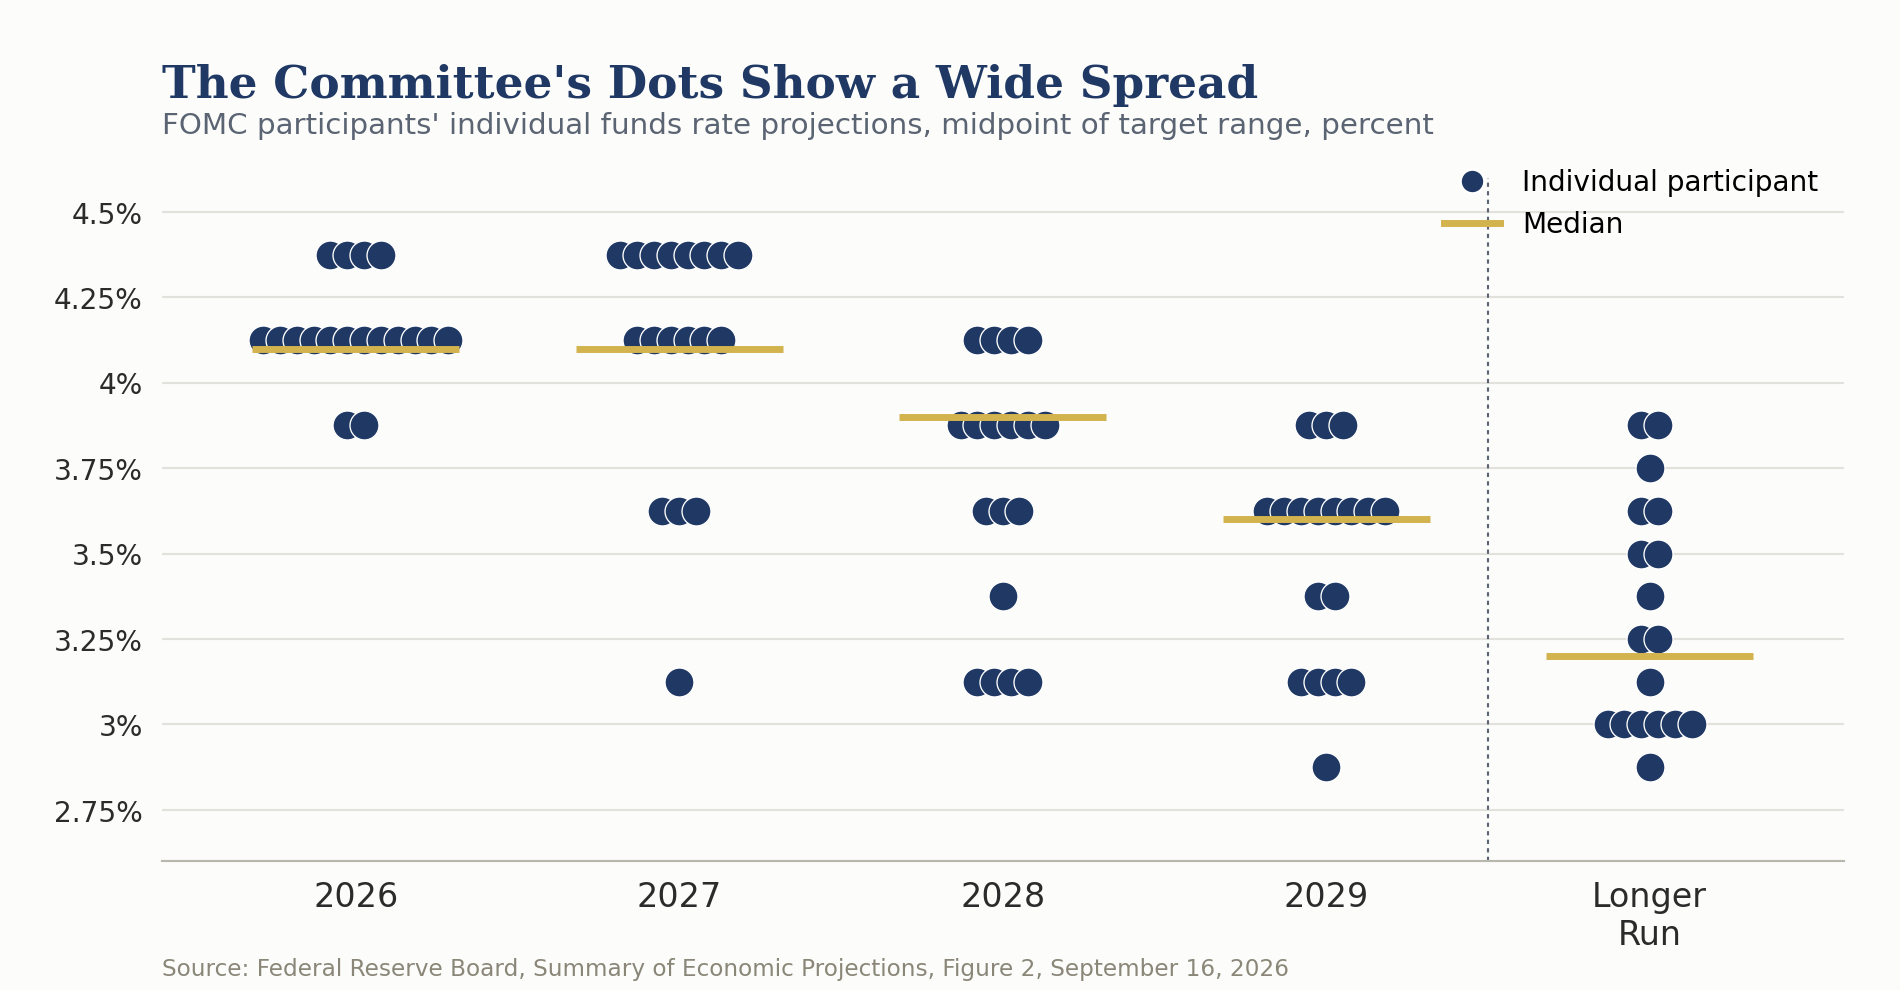
Our own call goes a quarter point further than the median: at least two more quarter-point increases, one later this year and at least one more in 2027, with a terminal rate of 4.25%-4.50% or higher by the end of next year. We think the near-term move lands at the December 9 meeting rather than October 27-28, on the same election-proximity logic that argued for an October pause even before Wednesday’s decision reshaped the path. Every dot on that plot, and every word of this call, is ceteris paribus. Something else always changes, and something else already has: Brent above $104, retail diesel above $6, a mosque bombing in Pakistan, and a Red Sea chokepoint drifting toward one armed faction’s control were not among the assumptions built into the September 16 projections.
Markets took the hike in stride. The S&P 500 closed the week at 7,650.50, up 0.17% on Friday, and the Nasdaq added 0.39% to 26,522.55, while the Dow slipped 0.18% to 51,682.64 and the Russell 2000 underperformed, down half a percent as smaller, more rate-sensitive balance sheets absorbed the higher-for-longer message first. The 10-year Treasury finished the week near 5.00%. Gold still rallied to $4,368.60, up 0.6% on Friday, as a late-week pullback in crude pulled real yields down even as the Fed tightened, a reminder that the inflation-adjusted rate, not the headline funds rate, is what moves the metal.
Four fronts, not four headlines
We have covered Pakistan’s border conflict with Afghanistan, Houthi expansion in the Red Sea, and Ukraine’s campaign against Russian energy infrastructure separately in past issues. This week we think they, and Greenland, belong in the same paragraph, because each is a version of the same underlying story: state authority fraying at a frontier, a chokepoint, or a resource claim, in four different regions at once.
Pakistan and Afghanistan. A suicide bomber struck inside the Kohat Police Lines compound during Friday prayers on September 18, killing police officers and civilians in a toll that different outlets put between roughly 20 and 30 in the attack’s first day and that is still moving as the count is finalized. A local group calling itself Ittehad-ul-Mujahideen Pakistan claimed responsibility, while the better-known Tehreek-e-Taliban Pakistan denied involvement. Islamabad’s response went straight at Kabul: the attackers had “roots in Afghanistan,” the Afghan Taliban regime “actively sponsors terrorism in Pakistan,” and its failure to act violates the 2020 Doha framework that obligated Afghan territory not be used against Pakistan. This follows a February and March stretch in which the two governments traded actual airstrikes and border clashes and each called the result open war. With the U.S. still absorbed by the war with Iran, first joined militarily in February and not yet concluded, we think Washington has less bandwidth than usual to manage a frontier dispute like this one, and similar flashpoints are more likely to surface elsewhere while that holds. A nuclear-armed state of roughly 250 million people escalating with an isolated, sanctions-bound neighbor is not, by itself, a market event. It is the kind of frontier-authority story that shows up first in reinsurance pricing and supply-chain routing around South Asia, and only later, if it escalates further, in a headline that moves financial markets.
The Red Sea. The Houthis have consolidated control over Yemen’s Red Sea coastline, including the port of Hodeidah and a string of islands, cementing their position astride the approach to the Bab al-Mandeb strait. Their targeting has widened from Israeli and US-linked shipping earlier this year to vessels and infrastructure connected to Saudi Arabia. Yemen’s anti-Houthi coalition has fractured further instead of consolidating in response, trading blame instead of coordinating. We think this is a meaningfully different risk than the episodic missile exchanges of 2024. An attack on a shipping lane is an insurance problem, priced ship by ship. A chokepoint under one faction’s durable control is a standing tax on the route, present in freight rates and crude time spreads whether or not a vessel is hit in a given week, and it is a real part of why Brent has held above $100 through a month with few other fresh bullish catalysts.
Ukraine and Russian energy. Ukraine struck the Yaroslavl refinery, roughly 15 million tons of annual processing capacity and one of Russia’s larger plants, along with a military airfield near Rostov-on-Don, on September 17. Overnight September 19-20, in what Moscow officials called the year’s largest drone attack on the capital, Ukraine reached the Moscow oil refinery itself, in the city’s Kapotnya district, a plant that processed 11.6 million tons of crude in 2024; the wider attack killed three people in the Moscow region and forced roughly 400 residents from a damaged apartment tower in Ramenskoye. Open-source tracking of the broader campaign now puts two Rosneft refineries, at Syzran and Saratov, fully offline, with three of Russia’s six largest diesel plants shut down or running near a quarter of capacity. This is a targeted campaign against Russia’s refining base specifically, layered on top of a Russian domestic fuel crisis now stretching across two winters. The read-through for us is less about Brent, where global spare capacity has absorbed the loss of Russian refined-product exports reasonably well, and more about the diesel crack, already the tightest margin in the energy complex this year and now facing another marginal buyer looking to replace barrels that used to come from Russia.
Greenland. On September 19, the United States and Denmark announced a framework agreement expanding the American military footprint in Greenland beyond the existing Pituffik Space Base, while both governments emphasized that Danish sovereignty and Greenlandic self-determination remain intact. The framework bars non-NATO bases on the island and blocks Chinese or Russian investment and installations. All three governments are expected to sign formally at the UN General Assembly this month, pending ratification by the Danish and Greenlandic parliaments. This is close to what we argued would happen in “Trump’s Greenland Gambit: The Panama Canal Lesson America Forgot”, published in this newsletter on January 26, when we compared Washington’s approach to the 1999 Panama Canal handover, where formal US withdrawal left a strategic vacuum that Chinese capital filled through ports, logistics and financing rather than through force. Our case then was that “Ownership has been replaced by control. Purchase has been replaced by permanence. Strategic drift has been replaced by alignment,” built on three pillars we can now see in this week’s announcement: a locked-in, permanent US military footprint, an effective American veto over foreign infrastructure and investment decisions, and preferred access for allied firms in resource development, all without a formal change in sovereignty. That is a fair description of what got announced this week. The question we raised in January, whether formal sovereignty is enough protection against a patient strategic competitor when it isn’t backed by permanence on the ground, is the same one Danish and Greenlandic lawmakers are now being asked to answer by ratifying it.
Taken as a group, none of these four is, by itself, a threat to US growth. Together they put a standing bid under energy prices and under the dollar’s safe-haven role at the exact moment the Federal Reserve has told us it intends to keep raising rates.
More power, less output, and the labor market holding the line
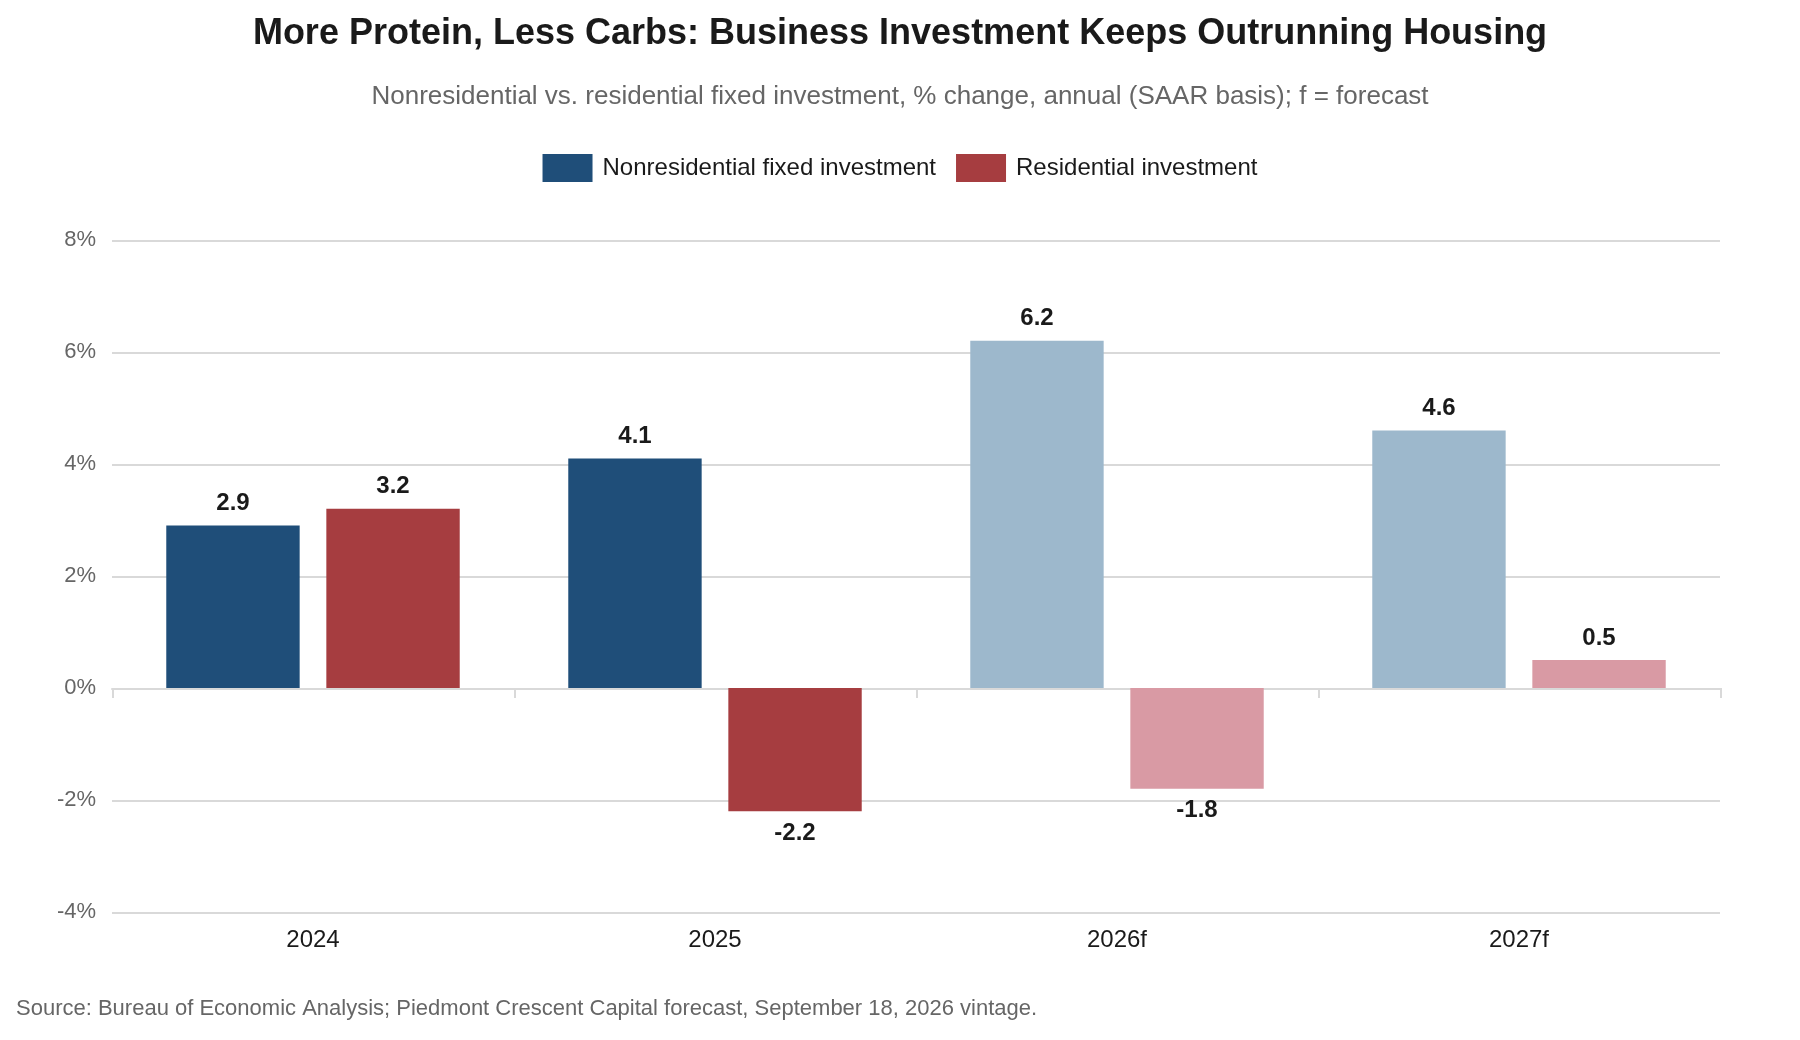
The rest of last week’s data slate is consistent with an economy that is still capital intensive, and last week’s numbers restated that pattern rather than revised it. Retail sales rose 1.2% in August against an 0.8% consensus, and the control group, the cut that excludes autos, gasoline, building materials and food service and maps most closely to the consumer-spending line in GDP, rose 1.4%. Those non-core items feed into the GDP calculation in other ways, so they are not excluded from our analysis. Building materials sales feed into the calculation for residential investment, which remains soft. Housing starts fell 2.6% on the month to a 1.275 million unit annual rate, with single-family holding up better than multifamily; permits told a similar story, down 2.7% on the month but up 3.5% over the year, with multifamily permits at 467,000 suggesting builders are still committing to rental supply even as for-sale demand softens at the margin. Part of the strength in apartment building reflects would-be homeowners remaining renters for longer. Completions, which reflect decisions made twelve to eighteen months ago, fell 11.9% on the month and 27.1% over the year, the sharpest move in the report and a lagging signal.
Industrial production was unchanged in August and manufacturing output slipped 0.3%, with capacity utilization at 76.3%, more than three points below its long-run average; there is real slack in the factory sector, and it is a meaningful reason the Committee does not see the revival in manufacturing as an inflation risk even while it raises rates elsewhere. Utilities output rose 1.8% on the month and 6.2% over the year, easily the fastest-growing line in the report and the plainest evidence of the capital-intensity story: the fastest-growing part of industrial production is the part that exists to power everything else, principally data centers and the broader electrification of business investment.
The two regional manufacturing surveys disagreed on direction and agreed on the labor market. The Philadelphia Fed’s index rose to 37.8 in September, well above the 30.5 consensus. The Empire State survey fell to 7.6 from 20.6 in August, with new orders holding narrowly positive at 2.0 but shipments slipping negative. Both surveys’ employment components stayed constructive, with Empire State’s employee count index rising to 10.6 and hours worked jumping to 17.0. Two regional surveys moving in opposite directions while both point to steady hiring reads more like a plateau than a turn in either direction. Initial jobless claims came in at 196,000 for the week ended September 13, still historically low. The Conference Board’s Leading Economic Index fell 0.1% in August to 99.5, its first monthly decline since March, with the six-month growth rate turning slightly negative; the Board trimmed its own 2027 GDP forecast to 1.8% from 1.9%, a soft revision, not an alarming one, and one more data point for a labor market and a consumer holding up better than the leading indicators suggest they eventually will.
Behind the Numbers
Retail sales’ control-group reading rose 1.4% in August, the cleanest read of underlying consumer demand in the report, and it came with a caveat worth keeping. It strips out the categories, autos, gasoline, building materials and food service, that swing on price and financing terms, not volume. Reuters’ own reporting on the release credited steady wage growth and recent stock market gains for the strength, but also noted consumers are becoming more selective and searching out lower-priced goods even as they spend more in aggregate. That is a consumer still willing to spend, not a consumer spending without discipline, and it is the more durable version of resilience.
Housing completions are a rearview mirror, and the mirror is showing a decision made under different conditions. A unit reflected in this month’s completions data typically broke ground twelve to eighteen months earlier, which places the projects finishing now squarely in the high-rate stretch of 2025. The 11.9% monthly and 27.1% annual declines in completions say more about builder caution then than about demand now. The more forward-looking number in the same report, multifamily permits at 467,000, tells a different story: builders are still willing to commit to new rental supply even as the for-sale, single-family segment cools at the margin, which is the right read for anyone financing or supplying that pipeline.
Slack in the factory floor, none in the power grid, and that asymmetry is doing real work in the Fed’s own reaction function. Capacity utilization at 76.3%, more than three points below its long-run average, is a big part of why the Committee can raise rates without worrying that it is choking off manufacturing capacity that’s already running hot; there is room to spare. Utilities output growing at 6.2% year over year, in the same report, is the opposite condition: demand for power, driven by data centers and the broader capital-intensity buildout, is running well ahead of the rest of industrial production, and grid capacity, unlike factory capacity, is not something that can be brought back online with a few weeks’ notice.
Bottom Line
We now expect the Committee to pause at the October 27-28 meeting and deliver a second quarter-point hike on December 9, taking the funds rate to 4.00%-4.25% by year-end, and expect at least one further quarter-point increase in 2027 carrying the terminal rate to 4.25%-4.50% or higher. That call goes a quarter point past the Committee’s own median dot, and it is ceteris paribus in the fullest sense: it assumes the four geopolitical fronts above do not escalate further or allow even more flashpoints to emerge. If any of them do, a wider Pakistan-Afghanistan exchange, a Houthi move to fully close Bab al-Mandeb rather than tax it, or a sharper jump in Brent or the diesel crack from further Ukrainian strikes, we think the risk runs toward an earlier or larger move, not a smaller one, since all three would show up first as energy-price and dollar pressure, the two channels most likely to move this Committee. Check this against how Chair Warsh frames the neutral-rate question in October, since there is no Summary of Economic Projections at that meeting, and against the vote count and new projections on December 9 itself.
A personal note. A little over three years ago, a friend recommended that I read The End of the World is Just the Beginning. The author’s central thesis was that as the day America could guarantee freedom of navigation around the world was drawing to an end, a new system of toll takers would likely emerge. I thought the book was well written but questioned why he felt the U.S. Navy would become so much less effective. The book turned out to be a timely read and the timetable for challenges to the post-World War II protection of the world’s sea lanes has clearly come into question. The book is still a timely read and well worth the time and effort.
CFO and Treasurers Corner
Stop planning around a near-term cut. Funding costs now have a floor near 4.00%-4.25% by year-end and higher in 2027 under our call. Lock in financing decisions against that path, not a hoped-for easing.
Budget the diesel crack above $6, not the barrel. The marginal driver is refining capacity lost to Ukrainian strikes and Houthi chokepoint risk, not global crude supply and demand. Hedge the crack spread specifically where distillate exposure is material.
Reassess Red Sea and Suez routing insurance now, not after the next incident. Houthi consolidation of Yemen’s Red Sea coast is a standing cost on that route, not an episodic one. Compare current premiums against Cape of Good Hope routing economics for any shipment where the math was close before.
Widen dollar hedge ratios on international receivables. A Fed that has told markets it intends to keep raising rates, against central banks elsewhere that are further along in easing, argues for a firmer dollar over the near term. Revisit hedge ratios set before September 16.
Treat grid interconnection and power capacity as a line item in any project with material electricity load. Utilities output is growing at more than six times the pace of the rest of industrial production. Capacity charges and curtailment terms belong in the underwriting, not as an afterthought.
Read the housing completions plunge as a lagging signal, not a forward one, when assessing exposure to that sector. Multifamily permits at 467,000 are the better forward indicator, and they still show builders committing to new supply. Higher mortgage rates are likely to persist throughout the forecast period. Yet we still see a modest recovery in existing home sales next spring and summer, driven by a steady decline in asking prices in major markets.
Piedmont Perspective
The Committee Signals One, We Expect Two
Abridged from the standalone essay published September 16.
The Federal Reserve raised its target range a quarter point to 3.75%-4.00% on September 16, its first increase since 2023, on a unanimous 12-0 vote. The decision itself was less informative than what came with it: a Summary of Economic Projections whose median dot now shows the funds rate ending this year at 4.1%, not 3.75%-4.00%, which means the median Committee member expects at least one more increase before December 31.
The new projections moved in one direction across the board. The funds rate path rose to 4.1% in 2026 and 2027, 3.9% in 2028, 3.6% in 2029 and 3.2% longer run, up from June’s 3.8%, 3.6%, 3.4% and 3.1%. Core PCE inflation is now projected at 3.4% this year before easing to 2.5%, 2.2% and 2.0% over the following three years. GDP growth is projected at 2.3% this year and 2.4% next, with unemployment expected to hold near 4.1% through 2028 before settling at 4.2% longer run. None of these are dramatic revisions individually. Together, they describe a Committee that raised rates and simultaneously told markets it isn’t finished, which is a more hawkish combination than either action would be alone.
The dot plot above shows the same distribution behind the median: two members consider September the last increase, twelve see one more move before year-end, and four see two. A Committee where fourteen of eighteen members expect at least one further hike is not a Committee signaling completion, whatever the headline vote count implied on the day. We take the Committee at its word and go a quarter point past its own median: at least two more quarter-point increases from here, one later this year and at least one more in 2027, with a terminal rate of 4.25%-4.50% or higher by the end of next year.
Every projection in that plot, and every word of our own call, carries the same caveat: it is ceteris paribus. Every dot assumes conditions the Committee cannot actually hold constant, and several of them have already moved since September 16. Brent crude has traded above $104, retail diesel above $6, a chokepoint in the Red Sea has drifted toward the control of a single armed faction, and a Pakistani mosque bombing has reopened a border conflict Islamabad and Kabul were already calling open war. None of these appear in the Committee’s own projections, because none of them are the Committee’s job to project. They are ours, and they are why our confidence in the near-term timing of the next move, October 27-28 or December 9, is lower than our confidence in the direction.
Full essay, “The Committee Signals One, We Expect Two”, published September 16, 2026, is available at piedmontcrescentcapital.com.
The Week Ahead
Monday: Chicago Fed National Activity Index.
Tuesday: Conference Board Consumer Confidence; flash S&P Global manufacturing and services PMIs.
Wednesday: New home sales.
Thursday: Initial jobless claims; durable goods orders; final estimate of second-quarter GDP.
Friday: August core PCE inflation, the Fed’s preferred gauge and the last one before the October 27-28 meeting; final University of Michigan consumer sentiment.
With the post-meeting blackout lifted, watch for the first round of Fed speeches since September 16 for how individual Committee members, Governor Waller in particular, characterize both the vote itself and the neutral-rate question that will shape whether October is genuinely a pause or a bridge to a larger December move. We expect a handful of regional Fed presidents to push for an October increase, which we read as more of a political endeavor than economic one.
The diplomatic calendar carries its own asymmetry this week. The UN General Assembly’s high-level week runs September 21-25 in New York, with President Trump addressing the Assembly Tuesday. Xi Jinping is skipping the Assembly itself and meeting Trump one-on-one at the White House on Thursday, September 24, with artificial intelligence, Iran-related sanctions, tariffs and Taiwan all on the agenda. Most coverage of the summit describes it as closer to a state visit than a negotiation, with limited concrete outcomes expected. We think that sets a low bar: with expectations already discounted, the asymmetry favors an upside surprise on trade or AI cooperation over a disappointment, the diplomatic mirror of a Fed decision the market had already priced to roughly 90%.
U.S. Economic & Financial Outlook
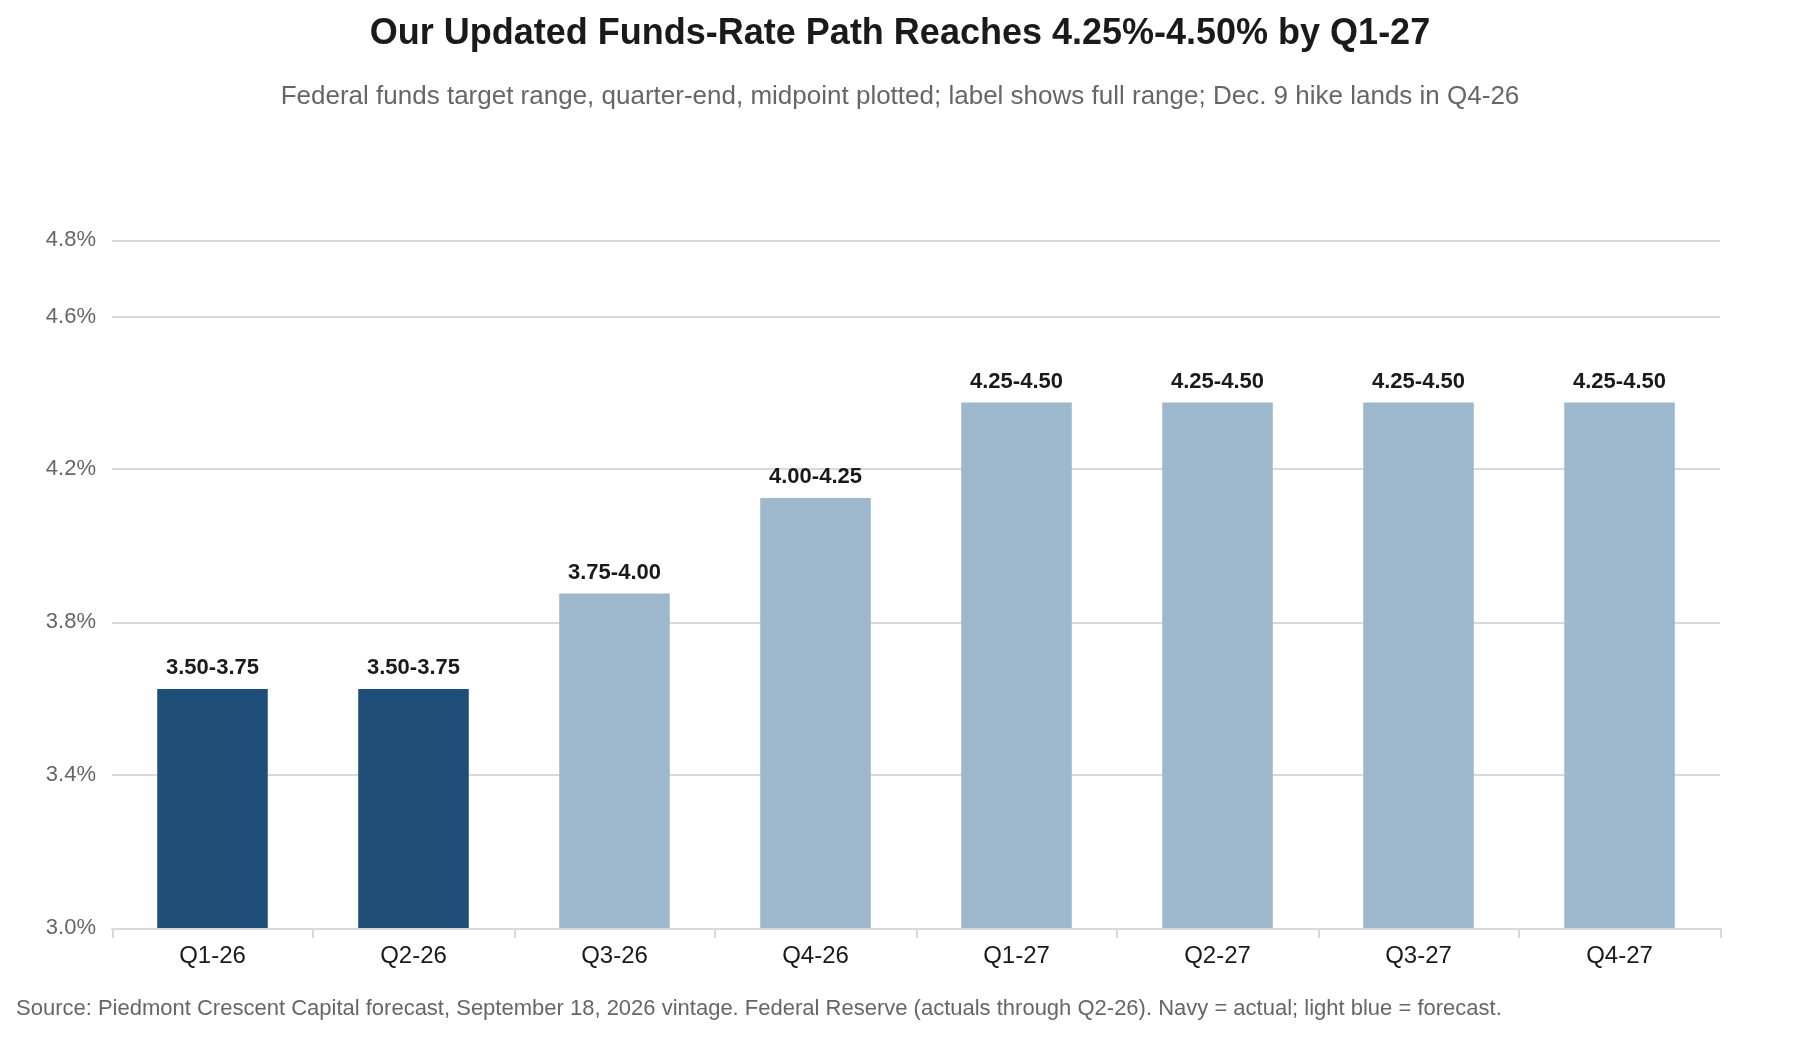
The table below carries our September 18 forecast vintage. The quarterly funds-rate path now carries 3.75%-4.00% through Q3-26, 4.00%-4.25% in Q4-26, consistent with the December 9 hike in our call above, and 4.25%-4.50% from Q1-27 through year-end 2027, consistent with the additional 2027 increase we call for in the text above. The two are now aligned; we are not carrying a further move beyond that path at this vintage.
U.S. Economic and Financial Outlook, as of September 18, 2026: annual
| Indicator | Units | 2024 Actual | 2025 Actual | 2026 Forecast | 2027 Forecast |
|---|---|---|---|---|---|
| Output | |||||
| Real GDP | % q/q SAAR | 2.8 | 2.1 | 2.3 | 2.7 |
| 4th Qtr-to-4th Qtr Change, Yr/Yr Chg for Qtly Data | % YoY | 2.4 | 2.0 | 2.6 | 2.7 |
| Final Sales to Private Domestic Purchasers | % q/q SAAR | 3.0 | 2.6 | 2.7 | 2.9 |
| Consumer Spending | % q/q SAAR | 2.9 | 2.6 | 2.3 | 2.0 |
| Nonresidential Fixed Investment | % q/q SAAR | 2.9 | 4.1 | 6.2 | 4.6 |
| Residential Investment | % q/q SAAR | 3.2 | -2.2 | -1.8 | 0.5 |
| Industrial Production, Manufacturing | % YoY | -0.9 | 1.0 | 2.0 | 3.9 |
| Light Vehicle Sales | Mil. units, SAAR | 15.9 | 16.2 | 16.1 | 16.4 |
| Labor Market | |||||
| Unemployment Rate | % | 4.0 | 4.3 | 4.2 | 4.0 |
| Nonfarm Payrolls | Avg. mo. chg., thous. | 150 | 62 | 82 | 95.25 |
| Employment Cost Index | % YoY | 3.9 | 3.5 | 3.4 | 3.5 |
| Housing Market | |||||
| Housing Starts | Thous. units, SAAR | 1,370 | 1,356 | 1,354 | 1,375 |
| New Home Sales | Thous. units, SAAR | 684 | 679 | 636 | 668 |
| Existing Home Sales | Thous. units, SAAR | 4,060 | 4,060 | 4,076 | 4,205 |
| Case-Shiller National Home Prices | % YoY | 5.1 | 2.2 | 1.4 | 2.5 |
| Inflation | |||||
| Consumer Price Index (CPI) | % YoY | 3.0 | 2.6 | 3.3 | 2.7 |
| Core CPI | % YoY | 3.4 | 2.8 | 2.6 | 2.8 |
| PCE Deflator | % YoY | 2.6 | 2.6 | 3.3 | 2.8 |
| Core PCE Deflator | % YoY | 2.9 | 2.8 | 3.1 | 2.7 |
| Interest Rates & Markets | |||||
| Fed Funds Target Range | Avg. / range, % EOP | 5.14 | 4.21 | 3.63 | 4.06 |
| 2-Year Treasury | %, period end | 4.37 | 3.81 | 3.92 | 4.06 |
| 10-Year Treasury | %, period end | 4.21 | 4.29 | 4.65 | 4.83 |
| 30-Year Mortgage Rate | %, period end | 6.72 | 6.60 | 6.66 | 6.83 |
| Brent Crude | $/bbl, period avg. | 79.91 | 68.32 | 92.05 | 84.50 |
| Trade-Weighted Dollar Index | Period average | 122.9 | 122.7 | 119.0 | 119.6 |
| Trade-Weighted Dollar Index | % chg., period | 1.7 | -0.1 | -3.0 | 0.5 |
Annual figures are full-year averages or year-over-year percent changes; the 2024-2025 columns are actual, 2026-2027 are forecasts.
U.S. Economic and Financial Outlook, as of September 18, 2026: quarterly
| Indicator | Q1-26 | Q2-26 | Q3-26 | Q4-26 | Q1-27 | Q2-27 | Q3-27 | Q4-27 |
|---|---|---|---|---|---|---|---|---|
| Output | ||||||||
| Real GDP | 2.1 | 1.5 | 3.6 | 3.1 | 2.5 | 2.7 | 2.8 | 2.7 |
| 4th Qtr-to-4th Qtr Change, Yr/Yr Chg for Qtly Data | 2.7 | 2.1 | 1.9 | 2.6 | 2.7 | 3.0 | 2.8 | 2.7 |
| Final Sales to Private Domestic Purchasers | 1.7 | 4.2 | 4.5 | 3.9 | 3.7 | 3.4 | 3.3 | 3.2 |
| Consumer Spending | 0.5 | 3.4 | 2.3 | 2.0 | 2.2 | 2.1 | 2.1 | 2.0 |
| Nonresidential Fixed Investment | 10.6 | 8.5 | 9.0 | 7.7 | 6.6 | 5.9 | 5.7 | 5.4 |
| Residential Investment | -7.8 | 0.0 | -3.8 | -1.3 | -0.5 | 0.4 | 0.8 | 1.2 |
| Industrial Production, Manufacturing | 1.0 | 1.6 | 1.6 | 3.6 | 4.0 | 3.6 | 3.7 | 3.7 |
| Light Vehicle Sales | 15.5 | 16.4 | 16.2 | 16.3 | 16.3 | 16.3 | 16.4 | 16.4 |
| Labor Market | ||||||||
| Unemployment Rate | 4.3 | 4.3 | 4.1 | 4.1 | 4.1 | 4.0 | 4.0 | 3.9 |
| Nonfarm Payrolls | 73 | 81 | 85 | 88 | 88 | 92 | 98 | 103 |
| Employment Cost Index | 3.4 | 3.4 | 3.4 | 3.4 | 3.5 | 3.4 | 3.5 | 3.5 |
| Housing Market | ||||||||
| Housing Starts | 1,418 | 1,337 | 1,320 | 1,340 | 1,360 | 1,380 | 1,380 | 1,380 |
| New Home Sales | 622 | 650 | 630 | 640 | 650 | 660 | 680 | 680 |
| Existing Home Sales | 4,043 | 4,120 | 4,040 | 4,100 | 4,160 | 4,190 | 4,220 | 4,250 |
| Case-Shiller National Home Prices | 0.8 | 1.2 | 1.5 | 1.9 | 2.3 | 2.5 | 2.6 | 2.7 |
| Inflation | ||||||||
| Consumer Price Index (CPI) | 2.7 | 3.8 | 3.4 | 3.2 | 3.0 | 2.3 | 2.6 | 2.6 |
| Core CPI | 2.5 | 2.7 | 2.7 | 2.6 | 2.7 | 2.8 | 2.8 | 2.8 |
| PCE Deflator | 3.1 | 3.9 | 3.2 | 3.0 | 2.9 | 2.5 | 2.7 | 2.7 |
| Core PCE Deflator | 3.1 | 3.4 | 3.1 | 2.8 | 2.7 | 2.4 | 2.6 | 2.6 |
| Interest Rates & Markets | ||||||||
| Fed Funds Target Range | 3.50-3.75 | 3.50-3.75 | 3.75-4.00 | 4.00-4.25 | 4.25-4.50 | 4.25-4.50 | 4.25-4.50 | 4.25-4.50 |
| 2-Year Treasury | 3.78 | 4.13 | 4.40 | 4.40 | 4.40 | 4.35 | 4.35 | 4.30 |
| 10-Year Treasury | 4.35 | 4.40 | 4.95 | 4.90 | 4.85 | 4.85 | 4.80 | 4.80 |
| 30-Year Mortgage Rate | 6.10 | 6.49 | 7.10 | 6.95 | 6.85 | 6.85 | 6.80 | 6.80 |
| Brent Crude | 78.00 | 100.20 | 98.00 | 92.00 | 90.00 | 88.00 | 82.00 | 78.00 |
| Trade-Weighted Dollar Index | 119.0 | 119.5 | 119.1 | 118.5 | 118.8 | 119.3 | 120.0 | 120.3 |
| Trade-Weighted Dollar Index | -1.4 | 0.4 | -0.4 | -0.5 | 0.3 | 0.4 | 0.5 | 0.2 |
Quarterly figures are seasonally adjusted annual rates, year-over-year changes where the units say so, or period averages and period-end levels for rates. The second-quarter 2026 column is the latest actual. Source: Piedmont Crescent Capital, BLS, BEA, Census, Federal Reserve, EIA.
Sources and Notes
Sources. Bureau of Labor Statistics (Consumer Price Index); U.S. Census Bureau (Advance Monthly Retail Trade, New Residential Construction); Federal Reserve Board (FOMC statement and Summary of Economic Projections, September 16, 2026; G.17 Industrial Production and Capacity Utilization); Federal Reserve Bank of Philadelphia (Manufacturing Business Outlook Survey); Federal Reserve Bank of New York (Empire State Manufacturing Survey); U.S. Department of Labor (Initial Jobless Claims); The Conference Board (Leading Economic Index, August 2026); Oxford Economics (core-goods and core PCE tracking, cited for its independent corroboration).
Geopolitical. Geo News and Arab News (Kohat attack and Pakistan’s statement on the Afghan Taliban); Al Jazeera (Pakistan-Afghanistan border conflict; Houthi consolidation of Yemen’s Red Sea coast); Bloomberg (Houthi shipping and Saudi oil risk; Ukraine’s strike on the Yaroslavl refinery; the US-Denmark Greenland framework); The Moscow Times, via Reuters (the September 20 strike on the Moscow refinery); Kyiv Independent and bne IntelliNews (Ukraine’s campaign against Russian refining capacity); NPR (US-Denmark Greenland agreement terms); Encyclopaedia Britannica (status of the 2026 Iran war); Arab News, via AFP (the September 24 Trump-Xi meeting and characterization of expectations for it); Scripps News (Trump’s UN General Assembly address); the United Nations (General Assembly high-level week dates); Piedmont Crescent Capital, “Trump’s Greenland Gambit: The Panama Canal Lesson America Forgot”, January 26, 2026 (our own prior Greenland argument).
Market data as of Friday, September 18, 2026 close: Yahoo Finance and TheStreet (equity indices); USAGold (precious metals); Fortune (Brent crude); U.S. Department of the Treasury (daily par yield curve); Freddie Mac (Primary Mortgage Market Survey); ICE BofA indices via FRED (investment-grade and high-yield option-adjusted spreads).
A View from the Piedmont is published weekly by Piedmont Crescent Capital for informational purposes only and does not constitute investment, legal, or tax advice. Views expressed are those of the author as of the date of publication and are subject to change. © 2026 Piedmont Crescent Capital, LLC. All rights reserved.