
Piedmont Crescent Capital
A View from the Piedmont · Our weekly commentary on money, credit, exchange rates and geopolitics
The Turn You Cannot See at the Time
Chair Warsh took the Fed off its emergency footing and the market believed him: breakevens fell while real rates rose. Underlying inflation is already at target on every gauge that strips the shocks. The pressure that remains sits in energy, protein and fertilizer, and none of it is reachable by a funds rate.
Download the full report PDF, 10 pages, including the full U.S. economic and financial outlook table.
Market dashboard
| Indicator | Level | This week |
|---|---|---|
| Fed funds target range | 3.50–3.75% | Unchanged |
| 2-year Treasury | 4.34% | +10 bp |
| 5-year Treasury | 4.48% | +5 bp |
| 10-year Treasury | 4.73% | −1 bp |
| 30-year Treasury | 5.22% | −5 bp |
| 2s–10s spread | 39 bp | −11 bp |
| 2s–30s spread | 88 bp | −15 bp |
| 5-year TIPS breakeven | 2.30% | −1 bp Friday |
| 10-year TIPS breakeven | 2.31% | −2 bp Friday |
| 30-year fixed mortgage | 6.66% | +1 bp |
| Investment grade OAS | ~80 bp | −1 bp |
| High yield OAS | 263 bp | −6 bp |
| September 16 hike odds | 59% | from 35% |
| Hikes priced, next 12 months | 2.4 | from 1.8 |
| Chicago PMI, August | 47.1 | −10.5 points |
| S&P 500 | 7,711.76 | +0.5% |
| Dow Jones Industrial Average | 53,559.99 | +0.5% |
| Nasdaq Composite | 26,402.42 | +0.8% |
| Russell 2000 | 2,972.37 | −1.5% |
| Brent crude, October | $89.31 | −5.4% |
| WTI crude, October | $83.40 | −5.0% |
| Gold, December settle | $4,529.90 | −2.9% Friday |
| ULSD crack spread | $95.06 | +$3.23 Friday |
| Retail diesel, national | $5.652 | +52.4% y/y |
| Distillate stocks | 103.4 mn bbl | 14% below 5-yr |
| Headline PCE, 12-month | 3.7% | July print |
| Headline PCE, 6-month annualized | 4.1% | Warsh’s number |
| Core PCE, 12-month | 3.30% | Unchanged |
| Dallas Fed trimmed mean PCE | 2.3% | Flat six months |
| Benchmark revision, March 2026 | −79,000 | vs. +183,000 est. |
Summary
Chair Warsh gave a standard rather than a rule. He retired forward guidance as a crisis legacy that “has overstayed its welcome,” declined to offer a reaction function, and closed: “I stand here today committed to a discipline, not to a decision.” The standard he gave has a trigger: “We must be confident that underlying inflation is moving to our objective, clearly and at sufficient speed. Otherwise, we have work to do.”
He declared one mandate met and the other not. Employment: 4.1% jobless rate, claims near the lowest in decades, “labor markets are consistent with full employment.” Prices: “the Fed’s predominant focus right now should be on prices.” This Fed is content with one half of its mandate but frustrated and a little anguished by the other.
He rejected the premise our commentary has run since June. Warsh: “I would be hard pressed to describe broad financial conditions as restrictive.” We disagree and would point to the most interest-rate-sensitive parts of the economy — housing and consumer durable goods — as prima facie evidence that policy is tight. The parts of the economy that are booming are less affected by interest rates and are being driven by a structural shift in technology and by waves of public and private investment.
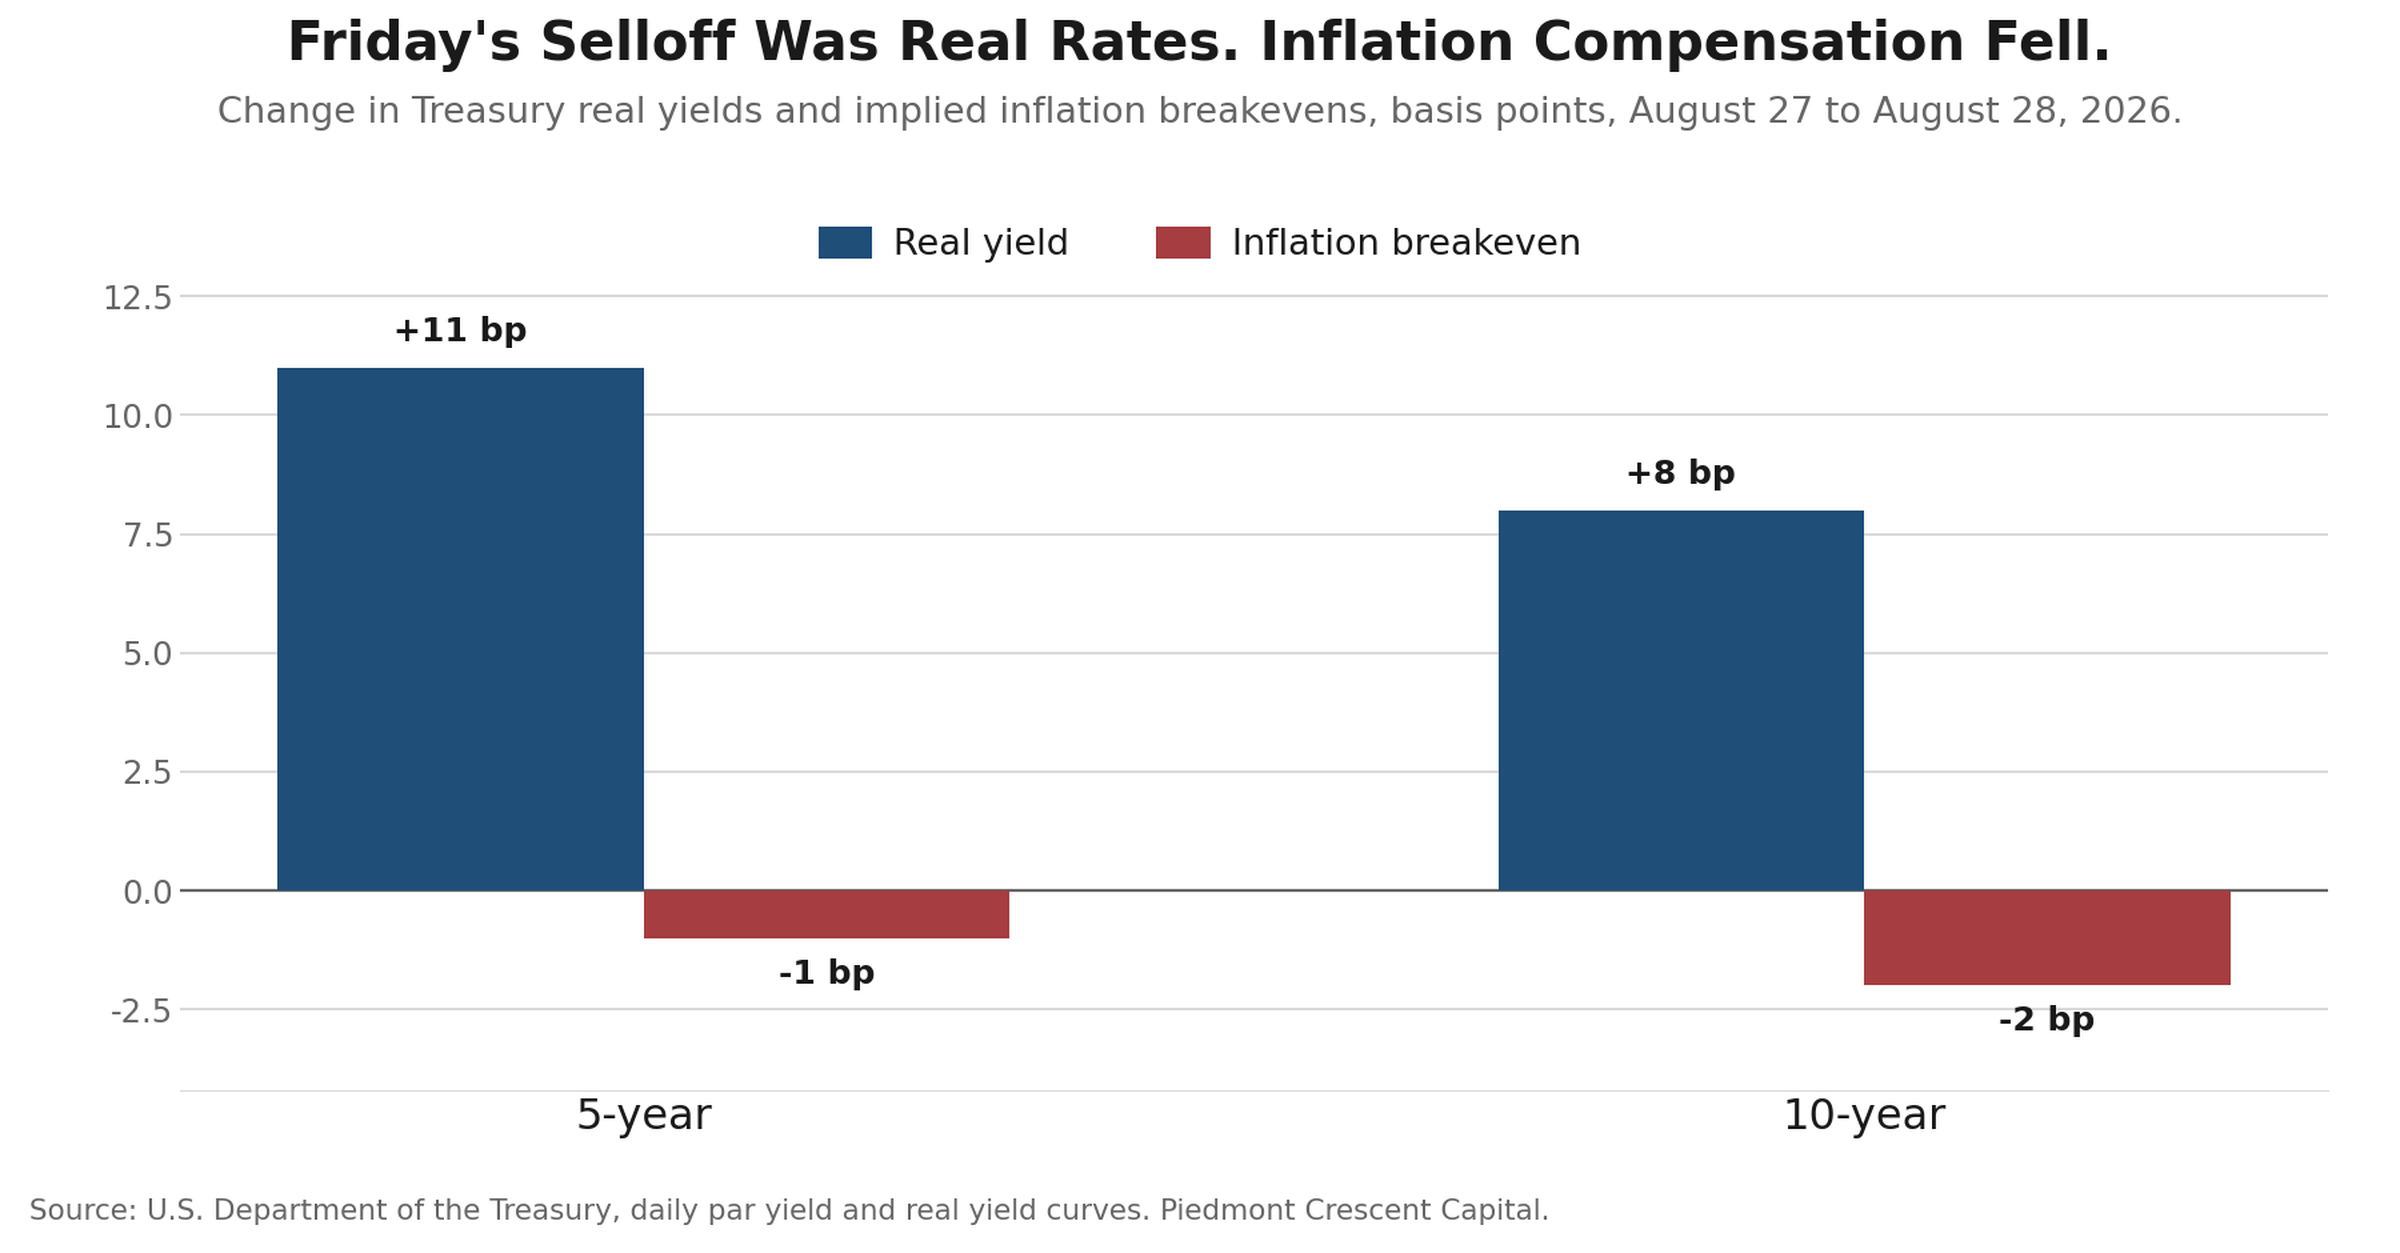
The market repriced hard, and the composition is the most important thing in this issue. The 2-year rose 14 basis points on the day to 4.34%; the 30-year rose 3 and fell 5 on the week. 2s–30s flattened 15 basis points. September hike odds went from 35% to 59%. And breakevens fell while real yields rose 11 and 8 basis points. The entire move was real rates, the market believing him rather than doubting him.
Then the data arrived and did not corroborate Warsh. Inside fifteen minutes: the payroll benchmark revision at −79,000 against a Bloomberg survey median of +183,000; the Chicago Business Barometer down 10.5 points to 47.1, into contraction against a consensus near 58.
The war escalated Sunday and it is in no price you can see yet. U.S. forces struck two IRGC rocket launchers on Larak Island in the Strait of Hormuz, which CENTCOM says were being prepared to fire sea mines into the waterway, ending a 31-night pause in strikes on Iranian territory. The IRGC reported dead and wounded on the island and promised reprisals, then struck U.S. positions in Jordan overnight, at King Hussein Air Base and Al Azraq. Jordan’s army says it intercepted eight ballistic missiles over the kingdom at dawn Monday, and U.S. officials report no significant impacts. The IRGC claims heavy damage to maintenance and aircraft facilities on the two bases, which nobody outside Tehran has confirmed. Brent for November opened above $90 and West Texas Intermediate near $86, up roughly 3% from Friday. Visible Hormuz transits fell to about five a day over the weekend. The August 26 Iran–Oman revenue-sharing framework survives on paper, but Tehran had already said it guarantees no reopening and Washington has told mediators it will not revive the June terms.
Our central thesis
A turn is almost impossible to identify while you are standing on it. That is the lesson we keep returning to, and it is the frame for this issue.
Earlier in my career we called the end of the 1990–91 recession correctly and early. The call was right and it was useless, because the endpoint of a recession is its low point, and nobody can be persuaded that things are improving at the moment they feel worst. The data that would have proved it arrives a year later, revised.
We think that is where underlying inflation sits today. Figure 1 is the argument in one graph. Every gauge that strips or trims the shocks is at or below target: the Dallas Fed trimmed mean at 2.3% and flat for six months, our own Hodrick-Prescott trend on core CPI at 2.51% and falling for six consecutive months, six-month core CPI at 2.42% and three-month at 1.64%. Every gauge that carries the shocks is well above it, and those are the ones being quoted: headline PCE at 3.7% over twelve months and 4.1% over six, which is the number the Chairman led with. Those are also the prices consumers actually see and feel.
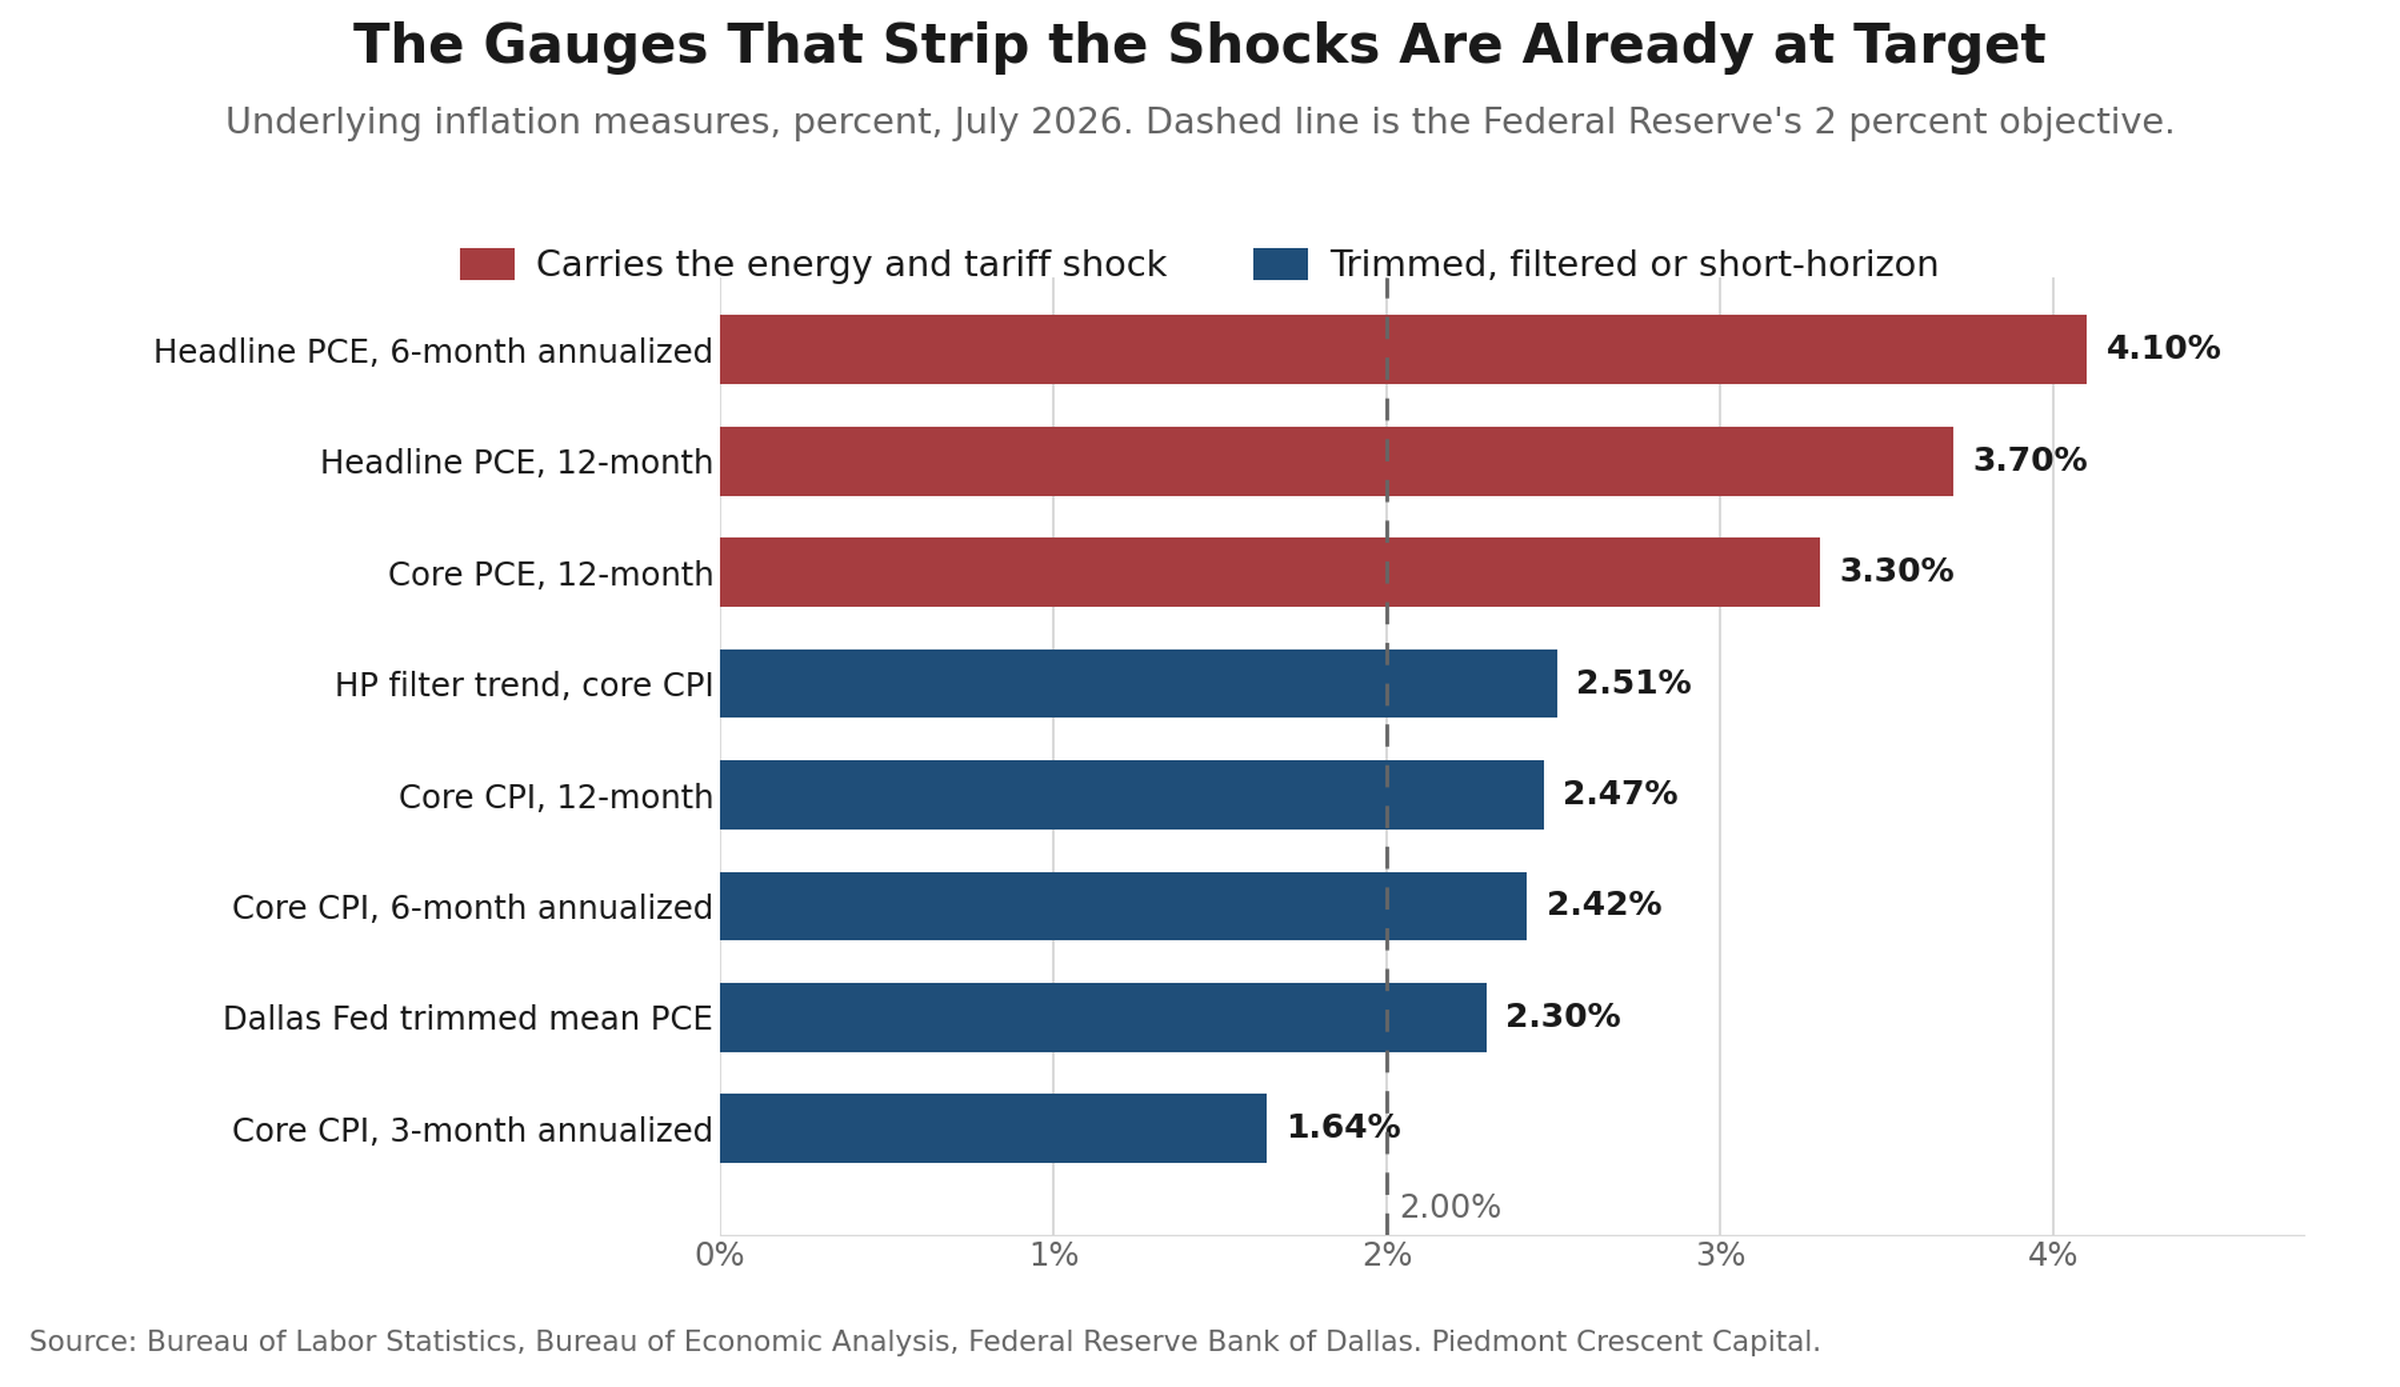
The corollary is uncomfortable for both sides. If underlying inflation has turned, the hawks are calling for a hike into a disinflation they cannot see yet. But we would not expect anyone to believe us, for the same reason nobody believed the March 1991 call: telling a trucking company that underlying inflation is 2.3% while diesel is up 52% is not an argument that lands well.
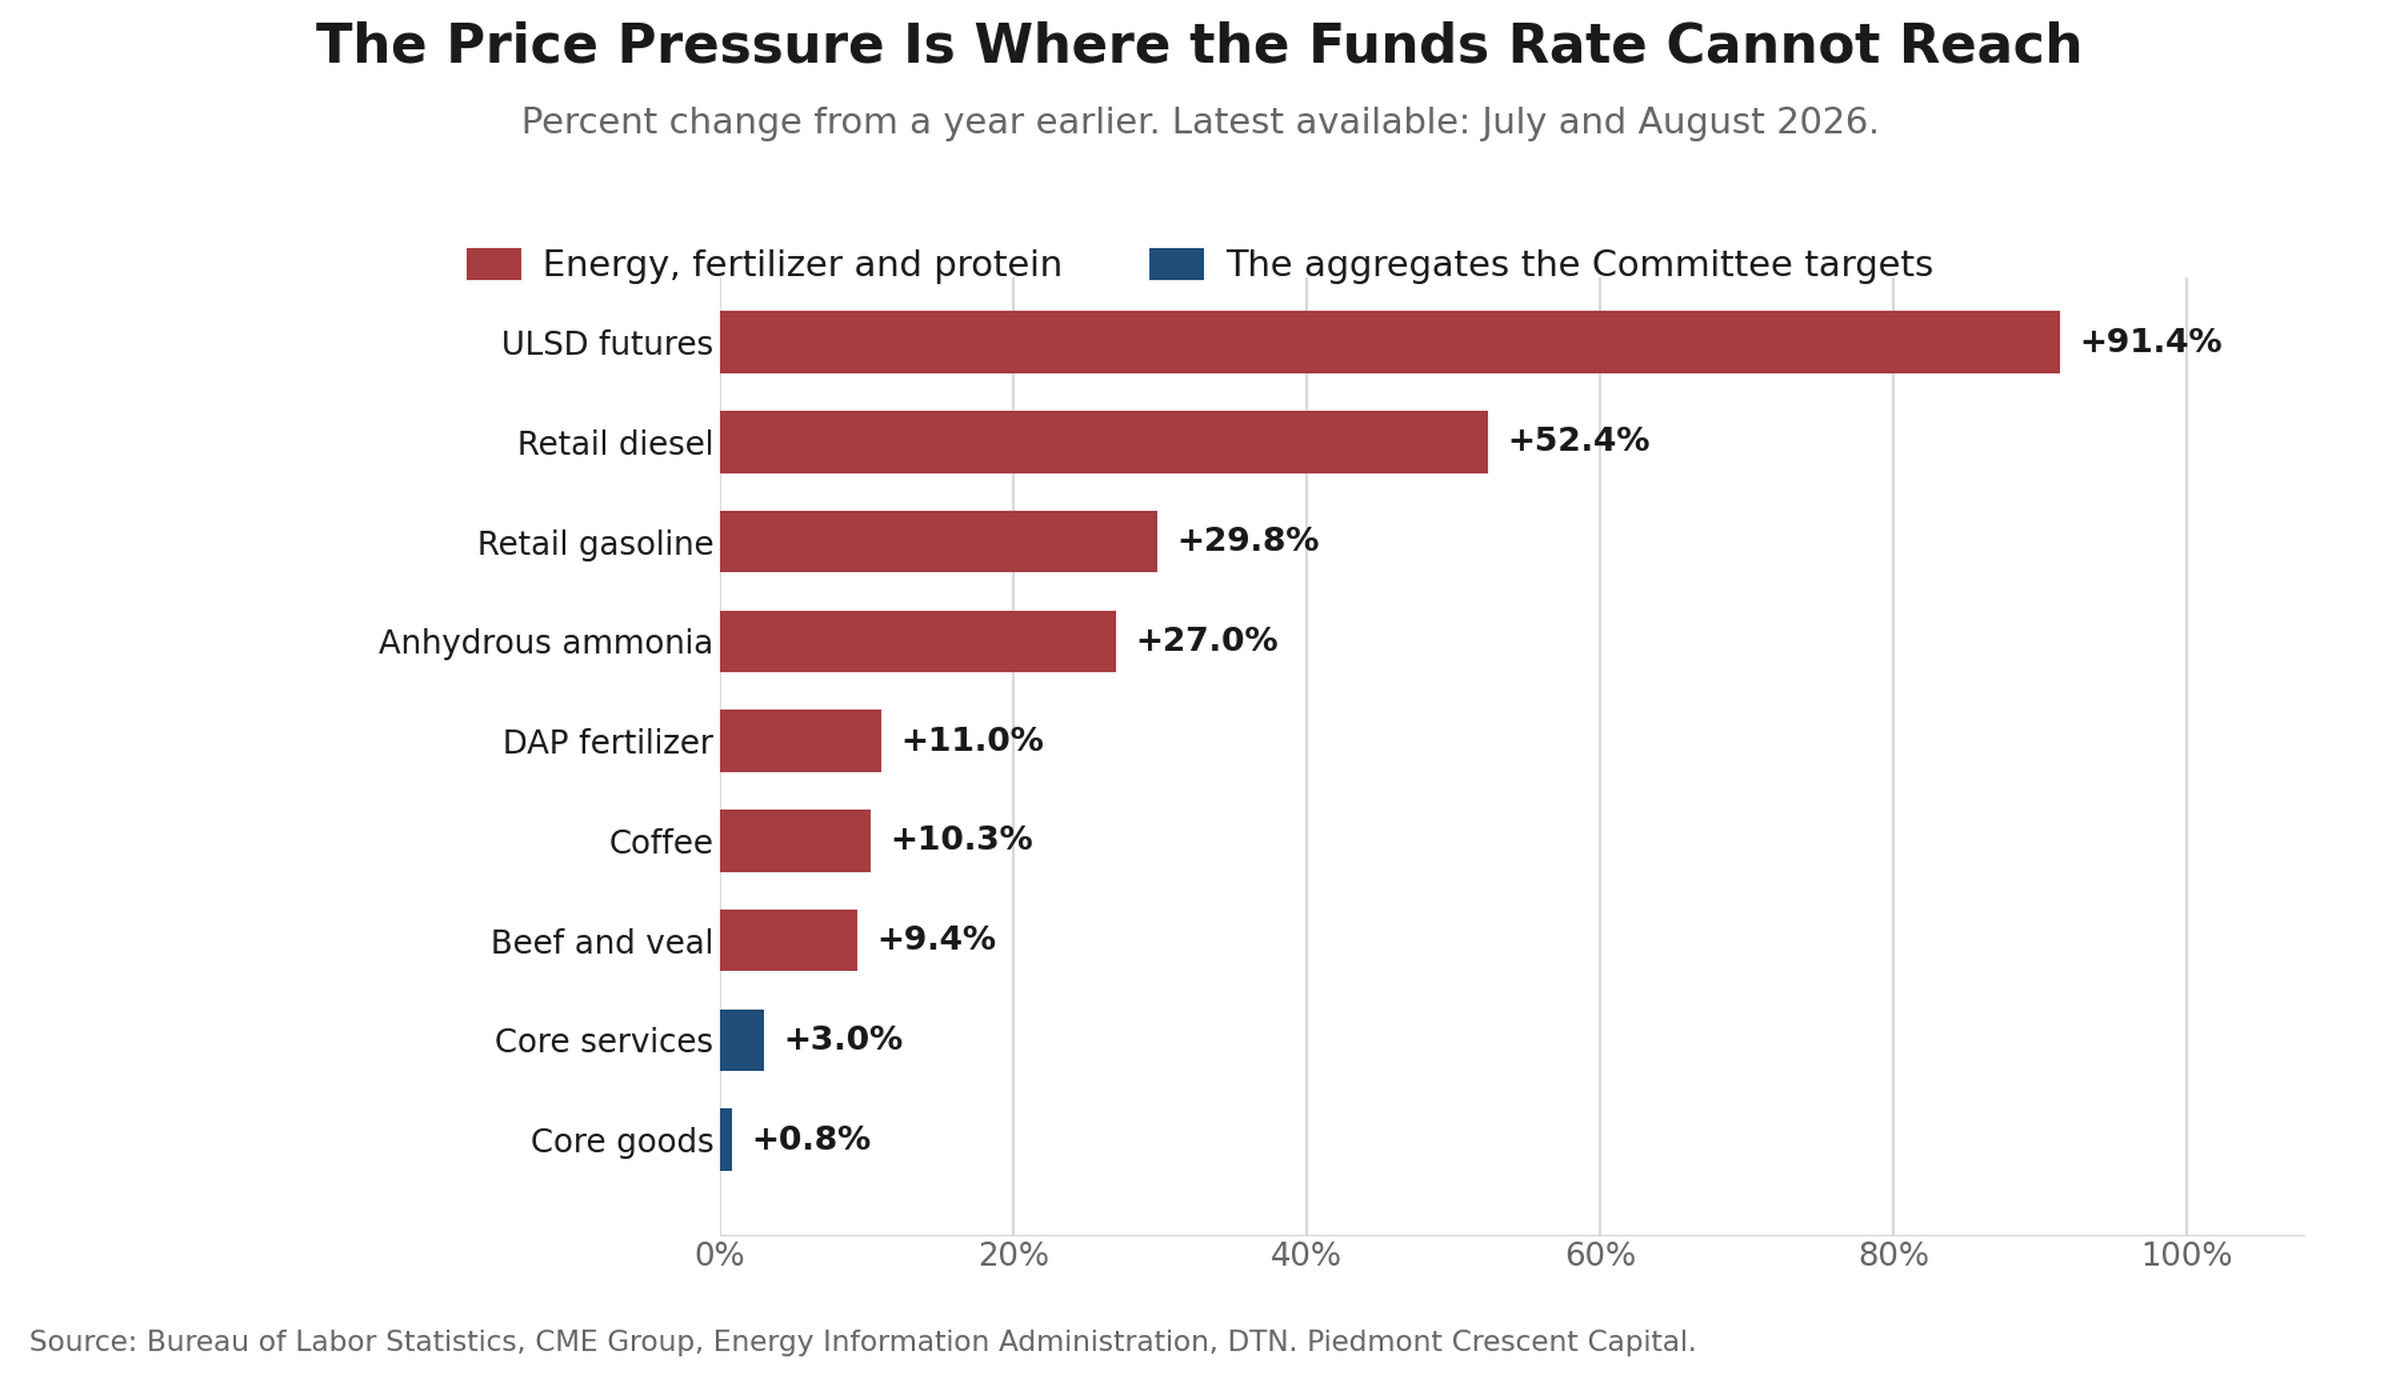
Look at what is still hot. Diesel, gasoline, ammonia, phosphate, coffee, beef. Figure 2 puts them next to the two aggregates the Committee actually targets. These are supply shocks: a refining shortage, a war, a fertilizer complex routed through Hormuz, and a cattle herd at a 75-year low. A funds rate hike does not reach any of them. A central bank that tightens into this set is adding a demand contraction to a supply contraction and calling the sum prudence.
Friday settled a question we have been arguing for two months, and it settled it our way. We have said the long-end selloff is a real-rate and term-premium event rather than a credibility event. On the day the market repriced most violently, inflation compensation fell while real yields rose (Figure 3). If the bond market doubted this Committee’s willingness to return inflation to target, a hawkish speech would not compress breakevens. Everyone arguing that a 5% thirty-year reflects lost credibility now has some explaining to do.
We are moving the first hike to the first quarter of 2027 from the first half, keeping the September hold, and raising the weight on a 2026 move. We set a rule a week ago: an explicit conditional tightening rule would mean our timing was too late; philosophy without a conditional would leave the call unchanged. Warsh gave neither cleanly: a refused reaction function plus a standard with a trigger. A partial clear moves the date, not the direction.
The house consensus is with us on September and nowhere near us on the first quarter of 2027. Most major forecasters expect a hold this month, several conditioning a hike on a firmer August consumer price print. The published alternatives to our view run in opposite directions: a 2026 hike as a tail risk, or a 2027 cut as a baseline. Nobody else carries a first-quarter-2027 hike, and the bullish duration calls have the 10-year 30 to 40 basis points through forwards by then.
This week’s argument
The supply argument in the speech runs in one direction only
Warsh’s second principle is the spine of the address: “all we observe directly is activity. We never see, and can only infer, what’s really happening on the supply side.” It is correct. He then applies it asymmetrically.
On employment, supply does all the work — “when labor supply is barely growing, monthly job gains are naturally going to run low,” which converts a weak payroll trend into a reading “consistent with full employment.” On prices, the supply argument disappears. The speech names not one constraint: not tariffs, not semiconductors, not fertilizer, not the immigration policy behind the labor scarcity he invokes. The word “diesel” does not appear.
The arithmetic is what makes this more than a stylistic complaint.
| What he used | What he did not | The gap |
|---|---|---|
| Headline PCE, 6-month annualized: 4.1% | Core PCE, 12-month: 3.3% | Largely energy — the shock his own principle says to be careful about |
| Target is 2% “as measured by the PCE price index” — headline | Core, which most central banks target | An energy shock now sits inside the target rather than being looked through |
| Private domestic final purchases “nearly 3%” | That the measure is inflated by AI equipment imports | Same wedge as Q2 GDP at 1.5% against domestic final demand at 4.2% |
| 54% of PCE components above 3% | That the calculation partly reflects tariffs | Core goods run roughly 4.5% above their pre-2025 trend on tariffs, a weaker dollar and oil |
Each of those choices flatters the hawkish reading, and each one does it by picking up a supply distortion. We do not think it is deliberate. We do think a Chairman whose second principle is that supply cannot be observed should have been more careful with measures that confound it.
The 54% figure is worth one further note. It is a diffusion index: it counts how many prices are rising quickly and does not weight them by what households spend. It has no counterpart in the literature or in any major house’s published toolkit, and nobody outside the building can replicate it. That is a fair thing to ask him to publish. One point against ourselves: a gauge built specifically to track what households perceive — weighted toward food and rent, the prices met most often — prints above core PCE, not below. Expenditure weighting does not automatically favor our reading.
What we would and would not blame on the artificial intelligence buildout
We had intended to argue that part of the diesel surge is data centers burning fuel in generators while they wait for grid interconnection. The data does not support it as a macro story, and we would rather say so than run it.
The premise is real. Northern Virginia has more than 4,000 diesel generators at data centers with over 11 gigawatts of capacity — more than Dominion’s entire gas fleet — and interconnection waits have stretched from under two years in 2008 to about five, so developers self-generate to get operational. In January the Department of Energy authorized PJM and two Duke units to direct data centers to run diesel backup against rolling blackouts.
But the magnitudes do not work. One Amazon permit contemplating 10 million gallons a year is about 650 barrels a day at full permitted burn, and permitted maximum is far above actual for units that idle most of the year. Fifty such campuses running flat out would be under 1% of distillate demand, and domestic distillate demand in August is running below a year ago. There is no demand surge to explain. Sustained bridge generation is also overwhelmingly gas, not diesel.
The tightness is supply and exports. Distillate exports hit a record 1.9 million barrels a day in the week ending August 5, into a European market starved by Russia’s export ban, while stocks sit at 103.4 million barrels, the lowest for the time of year in the history of the series, with refineries at 97.4% of capacity. Ukraine struck 21 Russian refineries in August, a record; Russian crude runs averaged 3.8 million barrels a day against a 5.3 to 5.5 normal, a 24-year low. Kirishi, the second largest at roughly 20 million tonnes a year, took another drone strike overnight Saturday, days after restarting from repairs; 62 drones were downed over Leningrad Oblast alone.
So the honest version is narrower and still ours: data center diesel is a real regional pressure in PJM and Northern Virginia, activated by cold snaps and loosening emergency definitions, and it is growing. It is not why the crack is at $95.
Fertilizer and beef are the same story as diesel, and beef is the cleanest illustration of the whole thesis
Fertilizer is a Hormuz story. Anhydrous ammonia is $964 a ton, up 27% over the year; DAP is $917, up 11%. The Middle East supplies roughly a quarter of global urea exports plus much of the sulfur and ammonia, all routed through the strait, and Iran, the third-largest urea exporter, has halted ammonia production while Qatar suspended output after facility damage. Two qualifications: five of eight fertilizers have now fallen month-over-month for four straight weeks, and USDA projects fertilizer and fuel costs to decline in 2027.
Beef is where the 1990/91 lesson hits home. Beef and veal are up 9.4% over the year, roughly three times headline, on a cattle herd of 86.2 million head — the lowest since 1951 — and a ninth consecutive annual decline in the calf crop. But July showed beef replacement heifers up 3%, the first real retention in about a decade.
That retention is the turn, and it makes the shortage worse before it makes it better, because every heifer held back to rebuild is one not slaughtered. The cycle has turned and beef prices will keep rising for two more years. Beef and coffee both fell month-over-month in July, and eggs are down 25.7% over the year. A central bank waiting for these categories to confirm a disinflation will wait past the point where it should have acted, the same error, in the other direction, that we made in 1991.
Behind the numbers
| Release | Reading | |
|---|---|---|
| Core PCE, July | +0.2% m/m, 3.3% y/y | Our decomposition puts portfolio management and advice fees — an imputed price no consumer pays — at roughly a tenth of the monthly print; market-based core ran 0.15%. The risk is core services ex-housing, neither a fees artifact nor energy |
| Q2 GDP, second estimate | 1.5%, unrevised | Core PCE price index revised up to 3.6% annualized — a within-quarter acceleration and the hawks’ best number |
| Real consumer spending, July | 0.0% | Services +$86.2 bn, goods −$49.9 bn. Warsh cited “more than 2 percent over the past four quarters”; over the last month it was zero |
| Benchmark revision | −79,000 | Cuts monthly payroll growth from ~25,000 to ~18,000. Private cut 178,000; government revised up 99,000. The preliminary has run below the final in each of the last six years by ~100,000; not in published data until February 2027 |
| Chicago PMI | 47.1, −10.5 pts | One volatile regional survey, no component detail. Tuesday’s ISM is the confirmation test |
| Michigan, final | 1-yr 4.0%, 5–10 yr 3.3% | We are not using this against Warsh. The 1-year improved from 4.3%, and the survey has been distorted by politicized responses and a switch to online collection. Market measures are cleaner and support him |
| New home sales, July | 607,000, −10.5% | Months’ supply 9.6; completed spec inventory ~4× its 2022 low; homes not started at an all-time high |
| Claims | 203,000; continuing 1,778,000 | Reverses a grind higher. But Richmond employment printed −2 and Kansas City 0, with prices paid pulling away from prices received |
On small business, which we add to the strained list, the evidence is mixed and we report it that way. Subchapter V small business bankruptcies rose 67% year over year in the first quarter and 24% in July, with first-half filings up 50%, while total commercial filings were flat to down. That concentration is the cleanest fact available; the NFIB average rate paid on short-maturity loans is 7.9%, with only 27% of small firms borrowing regularly against a 34% historical average. The July Senior Loan Officer survey cuts the other way: banks left small-firm standards unchanged and eased spreads while demand was flat. The squeeze is on the demand side, reflecting tighter margins.
Bottom line
We expect a hold on September 16 and a first hike in the first quarter of 2027. The market prices 59% for September on futures and 69% on prediction markets. We are well under it.
The condition that would flip us is eleven days away. Core CPI at or above 0.3% on September 11, particularly with core goods above 0.4%, would mean the refining shock has reached the goods basket and would make a September move the base case. Friday’s payroll report comes first and matters mainly for the tail.
| Call | Status | Where it stands |
|---|---|---|
| 30-year 5.00–5.40% into September 16 | On track | 5.22%; 39 consecutive sessions at or above 5% since July 7 |
| Brent $85–100 average through year end | On track | $89.31; our own $92.00 third-quarter mark now looks high |
| August or September payrolls above 125,000 | At risk | Consensus near 45,000–55,000 for August |
| MOVE above 70 into September 16 | On track | Friday’s selloff helps |
| ULSD crack above $60 through Q4 | On track, now priceable | $95.06 Friday; record $101.86 on August 17. The Kirishi strike is not in that settlement |
| PCE components above 3% below 54% in January | New | A test of the Chairman’s own gauge. If we are right, his standard is met without a hike |
One risk attached to our own call is not the obvious one. A September hold seen as a close call, without a clear explanation of why, risks a repeat of the July meeting’s effect on the curve: bear steepening and a term-premium build. That is the scenario where we are right on the decision and hurt on the positioning, and it argues for the belly against both wings.
We stay cautious on duration. The 2-year at 4.34% pays for a reinvestment decision with almost no duration risk, and 88 basis points at the long end is not compensation for a maturity whose marginal basis point is set by a shipping lane and a drone campaign. This puts us opposite the bullish duration calls, which have the 10-year well through forwards by early 2027.
This is still a capital-led, employment-light expansion. What changed is that the Federal Reserve is being taken off the emergency footing it has occupied since 2008, and the market’s first verdict was to believe it. If the Fed will no longer say where rates are going, someone else decides what duration is worth. A 30-year at 5.22% is that decision being made in public.
CFO and treasurers corner
Plan on less warning. The Fed has stopped underwriting your rate forecast: fewer signposts, possibly fewer meetings, no path. Hedge on a schedule rather than on a view.
Do not read the crude tape as a fuel budget. Brent fell 5.4% and diesel rose 19.8 cents; the crack settled at $95 on a day crude fell, and Sunday’s escalation is not in it. Hedge the product or the crack, not the barrel.
The 2-year moved 14 basis points on a speech containing no policy commitment. If you were planning to fix floating-rate exposure, you are now paying for better than half a hike in September and 2.4 over twelve months.
Two dates. Canadian retaliation takes effect September 8. Ottawa published the schedule on August 25: C$27.6 billion of goods, roughly 700 tariff lines at 15%, 25% and 50%, with steel and aluminum doubled to 50%, alongside a C$7.5 billion support package. Check the list against your own bill of materials before you assume an exemption. Treasury’s upsized long-end buybacks begin September 9 or 10: the announcement says the 9th, the published schedule shows the next 10- to 20-year operation on the 10th. Verify before positioning.
If you buy protein or fertilizer, the cycle is against you into 2028. Cattle retention has started, which tightens beef before it loosens it. Contract further forward than feels comfortable.
Piedmont Perspective — What counts as a job now
The short version of a standalone essay published today.
The Chairman rested the employment mandate on three indicators: the 4.1% unemployment rate, a four-week claims average he called “an empirically robust real-time indicator,” and the judgment that people who want work are finding it. All three share a blind spot that has been widening for twenty-five years.
Independent contractors cannot file an unemployment claim in any state, and the exclusion is structural. Unemployment insurance was built in 1935 around a wage earner on one payroll, and its financing is experience-rated, which requires an identifiable employer to charge. There is no employer to experience-rate for a contractor.
The consequence is a number nobody quotes. The share of unemployed Americans actually receiving benefits was roughly 50% in the 1950s and is 28% today. The insured unemployment rate divided by U-3 was about 0.70 in 1971; on Friday it was 0.29. Continuing claims of 1,778,000 against 6,916,000 unemployed is 25.7%. Three of every four unemployed Americans are not in the series the Chairman called robust.
The unemployment rate has the opposite problem: one hour of paid work makes you employed. U-3 fell 0.2% over the year while U-6 did not move at all, and the multiple jobholders rate has risen every month since March.
And the official measure of platform work is a decade old: 1.6 million workers, 1.0% of employment, from May 2017, itself a hand-recode because the questions “did not work as intended.” The 2023 replacement questions have never been published. In February the Bureau redesigned the module to ask them of people not employed at the time of survey, an admission the old instrument could not see platform work among people classified as unemployed.
What makes this cyclical rather than untidy is that the substitution has been measured. Work published this year in the Journal of Financial Economics finds that after a job loss, workers with platform access were 3.3% less likely to collect unemployment benefits, strongest in low-benefit states. Boston Fed work estimates counting informal work as employment would lower the unemployment rate 1.0%. Each effect pushes the Chairman’s indicators toward full employment without a unit of improvement in labor demand.
We are not arguing the labor market is secretly weak. We do not know, and neither does anyone else. That is the point. The prevailing house view reads it as supply-constrained rather than demand-weak, with some forecasts putting unemployment at 3.9% by year end. We would have the Committee hold its conclusion more loosely and put the prime-age employment-population ratio, U-6, the job-finding rate and aggregate hours alongside the headline.
The G20 comes to North Carolina
The G20 finance ministers and central bank governors meet at the Omni Grove Park Inn in Asheville Monday and Tuesday. Secretary Bessent hosts and Chair Warsh co-hosts, three days after Jackson Hole and four days before the blackout. Lagarde and Ueda skipped the symposium to attend. The United States holds the 2026 presidency; the Leaders’ Summit is December 14–15 at Doral. Climate, health and food security working groups have been cut. South Africa is not participating, so this is effectively a G19.
Do not expect a communiqué. April produced only a narrow chair’s statement, so treat anything from Asheville as an American document. Iran is the live wire: Bessent is pressing members to choose between Iranian trade and dollar-system access, China takes roughly 90% of Iran’s crude exports, and Sunday’s escalation makes agreement less likely and headlines more so. If that pressure worked it would be oil-positive, not negative. Watch for any language on Treasury market functioning; that would be the week’s one tradeable output.
A local note, since we live here. Bessent chose Asheville to showcase the Helene recovery. Damage was roughly $60 billion against $9.7 billion of federal aid delivered, about 16%.
The week ahead
| Date | Release | Consensus | Why it matters |
|---|---|---|---|
| Mon Aug 31 | Dallas Fed manufacturing; G20 convenes, Asheville | 0.7 | Markets reopen to a repriced front end and Sunday’s escalation |
| Tue Sep 1 | ISM manufacturing | 55.3 | The confirmation test for Chicago’s 47.1. Sub-50 makes the activity question live; near 55 says Chicago was noise |
| Tue Sep 1 | JOLTS (July); construction spending; GDPNow | 7.39 mn openings | Governor Barr speaks |
| Wed Sep 2 | ADP; Beige Book; factory orders; Bank of Canada | +47,000 | Look for whether Richmond and Atlanta corroborate the margin squeeze. Broadcom reports — the AI capex read |
| Thu Sep 3 | Governor Waller, 8:30 a.m.; claims; ISM services; productivity; trade | Claims 205,000 | The last dovish voice before the blackout. If Waller has moved, that is the week. Hammack and Goolsbee also speak; coupons announced |
| Fri Sep 4 | August employment report | +45,000 to +55,000; U-3 4.2% | July missed by 103,000. A print below 25,000 on a revised-down benchmark takes September off the table |
| Sat Sep 5 | FOMC blackout begins | — | Runs through September 17 |
Then: OPEC+ September 6; Canadian retaliation September 8; auctions September 8–10; August PPI and CPI September 10–11, the pass-through test that decides September; FOMC September 15–16.
One quieter date. The fiscal year ends September 30 and shutdown risk is low: both chambers have passed continuing resolutions and prediction markets have moved from 35% in July to about 8%. The point is not October: the fight has been deferred to early December, landing on top of the December 8–9 FOMC.
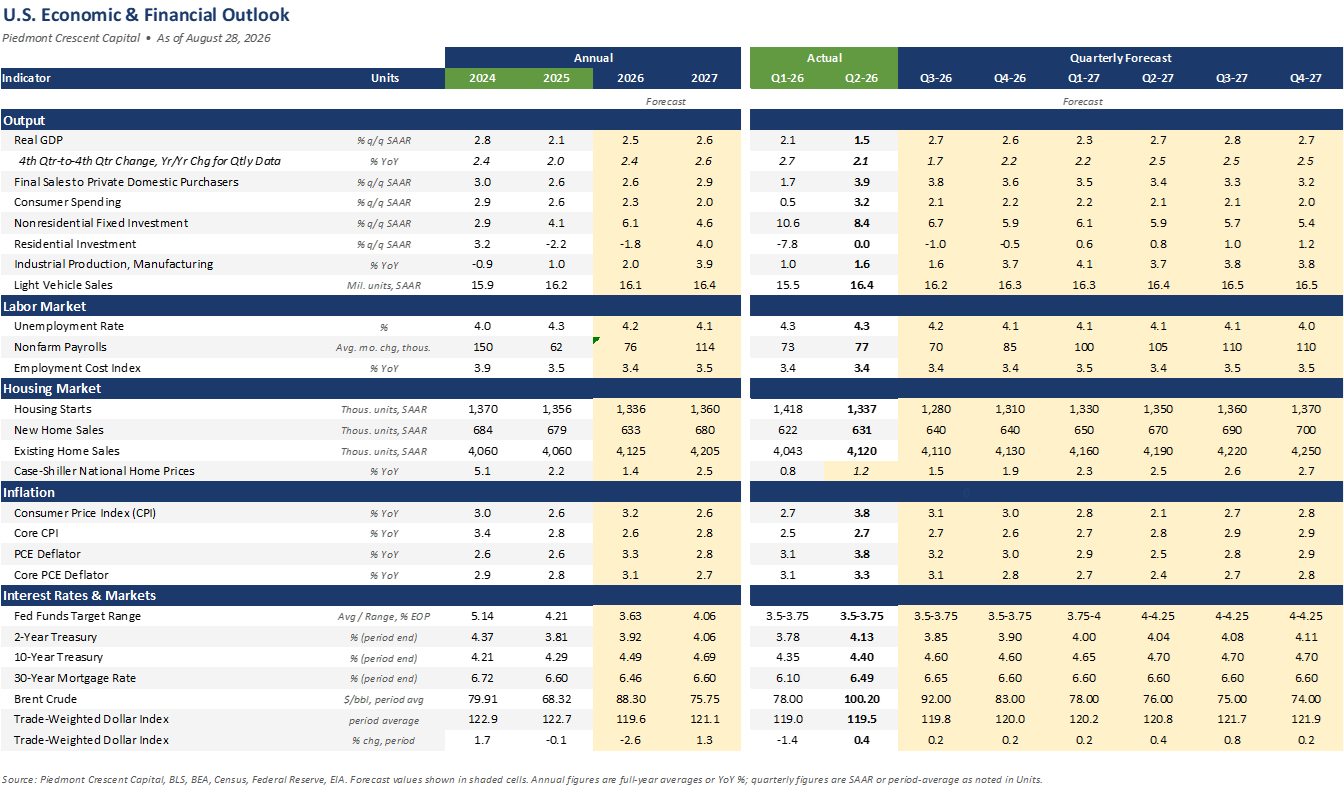
U.S. economic and financial outlook
Sources and notes
Sources. Warsh, “In Our Time,” Jackson Hole, August 28 · BLS, BEA and Census for the benchmark revision, prices, GDP and housing · U.S. Treasury par yield and real yield curves and the auction and buyback schedules · CME Group settlements · MNI, University of Michigan, Freddie Mac and EIA · USDA July Cattle report and DTN retail fertilizer · NFIB, the Senior Loan Officer Opinion Survey and Epiq/ABI · the Reserve Banks of Richmond, Kansas City, Dallas, Chicago, Atlanta, Boston, St. Louis and Minneapolis · CENTCOM, Reuters, CNN and Al Jazeera on Larak Island and Jordan · the World Bank on fertilizer · and published sell-side and independent research.
Notes. Yields, real yields and implied breakevens are the official par yield curves for August 28; gold is the COMEX December settlement, resolving a roughly $75 dispersion across intraday quotes; the ULSD crack is computed from CME settlements at 42 gallons per barrel, and the August 17 record of $101.86 is on the same basis. Sunday’s escalation is reported through Monday morning Gulf time. Larak casualty figures are Iranian claims, damage at the two Jordanian bases is unconfirmed, and there had been no Omani, Qatari or congressional response as of publication. Our underlying inflation trend is a one-sided recursive Hodrick-Prescott filter on monthly annualized core CPI, lambda 129,600, sample from January 2000, so each estimate uses only data available at the time and never revises. The 54% and 49% component shares are as cited by Chairman Warsh and are not independently replicated. The benchmark revision does not enter published payroll data until February 2027. All figures are subject to revision. For informational purposes only; not investment advice.
Download the full report PDF, 10 pages, with the market dashboard, all three figures and the full forecast table.