
The Trend Slips Again, the Paycheck Slips Back
Core prices rose 0.2% in July and the 12-month rate eased to 2.5%, pulling our HP-filtered estimate of underlying inflation down to 2.51%, the lowest reading since March 2021, while real hourly earnings fell back below year-ago levels.
Early Signals
- The trend keeps grinding lower. Our one-sided HP-filter estimate of underlying core inflation eased to 2.51% in July from 2.55% in June and 2.80% in May, the lowest reading since March 2021 and the third consecutive monthly decline.
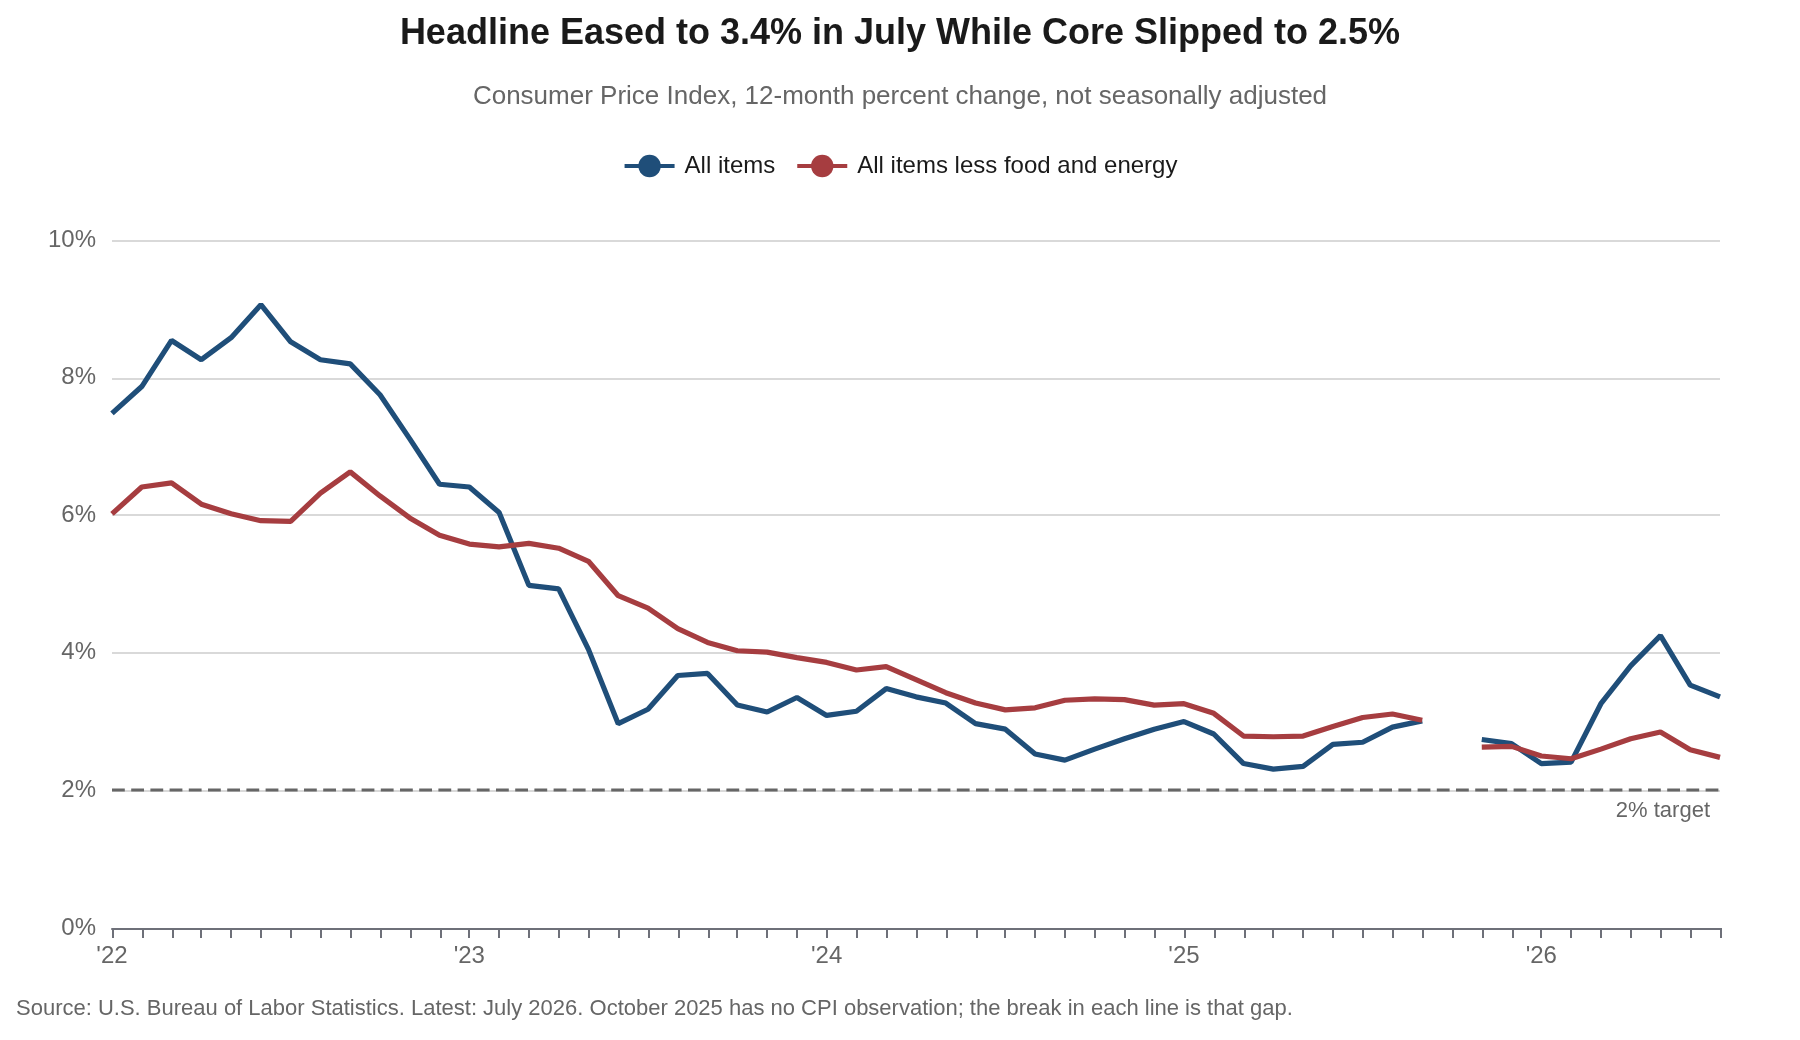
- Energy set the headline again, in both directions. The all items index rose 0.1% in July after falling 0.4% in June, as the energy index declined 1.5% and gasoline fell 2.9%. The 12-month rate slipped to 3.4% from 3.5%, although energy is still up 14.7% from a year ago.
- The two channels that carry monetary policy are in low gear. Shelter rose 0.1% for a second consecutive month, new vehicle prices rose 0.1% and are up just 0.5% over the year, and motor vehicle insurance fell 0.3% and is down 4.5%.
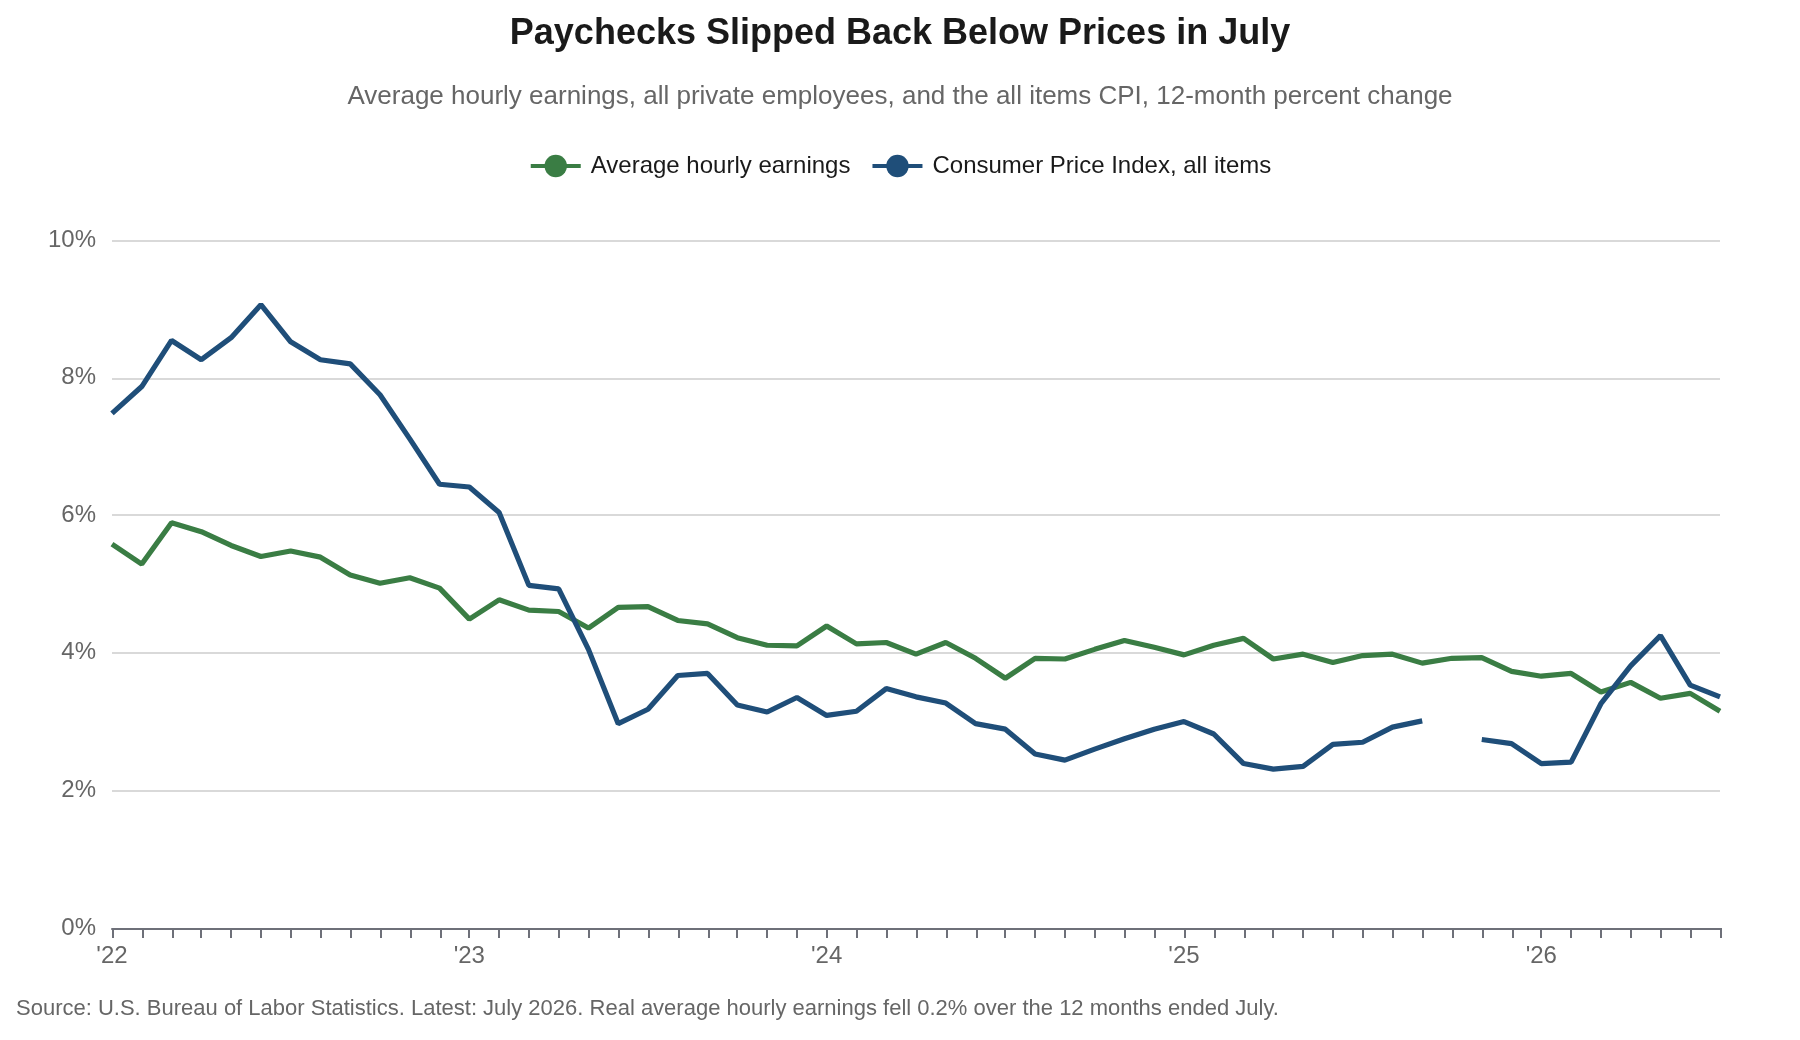
- Paychecks gave back June’s reprieve. Real average hourly earnings fell 0.1% in July and are down 0.2% over the past 12 months, undoing the 0.8% gain that a falling price level handed workers in June.
Key Takeaways
| Key Concept | Findings |
|---|---|
| Headline CPI | Rose 0.1% in July after falling 0.4% in June. The 12-month rate eased to 3.4% from 3.5%, matching the consensus forecast. |
| Energy | Down 1.5% on the month as gasoline fell 2.9%, but still up 14.7% over the year with gasoline up 24.6%. |
| Core CPI | Rose 0.2% after being unchanged in June, easing the annual rate to 2.5% from 2.6%. Core goods are up just 0.8% over the year. |
| HP-Filtered Trend | Our one-sided estimate of trend core inflation eased to 2.51% from 2.55%, the lowest since March 2021. Core CPI has risen at a 1.6% annual rate over the past three months. |
| Shelter | Up 0.1% for a second straight month and up 3.2% over the year, with owners’ equivalent rent and rent of primary residence both up 0.3%. |
| Light Vehicles | New vehicles up 0.1% (+0.5% over the year), used vehicles up 0.4% (−1.9%), and motor vehicle insurance down 0.3% (−4.5%). |
| Real Earnings | Real average hourly earnings fell 0.1% in July and are down 0.2% over the year. Real weekly earnings were unchanged. |
| Policy Signal | Nothing here forces the Committee’s hand in either direction. The report supports holding the funds rate at 3.50% to 3.75%. |
The Overview
The July inflation report arrived almost exactly where the consensus expected it, and that is the most useful thing about it. The Consumer Price Index rose 0.1% and the 12-month rate eased to 3.4% from 3.5%, while the core index rose 0.2% and its annual rate slipped to 2.5% from 2.6%. Shelter accounted for roughly two-thirds of the monthly increase in the all items index, and the energy index fell 1.5%, subtracting about a tenth of a percentage point from the all items index.
A report that lands on consensus rarely moves markets, but it does something more valuable for anyone trying to read the trend. Two months ago we cautioned against treating the spring’s four handle as evidence that inflation was reigniting, and last month we cautioned against treating June’s negative print as the arrival of the final mile. July is the month in which the noise on both sides cancels, and what is left underneath is a core index rising at a 1.6% annual rate over the past three months and 2.4% over the past six. Our filtered estimate of the underlying trend fell for a third consecutive month, to 2.51%, and the Cleveland and Dallas Fed measures point the same way from different directions.
Energy Keeps Setting the Headline
The energy index fell 1.5% in July after a 5.7% decline in June, as gasoline prices dropped 2.9% and fuel oil fell 1.7%. Natural gas rose 0.7% and electricity edged up 0.1%, so the reversal was narrower than June’s, when nearly every energy component fell together. The year-over-year arithmetic still carries the spring shock: energy is up 14.7% over the past 12 months and gasoline is up 24.6%, which is why a household’s sense of inflation is running well ahead of the 2.5% core rate that the Committee spends its time on.
Food was quiet. The food index rose 0.1% in July as groceries fell 0.1% and food away from home rose 0.3%. Three of the six major grocery store food groups declined, with meats, poultry, fish and eggs down 0.7% and fruits and vegetables down 0.1% as the index for lettuce fell 16.4%, its largest one-month decline on record. Beef prices, however, are still up 9.4% over the year, and food away from home is up 3.4%, so the relief in the aisles is narrower than the headline food number suggests.
Core Inflation: The Quiet Continues, With One Exception
The core index rose 0.2% in July after being unchanged in June, lowering the annual rate to 2.5% from 2.6%. The internals divide cleanly. Core goods, which carry an 18.8% weight, rose 0.2% on the month and are up only 0.8% over the year, with new vehicles up 0.5%, used vehicles down 1.9%, and medical care commodities down 2.7%. Core services rose 0.2% and are up 3.0%, held down by a shelter component that has now posted two consecutive 0.1% months.
The exception sits in core services outside of shelter, which rose 0.4% in July by our calculation from the published category effects, the firmest monthly reading since the spring. Medical care services rose 0.6% as hospital services gained 0.5%, public transportation rose 1.7% as airline fares climbed 2.2%, and motor vehicle maintenance and repair rose 0.6%. Two of those three, however, are categories where a single month rarely survives contact with the next one, and on a 12-month basis medical care services are up 2.7% and transportation services 2.9%. We would want to see this repeat in August and September before we called it a change in the services trend.
The Underlying Trend: Our HP-Filter Read
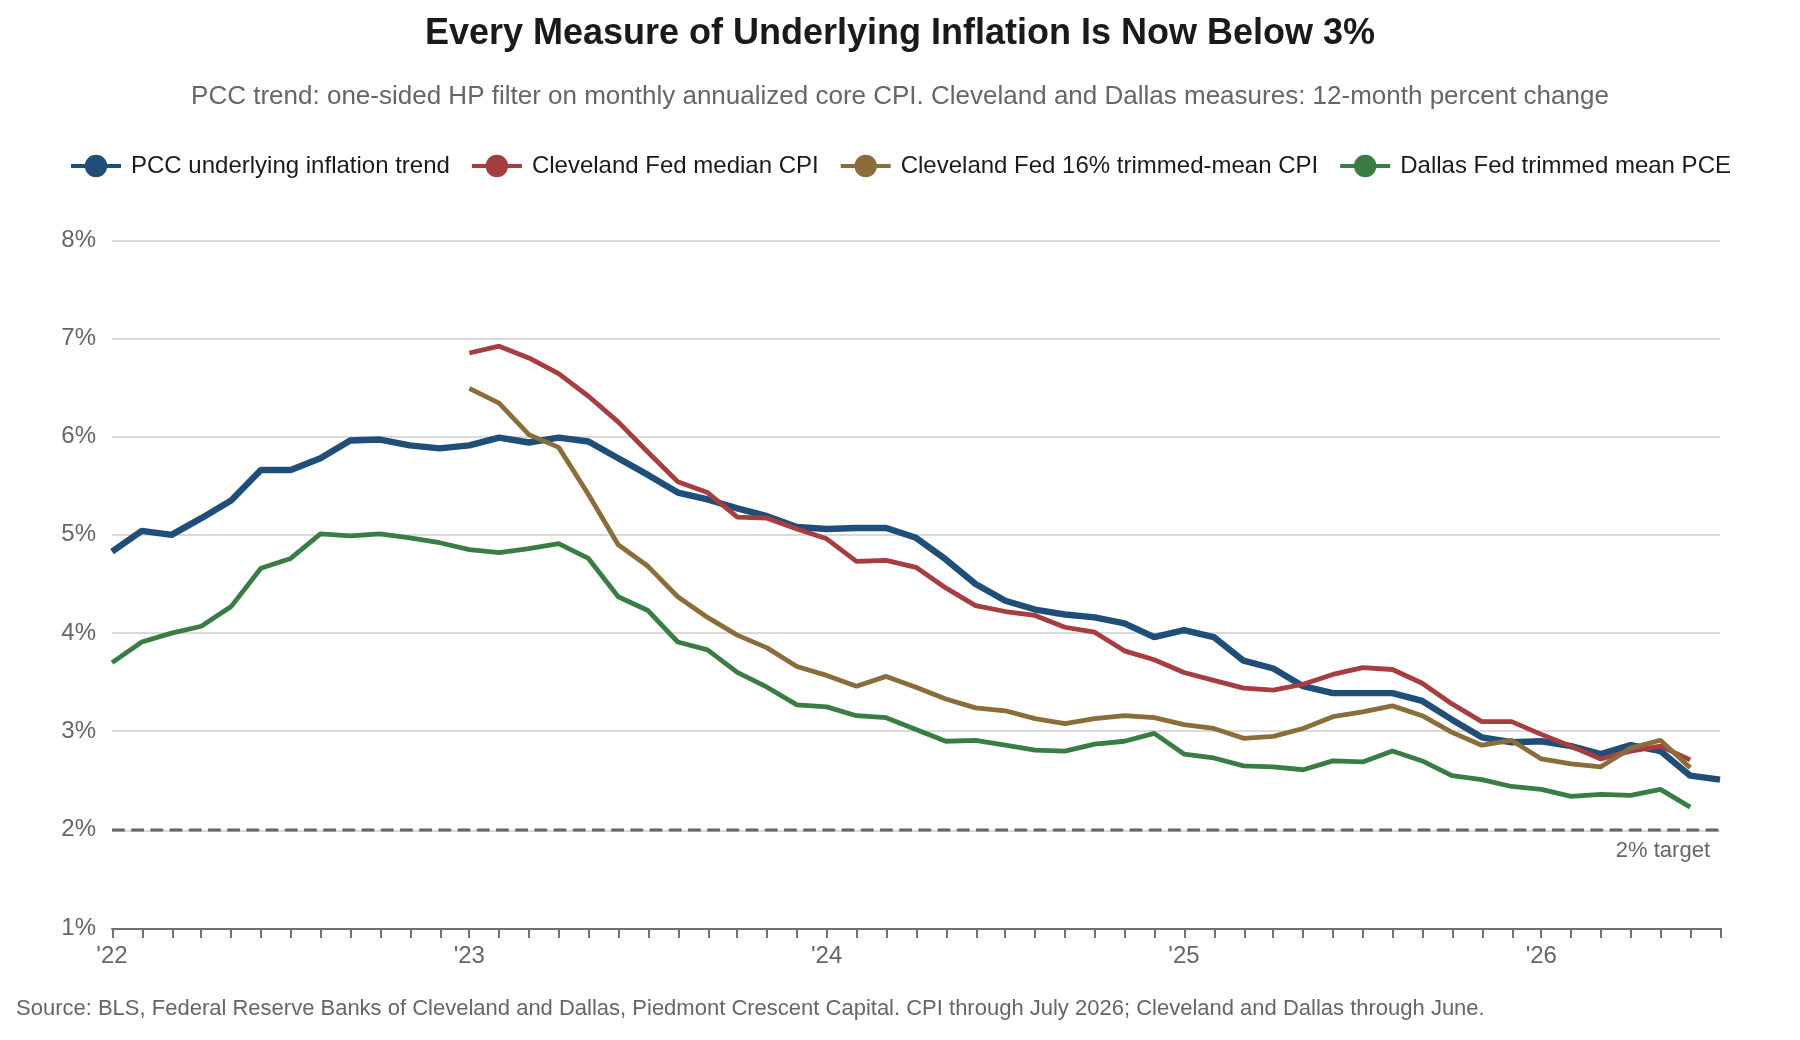
Our HP-filtered estimate of trend core inflation stands at 2.51% as of July, down from 2.55% in June, 2.80% in May and 2.89% at the turn of the year. The trend has fallen in each of the past three months and now sits at its lowest level since March 2021. A year ago it stood at 3.39%; two years ago it stood at 4.33%. The descent has been slow and almost unbroken, which is what a trend estimate is supposed to look like when the shocks moving the monthly prints are genuinely temporary.
The four measures we track disagree mainly about what to throw away. Core CPI drops food and energy by rule, in the months when those categories are noise and in the months when they carry signal. The Cleveland Fed’s median CPI and 16% trimmed-mean CPI, and the Dallas Fed’s trimmed mean PCE, discard whichever categories are extreme in a given month, a judgment made across the cross-section and made fresh every month. Ours throws out no category at all and works across time, letting the accumulated monthly record decide how much of the latest print is trend. Four different roads have arrived in the same neighborhood, all of them below 3%: our estimate at 2.51% in July, the Cleveland median at 2.71% and the 16% trimmed mean at 2.63% in June, and the Dallas trimmed mean PCE at 2.23% in June, its lowest reading since July 2021.
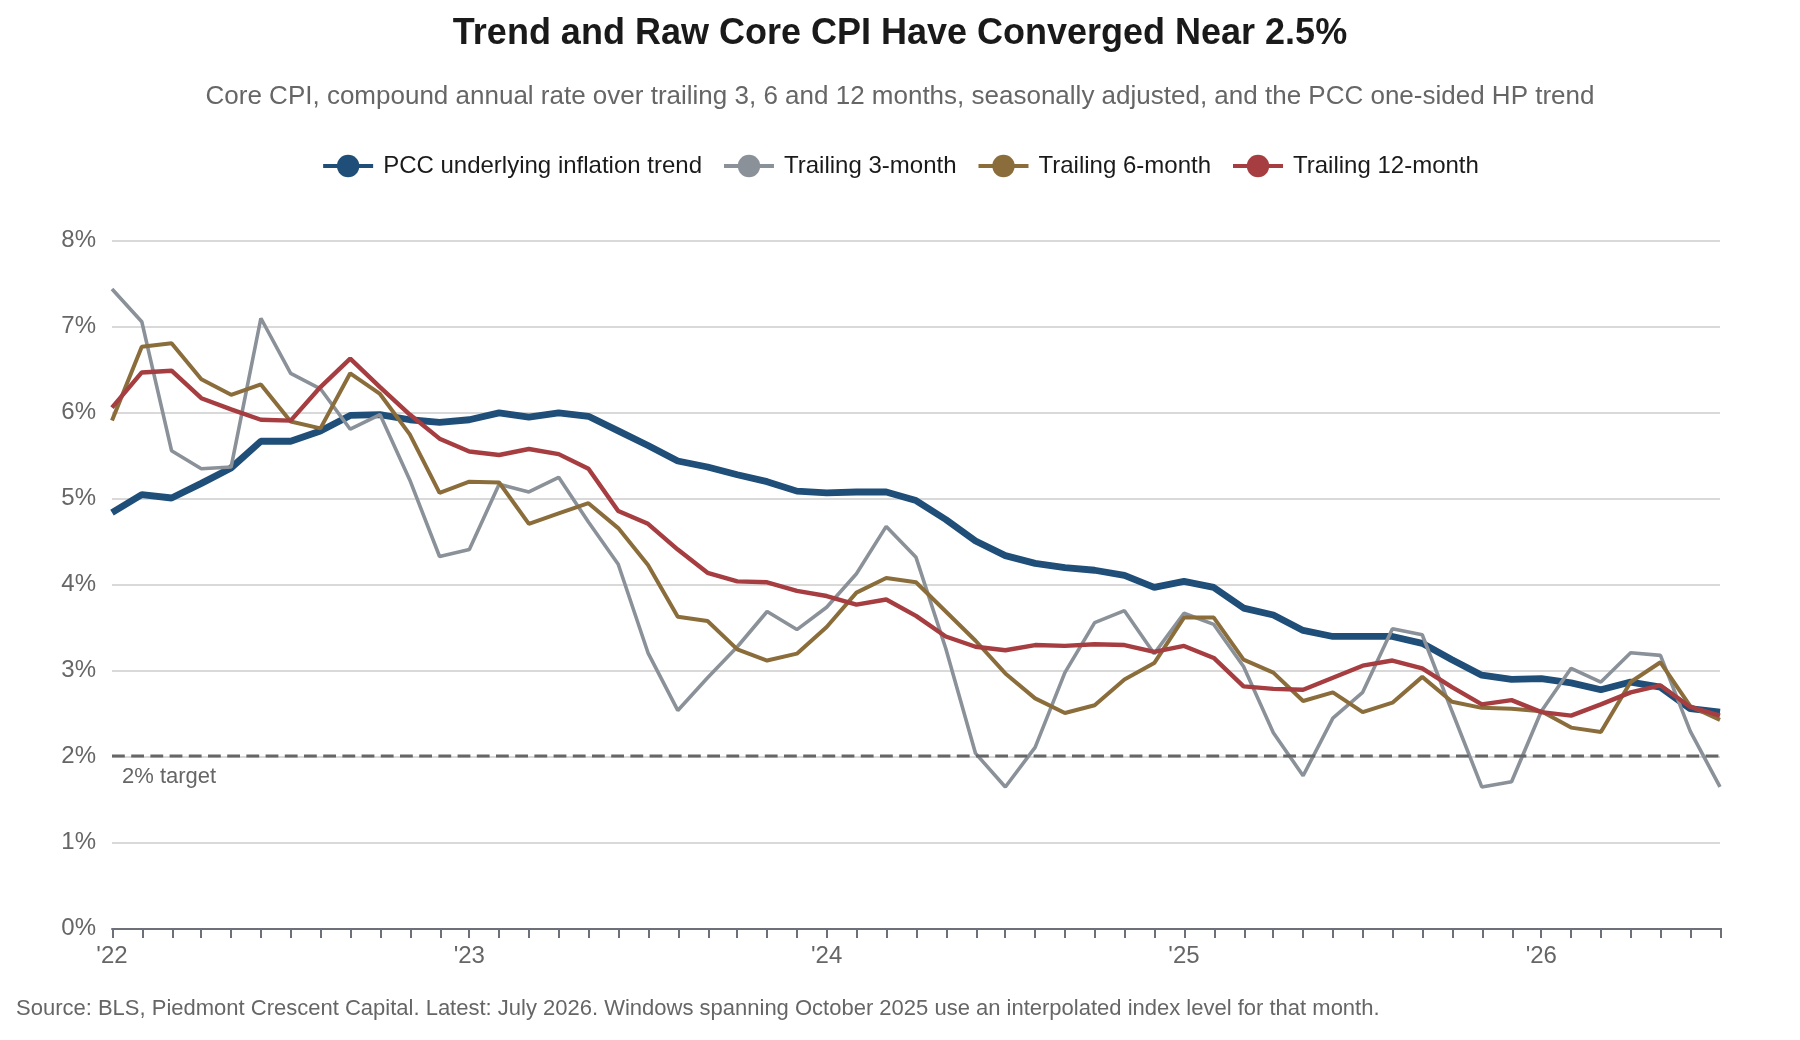
The standard objection to a filtered trend is that the estimate is least precise at the endpoint, which is exactly where a reader most wants to rely on it. This month we add a cross-check that answers the objection with data rather than a caveat. Core CPI has risen at a 1.6% annual rate over the past three months, a 2.4% rate over the past six and a 2.5% rate over the past 12. The filter’s 2.51% sits inside that range and closest to the longest window, which is the behavior you would want from a trend estimate and not the behavior you would see if the filter were manufacturing the result. When the raw compounding and the filtered estimate land on the same number from four different windows, the endpoint problem is not doing much work.
Methodology note. We apply a one-sided Hodrick-Prescott filter to monthly annualized inflation with the standard monthly smoothing parameter (λ = 129,600), computed on seasonally adjusted CPIAUCSL and CPILFESL from a 2000 sample start. The one-sided implementation uses only data available through the current month, so the estimate is real-time and does not revise as future data arrive. October 2025 has no CPI observation because of the 2025 lapse in appropriations; we interpolate the index level geometrically between September and November, which moves the trend estimate by less than a basis point. The Cleveland Fed measures are shown here as 12-month percent changes of the published index instead of 12-month averages of the monthly annualized rates, which puts them on the same footing as the Dallas Fed series and changes the June readings by about a basis point.
Shelter and Light Vehicles: The Transmission Channels Are in Low Gear
Monetary policy reaches consumer prices mainly through two interest-sensitive channels, housing and light vehicles, and both are visibly cold in this report. Shelter rose 0.1% in July, matching June, and is up 3.2% over the past 12 months. Owners’ equivalent rent, which alone carries a 25.8% weight, rose 0.3%, rent of primary residence also rose 0.3%, and lodging away from home fell 2.8% as the last of the World Cup premium came out of room rates. Because shelter carries better than a third of the index, a category running near 3% and decelerating is the single most powerful argument that the core rate’s descent has further to run.
The vehicle channel tells the same story with different numbers. New vehicle prices rose 0.1% in July and are up 0.5% over the past year, which is close to flat in a category that accounts for 3.8% of the index. Used vehicles rose 0.4% on the month but are down 1.9% over the year. Motor vehicle insurance has subtracted from the core in every month this year, and it fell another 0.3% in July after a 2.0% June decline, leaving it down 4.5% over 12 months. A sector that is not moving units at these financing rates does not generate sustained price pressure, and the insurance line is the lagged echo of the vehicle price surge now rolling out of the data.
Technology Prices: The Memory Shock Arrives
We flagged technology goods for special attention in the June report, where the pass-through from soaring memory-chip costs was visible only as slower deflation. In July it arrived as prices. Information technology commodities rose 1.4% on the month, and computers, peripherals and smart home assistants rose 3.5% and are now up 3.9% over the past 12 months, against a 0.8% decline over the year as of June. Education and communication commodities rose 1.3%. Televisions rose 1.7% and video and audio products rose 1.2% and are up 2.4% over the year.
This is a category built to fall as quality improves, and a positive 12-month print in computers is genuinely unusual. The tech aisle has stopped subtracting from core goods prices and started adding to them, and it did so in the same month that core goods overall rose 0.2%. The offsetting piece is that the category is small, roughly 0.3% of the index for computers and 0.7% for information technology commodities together, so the arithmetic contribution is a basis point or two. What matters is the direction: one of the few reliable sources of core goods deflation appears to have turned, and it turned in the same stretch in which tariff effects have been washing out of the rest of the goods basket.
Real Earnings: The Reprieve Lasted One Month
The companion release undid June’s good news. Real average hourly earnings fell 0.1% in July, a 0.1% nominal wage gain overtaken by the 0.1% rise in consumer prices, and are down 0.2% over the past 12 months after turning positive in June for the first time in a year. Real average weekly earnings were unchanged on the month and are up 0.1% over the year, helped by a 0.3% increase in the average workweek. For production and nonsupervisory workers, real hourly pay was unchanged in July and is down 0.1% over 12 months.
Nominal average hourly earnings are up 3.15% over the past year against a 3.4% rise in consumer prices, which is the arithmetic of the squeeze in one line. The paycheck problem we have tracked all year is not resolved, and June looks in hindsight like what it was, a month in which a 0.4% decline in the price level flattered a 0.3% wage gain. Wage growth running below the headline rate is not, however, the profile of a wage-price spiral, and it is one more reason to doubt that the underlying trend has any upward momentum left in it.
What Households and Markets Expect
Households eased off a little. The New York Fed’s July Survey of Consumer Expectations put the median one-year inflation expectation at 3.6%, down a tenth from June, with the three-year measure unchanged at 3.3% and the five-year measure unchanged at 3.0%. Median expected household income growth held at 3.0% and expected spending growth slipped to 4.9%. The credit detail was the softer part of the survey, with the perceived probability of missing a debt payment in the next three months up 1.2 percentage points to 12.0%.
Markets are more settled than households. The five-year, five-year forward inflation compensation measure stood at 2.31% on August 11, close to the level consistent with the 2% PCE objective once the CPI-PCE wedge is accounted for. That gap between a household survey at 3.6% and a market measure at 2.31% is not new, and it is the reason we weight the market series more heavily. Households extrapolate from the price level they see at the pump and the register, which is up 14.7% on energy over the past year, while the forward market prices the policy stance. The Committee should take more comfort from the second than discomfort from the first, though a three-year household expectation at 3.3% is not a number anyone at the Fed will describe as anchored.
Our Call · Hold in September
The underlying trend is moderating, and July added to the case. Our filtered estimate fell to 2.51%, its third consecutive decline and the lowest since March 2021, and the raw compounding agrees: core CPI has risen at a 1.6% annual rate over three months, 2.4% over six and 2.5% over 12. The Cleveland measures sit at 2.71% and 2.63% and the Dallas trimmed mean PCE at 2.23%, its lowest since July 2021. Four measures built on different principles are converging near two and a half percent, and the one clear exception in this report, core services outside of shelter, is concentrated in medical care and air travel and has not yet repeated.
Monetary policy is already tight, and the two channels that carry it are stuck in low gear. The funds rate at 3.50% to 3.75% against a core rate of 2.5% is a positive real rate, and policy works on prices with long and variable lags that have not finished running. The evidence that the stance is biting sits in this report: shelter up 0.1% for a second month and 3.2% over the year, new vehicle prices up 0.5% over 12 months, motor vehicle insurance down 4.5%, and core goods up 0.8%. Housing and light vehicles are where a restrictive funds rate shows up first, and neither is generating price pressure.
We expect the Committee to hold in September, and we think it should. Three colleagues dissented in July in favor of a quarter-point increase, and they are right about the record: inflation has run above target for 64 consecutive months and averaged 4.0% over that stretch. They are early, however, on the question in front of them. Adding restraint on top of restraint that has not finished arriving, through channels that are already cold, is how a committee discovers 18 months later that it went too far. Nor does anything here argue for a cut, with the unemployment rate at 4.1% and July’s soft payroll print better explained by an unusually long summer than by a turn in the cycle. We hold our no-cut base case for 2026 and now see the hike tail as smaller than it looked on July 31. The test we would fail on is straightforward: two or three more months of core services outside of shelter running near 0.4%, with shelter no longer decelerating, would tell us the stance is not as restrictive as we think.
Appendix: Trend Inflation Estimates
| Measure | Latest | Prior month |
|---|---|---|
| PCC HP-filter trend, core CPI (one-sided, λ=129,600) | 2.51% (Jul) | 2.55% (Jun) |
| PCC HP-filter trend, headline CPI | 2.78% (Jul) | 2.96% (Jun) |
| Core CPI, compound annual rate over three months | 1.64% (Jul) | 2.29% (Jun) |
| Core CPI, compound annual rate over six months | 2.42% (Jul) | 2.58% (Jun) |
| Cleveland Fed median CPI (12-month percent change) | 2.71% (Jun) | 2.85% (May) |
| Cleveland Fed 16% trimmed-mean CPI (12-month percent change) | 2.63% (Jun) | 2.91% (May) |
| Dallas Fed trimmed mean PCE (12-month rate) | 2.23% (Jun) | 2.41% (May) |
| Core CPI, official 12-month | 2.5% (Jul) | 2.6% (Jun) |
Computation notes. HP-filter estimates were computed on seasonally adjusted FRED series (CPIAUCSL, CPILFESL) through July 2026, sample from 2000, one-sided recursive expanding-window implementation, λ = 129,600, applied to monthly annualized inflation. The July index levels were derived from the seasonally adjusted category effects published in Table 6 of the BLS release, which give the all items change as 0.075% and the core change as 0.216% before rounding. Cleveland Fed values are 12-month percent changes of the published median and 16% trimmed-mean indexes through June 2026; the Cleveland Fed’s July readings are released later on CPI day and are not reflected here. Dallas Fed trimmed mean PCE is the published 12-month rate through June 2026.
Mark P. Vitner – Chief Economist, Piedmont Crescent Capital
mark.vitner@piedmontcrescentcapital.com · (704) 458-4000
Sources: U.S. Bureau of Labor Statistics, Consumer Price Index and Real Earnings, July 2026; Federal Reserve Bank of Cleveland, median and 16% trimmed-mean CPI; Federal Reserve Bank of Dallas, trimmed mean PCE; Federal Reserve Bank of New York, Survey of Consumer Expectations, July 2026; Federal Reserve Bank of St. Louis (FRED). Trend estimates and chart calculations by Piedmont Crescent Capital.
Disclaimer: This report is provided for informational purposes only and does not constitute investment, legal, tax, or accounting advice, nor an offer or solicitation to buy or sell any security. Information is drawn from sources believed to be reliable, but its accuracy and completeness are not guaranteed. Views expressed are those of the author as of the date of publication and are subject to change without notice. Past performance is not indicative of future results.