
Residential Construction Outlook · Summer 2026
The Map Has Flipped
Dispersion, Regulation and a New Municipal Math
The House View
- National home price numbers are the least informative metric on housing right now. Case-Shiller national appreciation has spent twelve straight months between 0% and 2%, the longest such run since 1992-93. That apparent calm is an artifact of averaging two markets moving in opposite directions.
- Dispersion is ordinary in size and unprecedented in composition. The spread between the 80th and 20th percentile of the twenty Case-Shiller metros is 4.2 percentage points against a 2000-2026 average of 8.0. But on our scoring of every May cross-section since 1988, this is the first year in which Midwest and Northeast metros hold the entire top five while Sun Belt metros hold three of the bottom five.
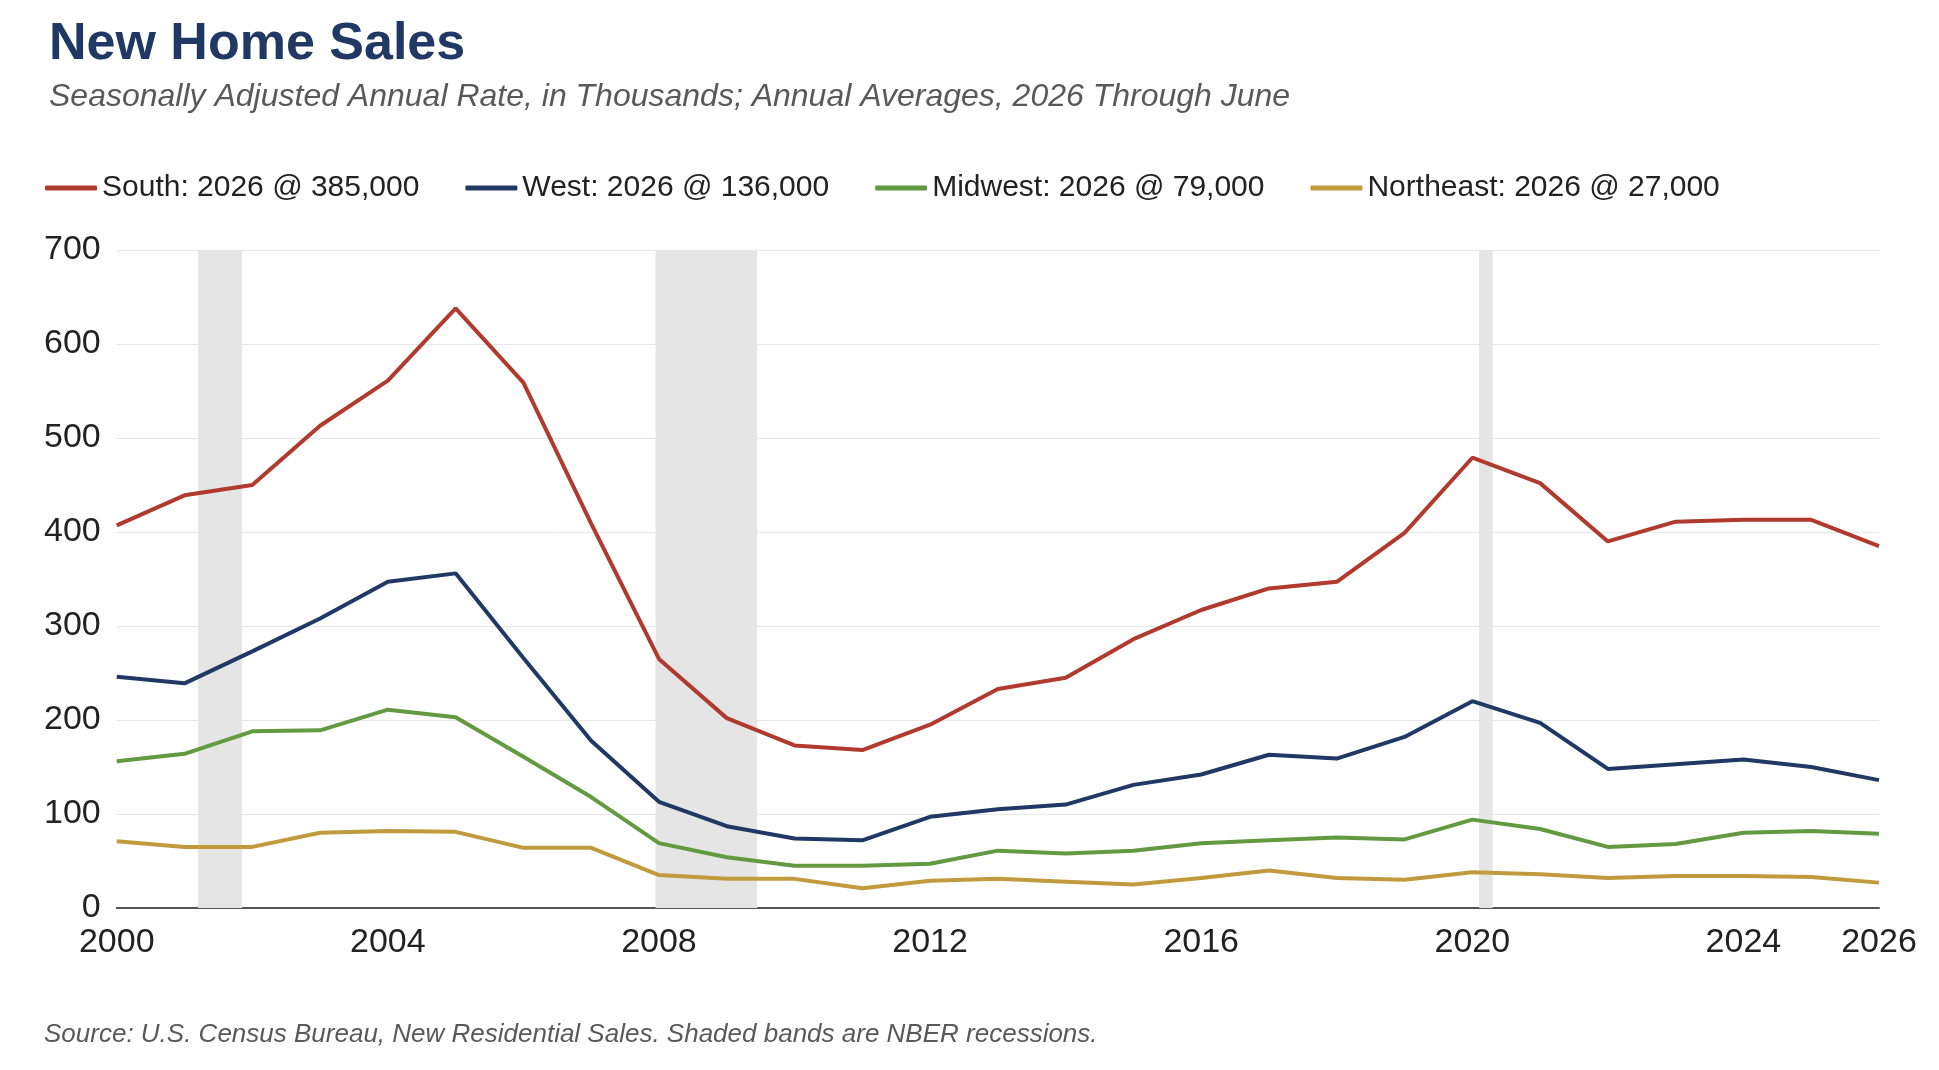
- Our July 31 forecast puts total housing starts at 1.340 million in 2026 and 1.360 million in 2027. What the total conceals is the mix. Single-family starts fall to 890,000 this year from 941,000 in 2025 and recover only to 940,000 in 2027, while multifamily rises to 450,000 before easing to 420,000. On rates we have the thirty-year mortgage finishing 2027 at 6.64%. That follows from a firmer real economy. New home sales are forecast at 636,000 in 2026.
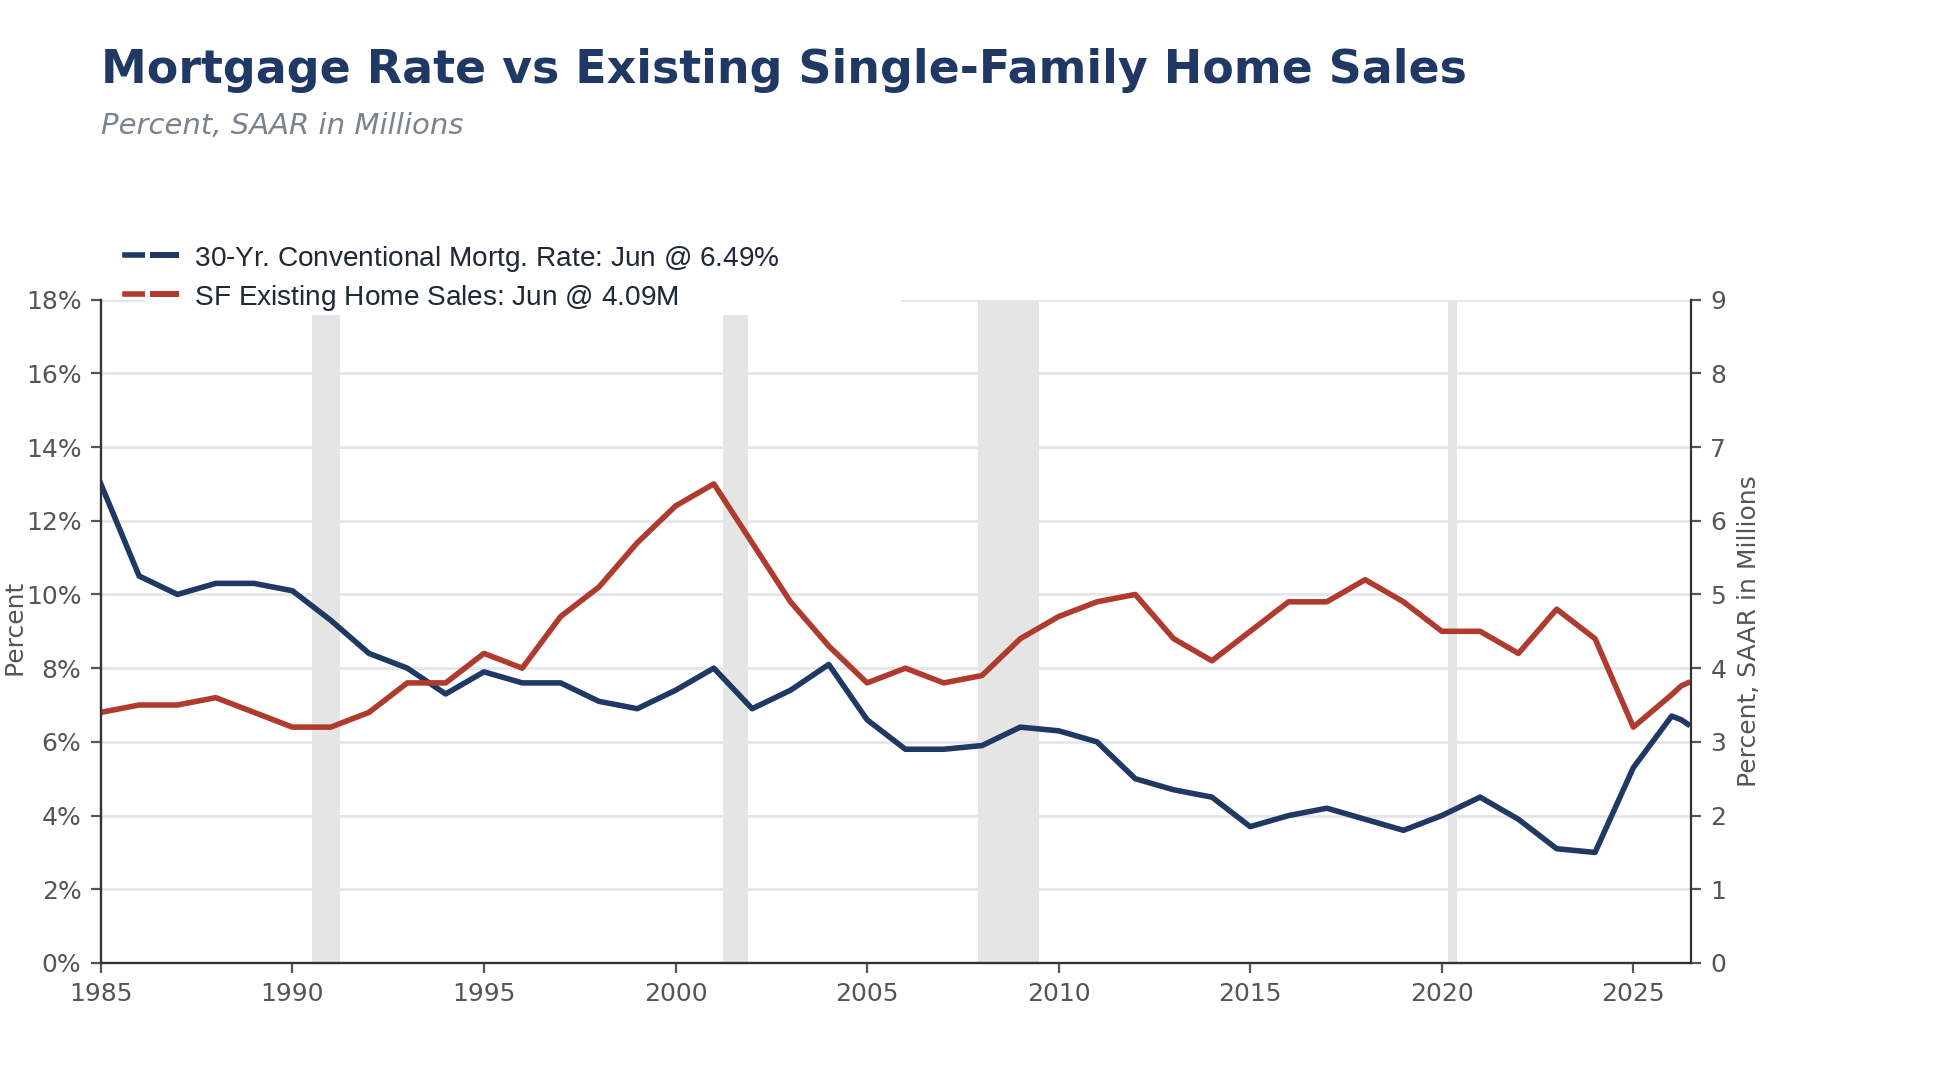
- Mortgage lock-in releases in 2029, not 2027. The share of outstanding mortgages below 5% is running off at roughly 1.1 percentage points a quarter. That reaches 50% in 2029. End-2027 gets to about 59%. Policy could in principle speed this up, but nothing currently on the table will. Roughly 23% of outstanding mortgages, the FHA, VA and USDA book, are already assumable, and that produced about 6,000 assumptions in 2023. FHFA has said since November 2025 that it is evaluating portability and has shipped nothing. The MOVE Act (H.R. 10028), introduced August 3, would direct the GSEs to buy portable mortgages, and it is still new with no score. The fifty-year mortgage has been shelved and was never a mobility fix in any case.
- Builders will cut starts before they cut base prices. The committed share of a builder's budget does not fall when demand does, so the adjustment runs through volume, incentives and margin.
- Regulation is the structural constraint; input costs are the cycle. The regulatory share of a new home's price has risen through two booms and two corrections. This year's 5.8% increase in construction input costs is largely a trade-policy event and could reverse.
- Watch the municipal ledger. Whether new growth pays for its own infrastructure is becoming a jurisdiction-by-jurisdiction question, and it is already showing up in impact fees and infrastructure-finance legislation from Arizona to Texas to Tennessee to San Francisco. The likely beneficiary is infill, though the Opportunity Zone program is tilting the other way.
1. The Bottom Line
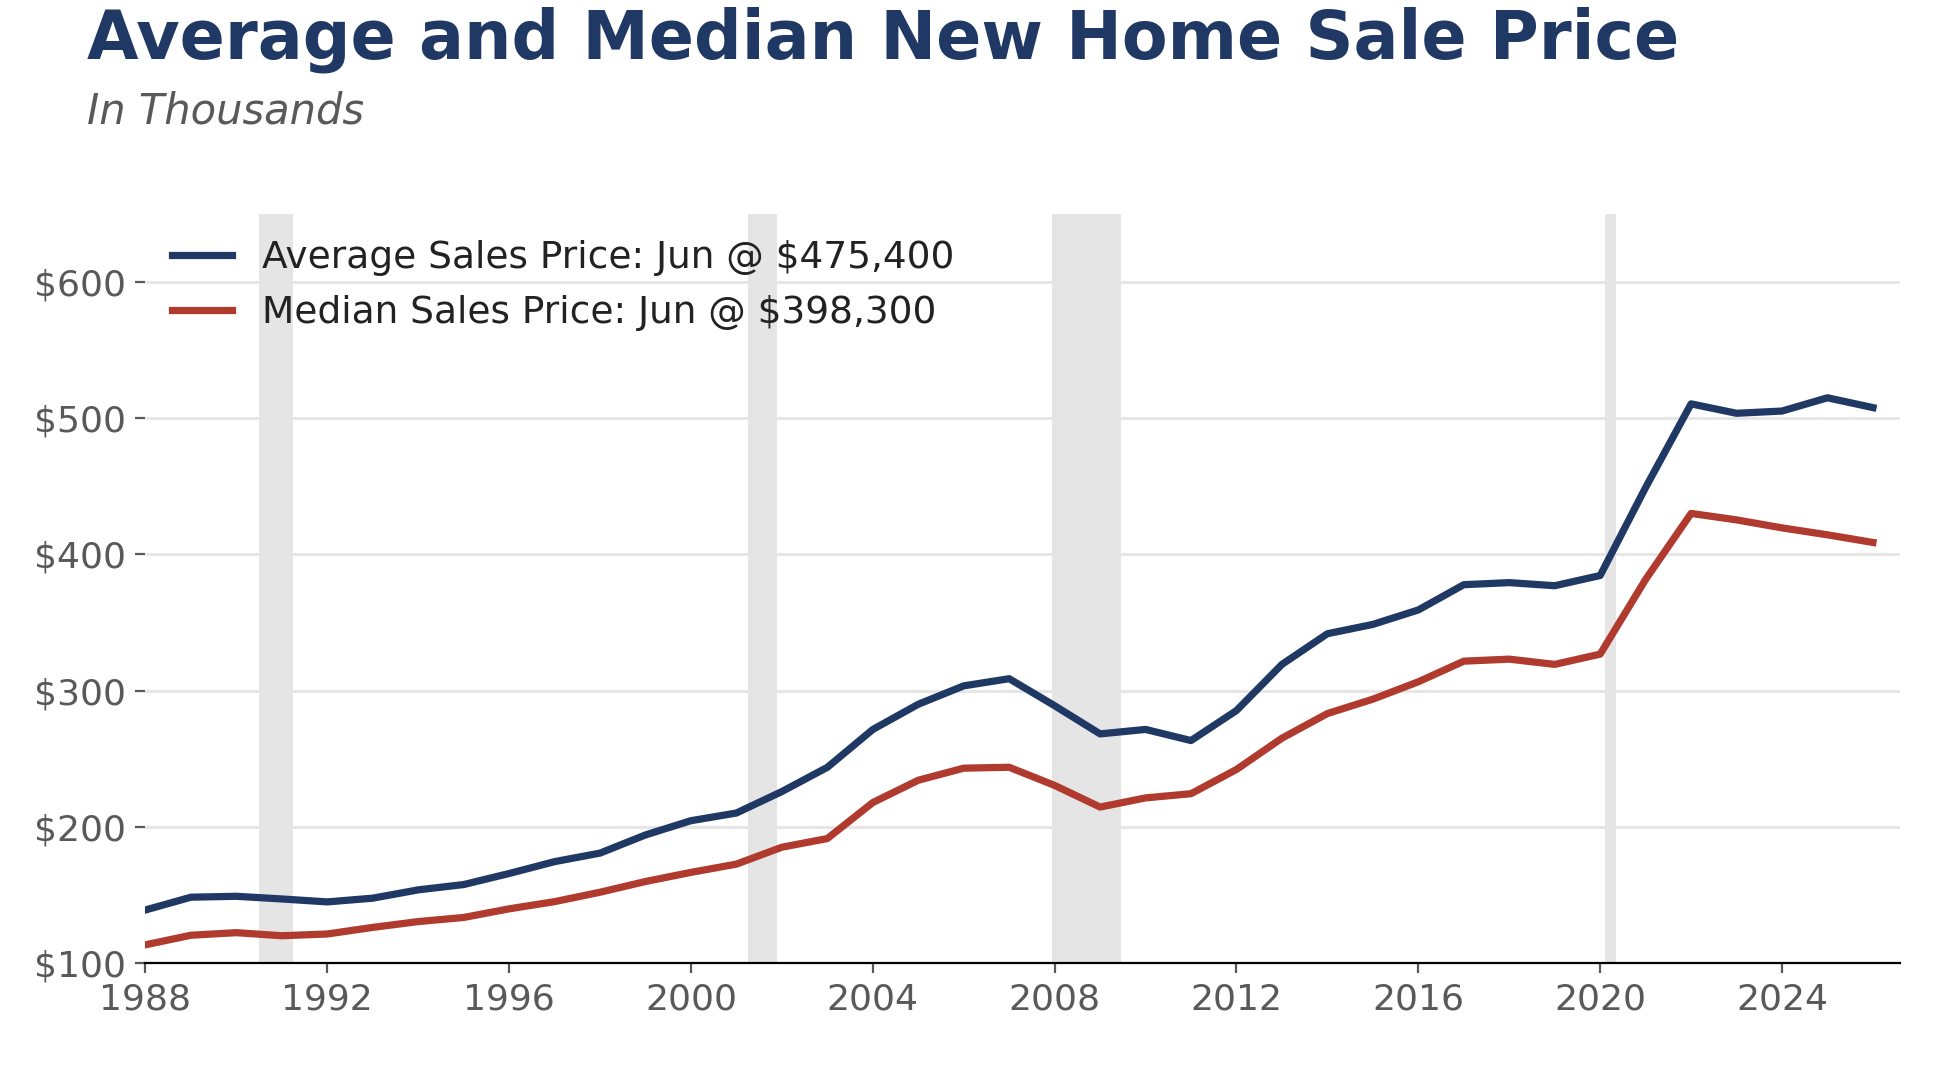
The residential construction market is cooling at two different speeds. Existing home sales fell to a 4.06 million annual rate in July, up 0.7% from a year earlier but still more than 20% below the 5.27 million pace of mid-2019, while new home sales of 628,000 in June were 5.6% below their year-ago level. Affordability is holding demand back in both markets, and only part of the steeper affordability hurdle is cyclical. The rest is a cost problem on the supply side, and three pieces of it stand out. Regulatory compliance now accounts for 26.4% of a new home's price, or $131,734, more than 40% above the 2021 figure. Input costs for single-family construction have risen about 20% over the same period and 5.8% in the past year alone, with 5.2 points of that gain landing in the first six months of 2026. And 17 consecutive quarters of tightening acquisition, development and construction credit have made builders more selective about where they are building going forward, favoring higher-margin developments versus starter homes. Regulation has grown roughly twice as fast as the materials and labor that actually go into the house, which is why we treat it as the structural constraint and the rest as the cycle.
Underneath the national picture, a shifting migration wave is reshaping where housing demand holds up best, though the shift is not the one usually described. The great arbitrage out of the high-cost Northeast and West Coast into Texas, Florida and the Mountain West has faded, mostly because those destinations stopped being cheap. Florida is the clearest case. Net domestic migration into the state peaked at 310,892 in the year ended July 2022 and fell to just 22,517 in the year ended July 2025, a decline of 93%. Georgia has not followed it down, however. Georgia drew 27,300 net domestic migrants over the same twelve months, more than Florida did, and the figure was up from 25,321 a year earlier but down from the 94,836 the state drew just after the pandemic. International migration is still adding to Georgia's total, but the shift that matters is where the new residents are settling.
The redistribution runs from the core to the fringe and from the large metros to the smaller ones. All five of metro Atlanta's core counties, Fulton, Gwinnett, Cobb, DeKalb and Clayton, now post negative net domestic migration, while the exurban ring is among the fastest-growing territory in the country. Jackson County grew 5.3% in the year ended July 2025 and Dawson County 4.2%, ranking fourth and ninth nationally, and Barrow, Cherokee, Paulding, Forsyth and Hall all outpaced the metro Atlanta area as a whole. Affordability is the reason. A median mortgage payment took 25% of median income in metro Atlanta in 2019 and takes 41% today, and the deterioration in the suburbs and exurbs was larger than in any other metro above five million people. Growth is moving to smaller metros as well, most notably Savannah, which is growing 1.6% a year, and Knoxville and Chattanooga, where 86% of Chattanooga's population gain since 2020 has come from domestic migration despite a natural decrease. Some of those new residents come from metro Atlanta.
Nashville is the case where the two halves of the story separate. Affordability there is more stretched than in Atlanta, with a median home price near $480,000 in July 2025, up 62% from 2019, and 46% of a median household's income required to carry it against a 30% benchmark. Growth has not yet responded. Davidson County added 9,281 people in the year ended July 2025, the largest gain of any Tennessee county, and did so while international migration into the county fell 58%. Tennessee's statewide domestic migration has declined for three straight years, from 58,206 in 2023 to 42,389 in 2025, so the slowdown is real at the state level even where the core county is still gaining.
The Carolinas are riding a broad-based capital-investment cycle and remain the top destination for people moving within the U.S. North Carolina led the nation in net domestic migration for the year ended July 2025 at 84,064, up from 82,288, and South Carolina was the fastest-growing state in the country at 1.5%. Popular Carolinas destinations are still more affordable than the typical large metro, though the margin has narrowed sharply. House prices have outrun incomes by roughly three to one since 2019, with the FHFA index up 82% in Charleston, 78% in Charlotte, 76% in Greenville and 69% in Raleigh against 61% nationally, while median household incomes in the core counties rose 26% to 31%. Raleigh, Columbia and Greenville still price below the national ratio of home value to income, Charlotte has converged to it and Charleston has surpassed it.
A newer question is starting to shape how far that wave can run, which is whether the housing itself pays for the roads, sewer lines and schools it requires. Our survey of cost-of-community-services literature says residential development generally does not. Kotchen and Schulte's 2009 meta-analysis of 125 such studies, published in the International Regional Science Review, puts the mean ratio of local expenditure to revenue at 1.18 for residential land, meaning local government spends $1.18 servicing a residential parcel for every $1.00 of revenue it collects from it, against 0.44 for commercial and industrial and 0.50 for farm and open space, and the gap is driven overwhelmingly by schools rather than by pipes and pavement. That literature compares land uses rather than densities, so it does not by itself establish that the fringe is worse than infill, and at least one careful study finds per-capita service costs rising with density rather than falling. How local governments are behaving is not in dispute. Horry County adopted an impact fee schedule effective July 21, 2026 that charges $1,615 on a 1,500 square foot house, 54 Georgia jurisdictions are authorized to charge impact fees and 44 actually do, at an average single-family fee of $2,440, with Cherokee and Forsyth counties collecting more than $8 million a year each. North Carolina counties lack the authority to charge school impact fees and reach instead for adequate public facilities ordinances, which slow the fringe rather than price it.
Population growth is also picking up in parts of the South that grew slowly for years, though the list is shorter than it looks and the strongest single signal is a construction signal rather than a population one. Alabama drew 23,400 net domestic migrants in the year ended July 2025 and Arkansas 14,500, and Arkansas was one of only five Southern states where the figure rose from the prior year. Baton Rouge is the standout. It ranked first among all 360 metro areas in construction employment growth over the twelve months ended June 2026, at 22% and 10,200 jobs, in a period when fewer than half of all metros added construction jobs at all. Permits in East Baton Rouge Parish have risen 142% in two years. Some of that is petrochemical and industrial rather than residential, so we would not read it as a pure housing signal. Gulfport-Biloxi is a different case, since its construction payrolls were flat over the same twelve months, though it posted the strongest population growth of the three at 0.9% and permits up 8.4%. Memphis is the weakest on fundamentals, with population down 0.3% and construction employment up only 3%, but permits rose 17.4% in the first half, which is a genuine turn against a soft demographic backdrop. Huntsville and Daphne, Alabama, and Fayetteville-Springdale-Rogers, Arkansas carry none of those qualifications.
2. Dispersion: Ordinary in Size, Unprecedented in Composition
The most quoted number in housing is also the least useful one at the moment. The S&P Cotality Case-Shiller national index rose 1.1% in the year through May, and it has now spent twelve consecutive months inside a 0% to 2% band. We ran the full index history back to 1987 to see how unusual that is. Only two comparable episodes exist, an eleven-month stretch from May 1995 to March 1996 and a twenty-month stretch from January 1992 to August 1993, and the period between them never cleared 2.9%. Nothing in 2006-07 or 2011-12 qualifies, because those were fast transits through zero on the way to deep negatives. This is the first sustained sub-2% national stretch in thirty years.
That calm disappears at the metro level, however. Seven of the twenty Case-Shiller metros are outright negative over the past year. Chicago is up 6.9%, New York 4.2%, Cleveland 3.1% and Detroit 3.0% on its April reading, while Las Vegas is down 1.9%, Seattle 1.8%, Denver 1.8%, Tampa 1.6% and Phoenix 1.3%, with Dallas and Portland also below zero. The national index is a weighted average of two markets moving in opposite directions, and it is the only place in housing where those markets look like stability.
Dispersion on the usual measure is not wide. The spread between the 80th and 20th percentile of the twenty metros is 4.2 percentage points, against an average of 8.0 points across the same May cross-section every year since 2000, and it ranks seventh-narrowest of twenty-seven readings. The widest were 2005 at 19.4 points and 2008 at 17.5. Dispersion is the wrong statistic on which to build a case that the housing market is fracturing. Street work on the same question has found that cumulative inventory growth since the fourth quarter of 2019 explains 73% of the variation in recent price performance across the largest metros. We agree on both counts, and would put the causal chain one step further back, because inventory did not appear on its own.
What is not ordinary is which markets now sit at each end. We scored every May cross-section from 1988 through 2026, ranking the twenty metros and comparing the average rank of the Sun Belt group against the Midwest and Northeast group. May 2026 produces the widest gap in the thirty-nine-year record, and it is the only year in which Midwest and Northeast metros hold four or more of the top five positions while Sun Belt metros hold three or more of the bottom five. Chicago, New York, Cleveland, Detroit and Boston are now the five fastest-appreciating markets in the country. In May 2019 and again in May 2022, Sun Belt metros held all five top slots and none of the bottom five. The reversal took about three years and first became visible in the May 2025 cross-section, which ranks second in the same record, so this is a regime that has held across two consecutive cross-sections rather than a one-month artifact.
The nearest historical analogues fail in instructive ways. The 1988 to 1992 period had Midwest and Northeast metros ranking well, but that was the coasts collapsing rather than the Sun Belt underperforming. The late 1990s had Sun Belt metros at the bottom, but the top was the West Coast and Cleveland was near the bottom as well. In 2008 and 2009 the Sun Belt occupied the very bottom, but the whole table was negative and the Midwest was only relatively less bad. What is new is the joint condition, a Midwest and Northeast sweep of the top with the Sun Belt in the bottom, while the national rate is still positive.
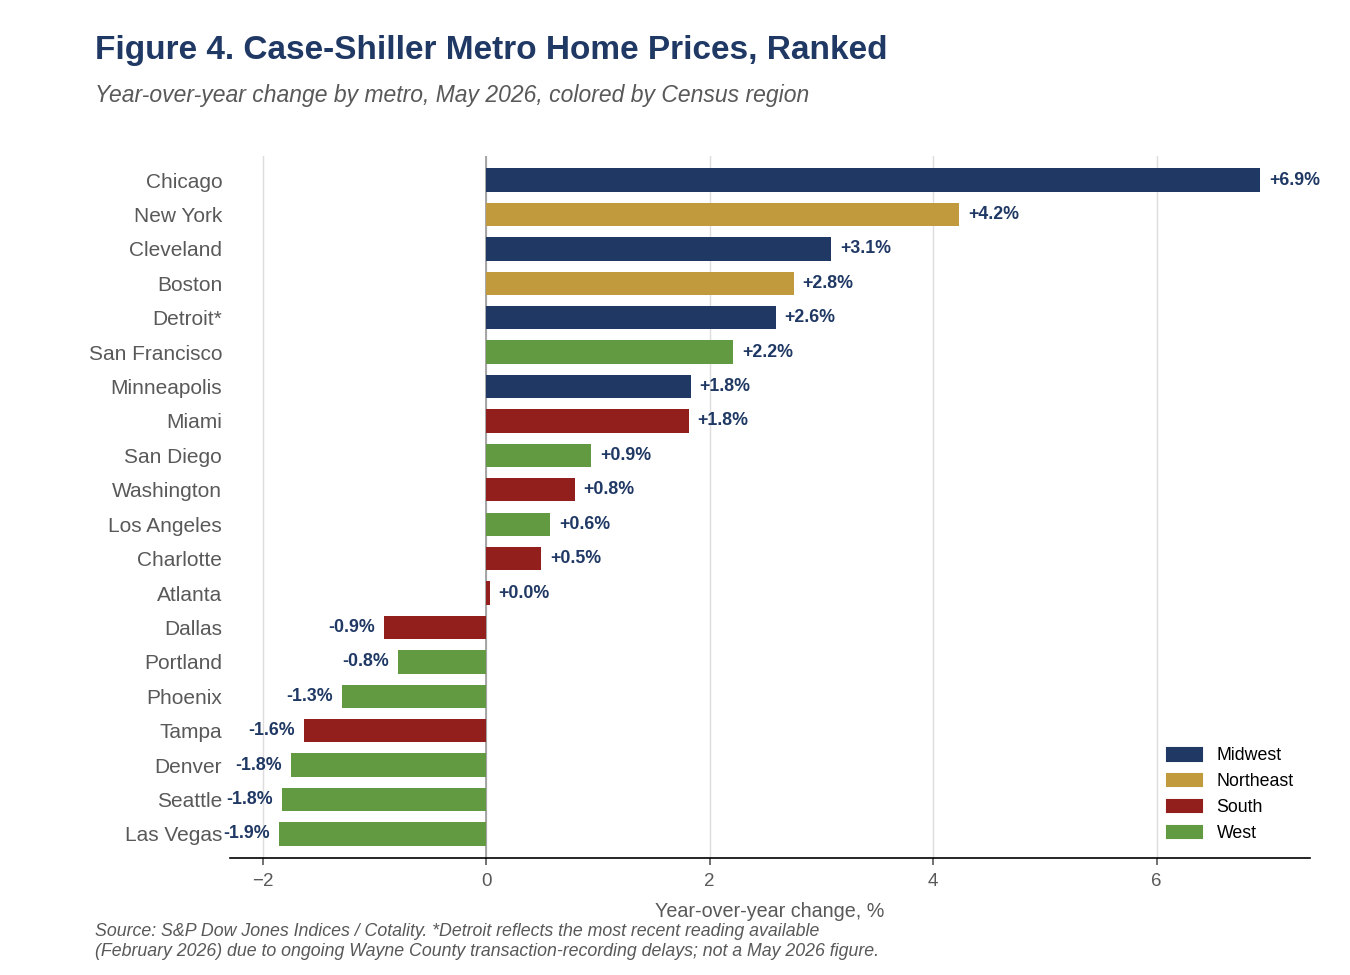
This is a supply story rather than a demand story. The metros now falling are the ones that permitted and built most aggressively after 2020. The metros now leading are the structurally supply-constrained legacy markets that were left behind in the pandemic boom. The leaders are not simply the cheapest markets mean-reverting, however. Miami is up 82% since January 2020 and Charlotte 72%, the two largest cumulative gains in the index, and both are still positive, while Portland at 38% and Minneapolis at 42% are among the smallest and are flat to negative. The correlation between cumulative gain since 2020 and current momentum is only 0.30. Appreciation is tracking how tight a market is rather than how much room it has left to catch up.
For a construction outlook the composition matters far more than the national rate. The dispersion is the migration wave and the supply response showing up in prices with a lag, and it puts the near-term risk in residential construction squarely in the markets that carried the last cycle.
Key Finding: The Fiscal Math Is Shifting
Residential development costs local governments about $1.16 in services for every $1.00 it returns in property tax revenue, and infill development saves roughly $21,000 per home in infrastructure costs against building at the metro fringe, which favors more apartment and townhome development. Where growth gets built is becoming as important as how much gets built.
3. What's Holding Back Construction
Builders have little room to fix this on their own, because most of what they spend is committed before a house is framed. NAHB's June 2026 cost-of-regulations study puts the regulatory share of a new single-family home's price at 26.4%, or $131,734 on an average sales price of $499,500 as of January, split between $84,939 incurred during construction and $46,795 during land development. That total is more than 40% above the $93,870 the same study measured in 2021. NAHB sets the increase against aggregate U.S. disposable income, which rose 18.3% over the same five years, and concludes that regulatory cost is climbing more than twice as fast as consumers' ability to pay. We would put it more carefully. Roughly two-thirds of the dollar increase is arithmetic, since the average new home price those percentages are applied to rose 26.7% over the same period. The genuine intensification is the share itself, which went from 23.8% to 26.4%, and all of that increase sits on the construction side.
The drivers are worth naming, because they are not the ones usually blamed. Changes to building codes over the past decade are the single largest item at $40,288 per home, up 67% since 2021 and accounting for two full percentage points of the 2.6-point rise in the regulatory share. Fees paid by the builder after the lot is purchased come next at $20,154, up 65%. Architectural design standards beyond the ordinary add $16,117, and land dedicated to the government or otherwise left unbuilt adds $13,593. The fastest-growing item in percentage terms is the pure cost of delay, up more than 70% on both sides of the project, which reflects seven months of average delay during land development and another six weeks during construction. Regulation on the development side actually fell as a share of price, from 10.5% to 9.4%, so the story is codes and fees on the vertical build rather than entitlement friction at the front end. The component estimates rest on 54 developer responses and 337 builder responses, so they are best read as directional.
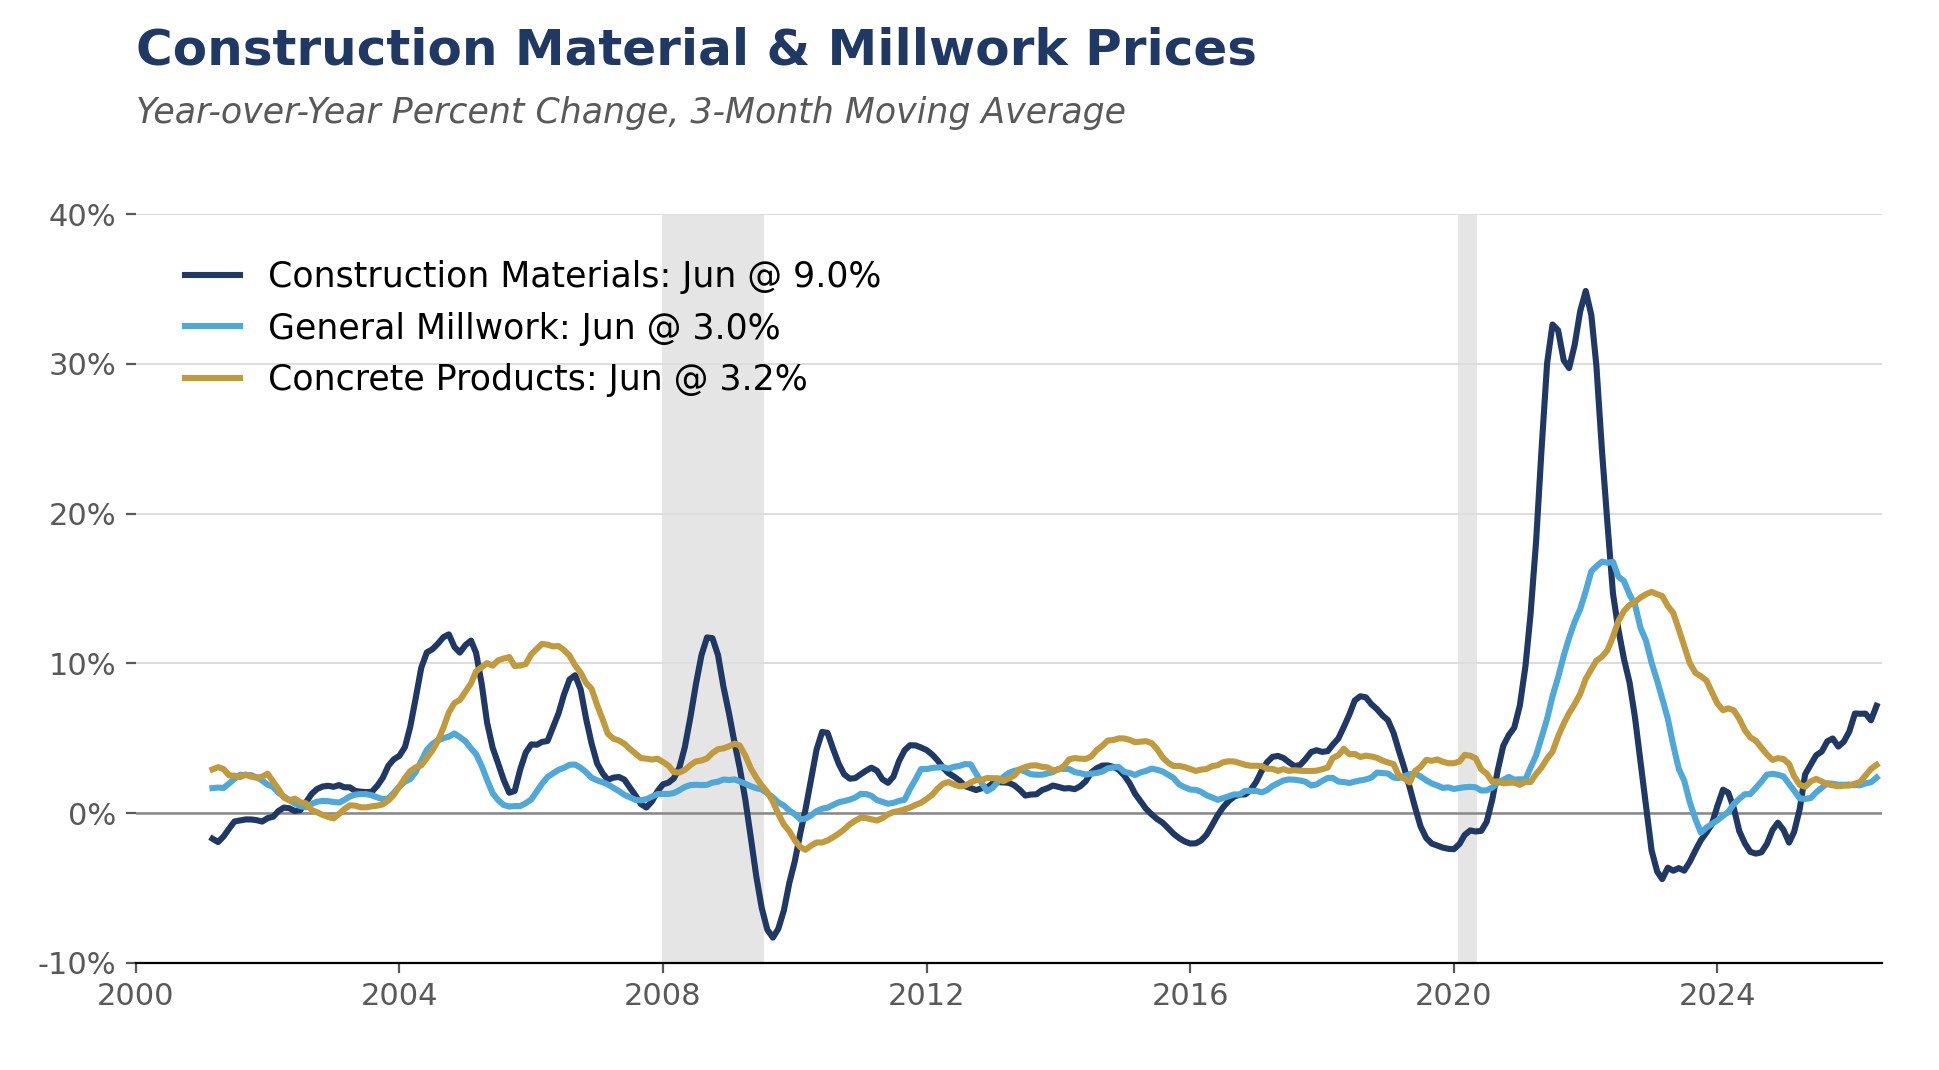
Materials have not settled either. Net input costs for single-family residential construction rose 5.8% over the year ended in June, and 5.2 points of that gain landed in the first six months of 2026 alone. The broader construction materials index, which carries heavier nonresidential weights, is up 9.0%, though a soft June 2025 base flatters that comparison. Measured against 2021, residential input costs are up about 20%, or roughly half the increase in regulatory cost over the same five years. Where the pressure sits matters more than the headline. Steel mill products are up 16.9% over the year and copper wire and cable 22.3%, while general millwork is up 3.0%, concrete products 3.2% and gypsum products are down 0.7%. The acceleration is narrow rather than broad, concentrated in the metals and lumber complex where trade policy has bitten hardest, and that concentration matters, because a builder can value-engineer around a finish material and cannot value-engineer around the structural frame or the wire in the walls.
Labor and credit round out the constraints. Associated Builders and Contractors estimates the industry needs 349,000 net new workers in 2026 and 456,000 in 2027 just to keep pace, with more than half of the 2026 figure needed simply to replace retiring workers rather than to support growth. Federal Reserve and NAHB surveys have now shown 17 consecutive quarters of net tightening in acquisition, development and construction lending standards. That squeeze falls hardest on smaller private builders, who lack the balance sheet to carry land and finished inventory through a slow patch, and it has concentrated production among the large publics. Combined with a land and development cost that does not scale down with the size of the house, it pushed the product mix up-market for most of this decade.
Acquisition, development and construction credit is the channel through which tight money actually reaches the housing stock. An AD&C facility is a short-term, floating-rate bank loan that funds land purchase, horizontal development and vertical construction, drawn in stages against inspections and repaid at closing. For private builders it is almost always personally guaranteed. The book has never recovered from the last cycle. FDIC data put one-to-four family residential construction and land development loans at $91.1 billion at the end of 2025, some 55% below the $204 billion peak of early 2008 in nominal terms and far below it in real terms. Because the interagency concentration guidance measures construction exposure against a bank's own capital, the constraint binds first at community and regional banks, which is where small private builders bank. The guidance is supervisory rather than a hard cap, but examiners treat the thresholds as though they were limits, and the practical effect is the same.
The pricing detail in NAHB's first-quarter survey shows exactly how this shapes what gets built. Effective rates ran 9.36% on land acquisition, 10.15% on land development, 11.22% on speculative single-family construction and 11.68% on pre-sold construction. The revealing movement is in points rather than rates. Points on land acquisition fell to 0.50% from 0.70% while points on speculative construction nearly doubled to 0.62% from 0.34%. Lenders are pricing away from unsold inventory risk specifically. Sixty percent of builders reporting tighter conditions cited reduced loan amounts and 53% cited personal guarantees. A builder facing an eleven-percent construction loan, a lower advance rate and a personal guarantee will underwrite the project with the thickest margin and the most reliable absorption, and that is rarely the entry-level subdivision on the edge of the metro. We would state this as a well-founded inference rather than a measured effect, since no study isolates AD&C tightness as a causal driver of price-point mix, but the supporting facts all point the same way.
The result is that we have both too much housing inventory and too little. New homes for sale represented a 9.3-month supply in June, and months' supply has run at or above nine months for most of the past year and a half. It was last this elevated in the second half of 2022, and before that in 2010, though the crisis peak was higher still at 12.2 months in January 2009, so this is elevated rather than extreme. Builders are carrying 118,000 finished, unsold homes. The homes on the market, however, are not the homes buyers need. New homes priced under $300,000 accounted for 40% of sales in 2020, fell to 14% by 2022 and have recovered only to 18% in 2025, while NAHB's affordability work finds that more than half of U.S. households cannot afford a $300,000 home. Realtor.com counts roughly 300,000 fewer listings below $350,000 than in June 2019, with affordable homes down to 37.6% of active inventory from 55.1%.
Builders have started to move back down-market, but not far enough. The median new home sold for $398,300 in June, about 10% below the $440,600 median existing home, a reversal of the premium new construction normally carries. What remains of the gap is being papered over with financing rather than with price. Lennar spent $54,947 per home on incentives in the second quarter, 12.9% of the gross price, against $12,074 in the third quarter of 2022, and gross margins have absorbed the difference.
Regulation is the structural cost problem; materials are cyclical. Input costs are cyclical and policy-driven, and a change in trade policy could reverse a good part of this year's increase inside of a year. The regulatory share has risen through two housing booms and two corrections, and nothing in the 2026 study suggests it retreats.
4. The Shifting Migration Wave
The five-state frame
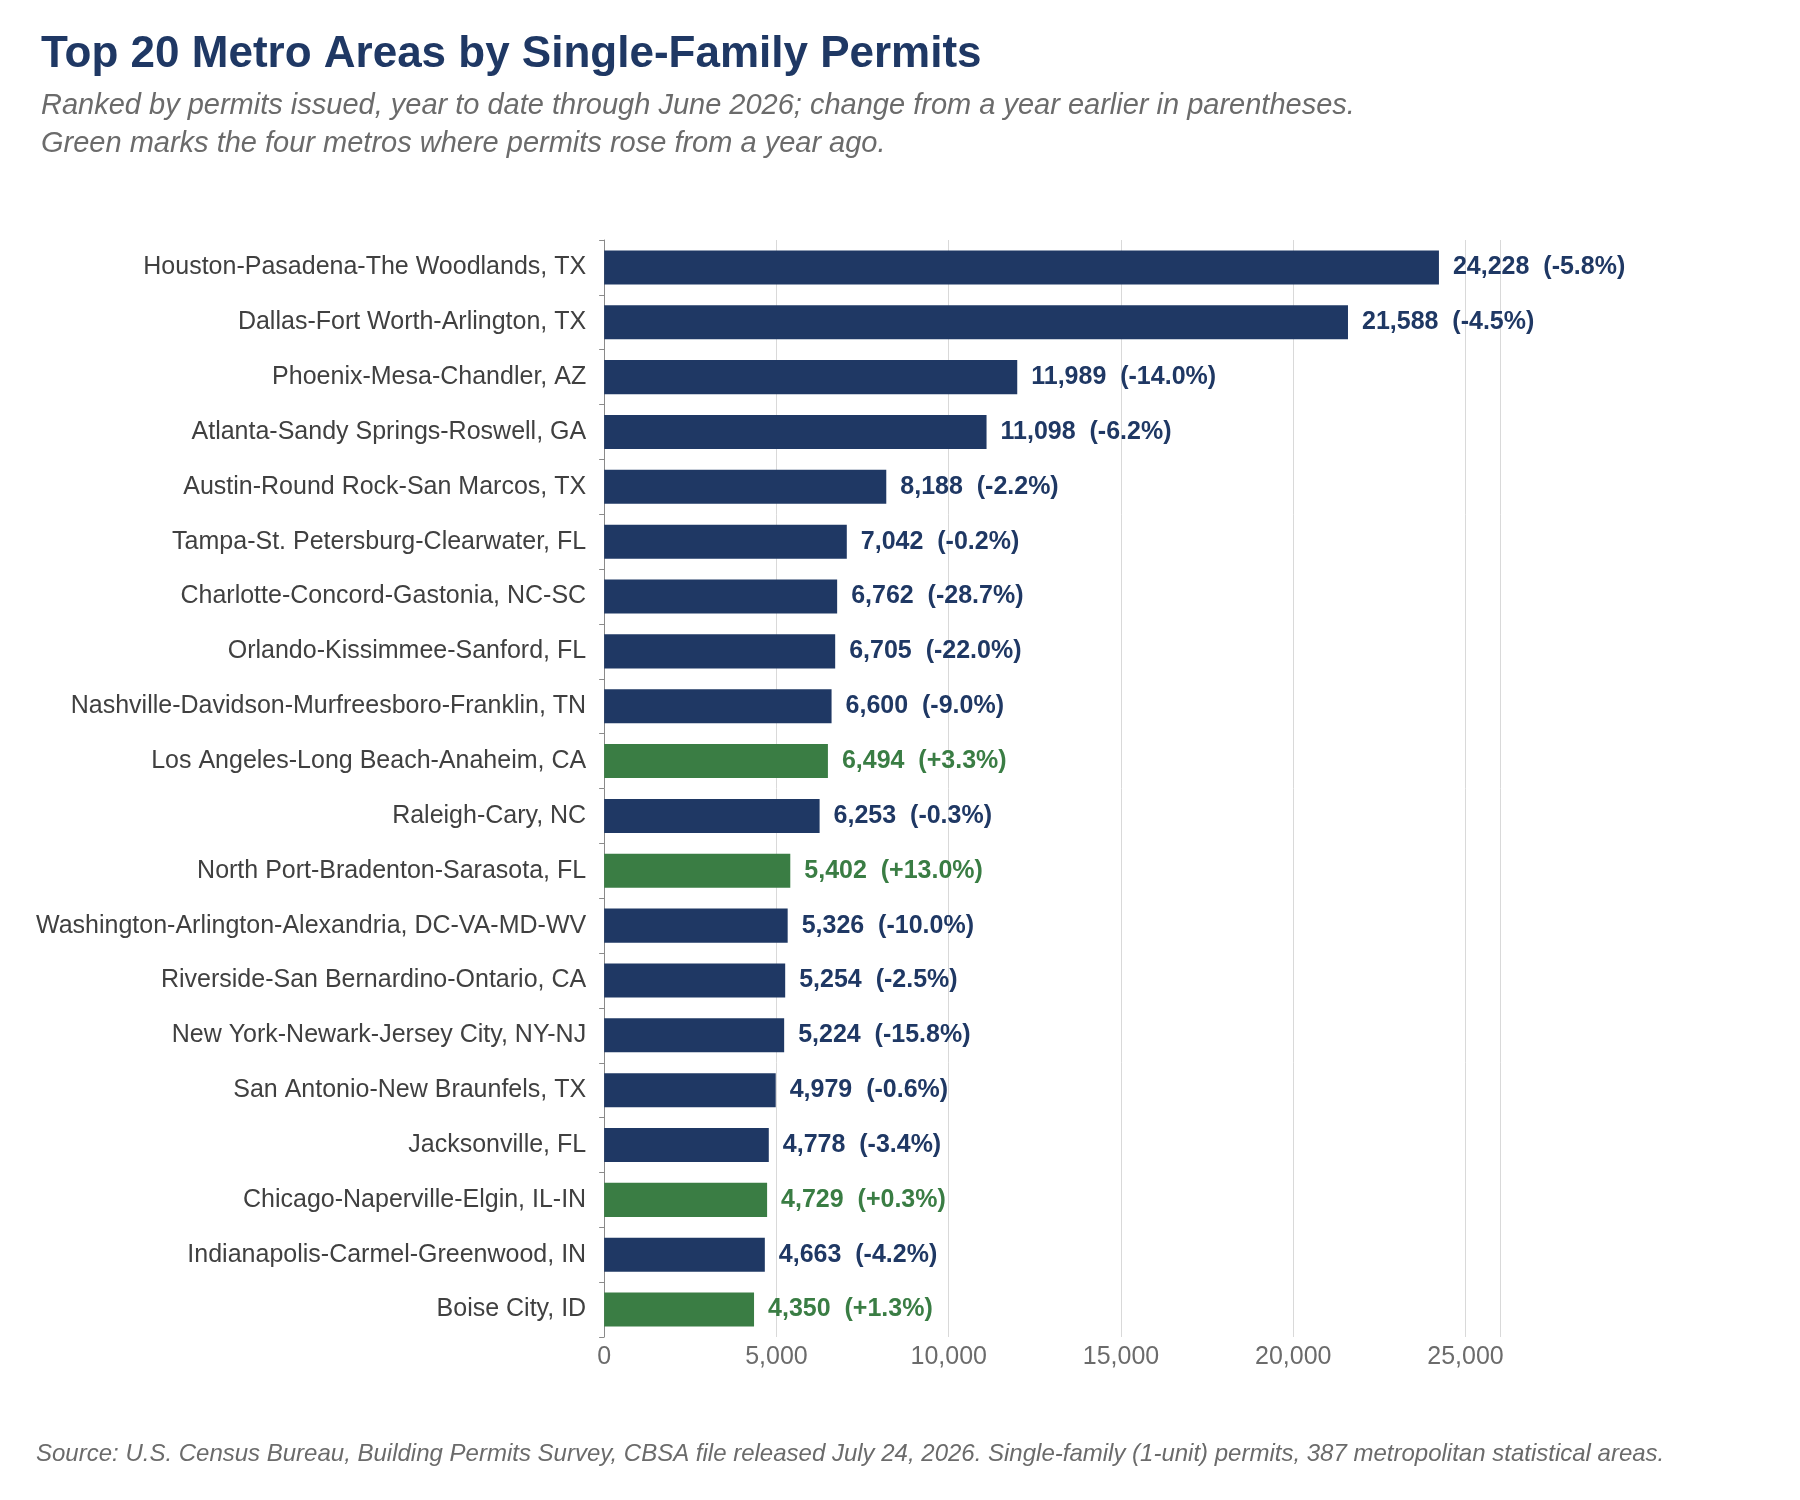
The regional framework rests on where each state sits in the migration cycle rather than on its current growth rate. Florida shows what happens after a wave crests, and its cost structure is now the binding problem rather than its migration rate. The average homeowners insurance premium reached $8,292, or 2.8 times the national average, and Citizens Property Insurance's policy count has fallen from a peak of 1.41 million in October 2023 to 278,246 at the end of June 2026, an all-time low, as private carriers re-entered the market. Rising insurance cost is itself a supply factor, since it pushes second-home and investment owners to list, and that is part of why Tampa sits where it does in Figure 4, and part of what is happening in the Miami condominium market. The Carolinas show what the same wave looks like while cresting, with North Carolina first in the nation at 84,064 net domestic migrants for the twelve months ended July 2025 and South Carolina third at 66,622, with Texas between them at 67,299.
Georgia and Alabama sit earlier in the same cycle, still awaiting the population lift their capital investment implies. Georgia's case centers on Rivian's $6.6 billion, DOE-backed electric vehicle plant near Social Circle and the existing Hyundai Metaplant and SK Battery complex near Savannah; Alabama had a record 2025 with 234 announced projects representing $14.6 billion in investment, anchored by Eli Lilly's $6 billion Huntsville facility. U-Haul's index is worth a glance for confirmation even though it lags. The company publishes only an annual reading, released each January, and the 2025 edition put Texas first among states, Florida second and North Carolina third, with Dallas-Fort Worth the top metro and Ocala the top city in the country. The Ocala result arrived a year before the Census data confirmed it. Texas does not fit the framework neatly. The state reclaimed U-Haul's number-one growth-state ranking in 2025 for the seventh time in ten years and claimed 182 of the South's 336 capital-project announcements in the first half of 2026 alone, even as its per-capita migration has cooled from roughly +222,000 in 2022 to +67,299 in the year ended July 2025. Texas is building a second wave on a base that is already the largest in the South, which is why the capital-project count tells you more there than the migration rate does.
Dallas: the same pattern, at a larger scale
Dallas-Fort Worth is running the same core-to-fringe redistribution as Atlanta, and the core side of it is larger than anything in the Southeast. Dallas County lost 46,200 net domestic migrants in the year ended July 2025, equal to 1.7% of its population in a single year, and finished the year down 2,616 people overall, the ninth largest numeric decline of any county in the country. Only a 52% drop in international migration tipped it into outright loss. Tarrant County was also negative at minus 7,000. The metro nevertheless added 123,557 people, second only to Houston, because the ring absorbed what the core shed. Metro net domestic migration was still positive at 18,197, though that is down 82% from the 2022 peak of 98,989 and down 42% in a year.
The growth is going north in volume and east in rate. Collin County added 42,966 people, the second largest numeric county gain in the nation, and Denton added 23,120. Together they are 53% of the metro's entire growth, and their combined net domestic migration of roughly 35,700 is nearly double the metro's total, which means the northern corridor is doing more than all of the region's net in-migration by itself. On growth rate, however, the leader is east. Kaufman County grew 5.67%, the third fastest county in the United States, ahead of Ellis at 3.62% and Hunt at 3.46%, all of which beat Collin's 3.43%. Denton at 2.21% was the second slowest county in the entire ring. The ring is tilted north and east rather than marching simply northward.
Six of the nation's fifteen fastest-growing cities are Dallas-Fort Worth suburbs. Celina, in northern Collin County, grew 24.6% to 64,427 and is the fastest-growing city in America, up 277% since the 2020 census, and it has passed Frisco as the metro's largest new-home market by permits. Princeton, Melissa and Anna follow, with Forney in Kaufman County and Greenville in Hunt County also in the top fifteen. Prosper, by contrast, is approaching buildout, and Plano, Irving, Garland and Arlington all lost residents. Fort Worth is the exception, adding 19,512 people, the most of any Texas city, and passing Jacksonville to become the nation's tenth largest city.
Affordability explains the redistribution here as it does in Atlanta, and the Texas version has a distinctive cause. The DFW median listing price rose from $359,100 in June 2019 to $439,990 in June 2026. On our estimates the median mortgage payment moved from roughly 29% of median household income to about 45%, a deterioration of some sixteen points, almost exactly matching Atlanta's move from 25% to 41%. But DFW sits about four points higher at both ends, because Texas property taxes near 2% of value and sharply higher homeowners insurance add roughly $850 a month to the carrying cost of a median home. Dallas has a carrying-cost problem as much as a price problem, and that is why the affordability frontier keeps moving outward.
The supply picture is consistent with a market that overbuilt and is now correcting. Active listings reached 29,628 in June, 23.9% above the June 2019 level, one of the few large metros where for-sale inventory now exceeds pre-pandemic norms. Single-family permits fell 8.3% in the first half and multifamily permits 11.9%. Apartment vacancy is around 12%, asking rents are down roughly 2% over the year, and landlords are offering six to eight weeks free. The price data is already turning, however. Case-Shiller Dallas was down 0.92% over the year through May, but the index bottomed in February and has risen three straight months, so the year-over-year figure should cross back above zero before long. Dallas is flat and correcting rather than falling.
The forward story sits north of the metro, in Grayson County and the Sherman-Denison area. Announced capital investment there approaches $38 billion, led by Texas Instruments at $30 billion for four 300-millimeter fabs with a $1.6 billion CHIPS award, GlobiTech and GlobalWafers at $5 billion for the first new US silicon wafer plant in two decades, and Coherent at more than $3 billion. Sherman has permitted over 4,000 homes since the TI announcement. Grayson County's population grew only 1.8%, slower than every ring county, but 89% of that growth came from net domestic migration, the purest job-led relocation signal in the region. This is the Georgia and Alabama pattern playing out inside a Texas metro, with capital arriving well ahead of population.
Florida: the state is not one market
Florida's headline collapse in domestic migration conceals four metro stories that point in different directions. Jacksonville is the only unambiguous winner, though the win belongs to the suburbs rather than to the core. The metro added 26,153 people in 2025, up 1.49%, and the consolidated city of Jacksonville added 8,319 to reach 1,017,689, the twelfth largest numeric gain of any city in the country. St. Johns County grew 3.90% to 346,328, the fastest rate of any county in Florida, on the strength of three unincorporated master-planned communities west and northwest of St. Augustine: SilverLeaf, which was the seventh best-selling community in the nation last year, along with RiverTown and Nocatee. Duval County itself grew only 0.78% and, like Hillsborough and Miami-Dade, gained on international migration while losing domestic migrants, so Jacksonville's result is a St. Johns, Clay and Nassau story rather than a core-county one. Single-family permits in the metro fell 3.2% in the first half against a 6.0% drop statewide. For-sale inventory has returned to its 2019 level, second only to Miami as the smallest overhang in Florida and set against 26.8% above 2019 in Tampa, 37.6% in Orlando and 65.6% in Lakeland. The growth is unusually family-heavy for Florida, with children 21.6% of St. Johns County's population against 18.9% statewide and a median household income of $109,839, though at 22.5% the county's over-65 share is no lower than the state's, so this is a family market and a retiree market at once.
Orlando looks strong on the headline and is the most fragile underneath it. The metro added 37,690 people, the tenth largest numeric gain in the country, but its net domestic migration was negative at minus 1,785 and international migration (Census includes Puerto Rico) supplied 82% of all growth. Growth also decelerated sharply, from 56,331 in 2024 to 37,690 in 2025. A metro whose expansion rests entirely on the one component most exposed to federal enforcement is not as solid as its rank suggests, and its inventory sits 41% above 2019 with permits down 17%.
Tampa is losing ground. Pinellas County shed 11,834 residents, the second largest numeric county decline in the country behind Los Angeles, and both Pinellas and Hillsborough have flipped to net domestic outmigration after gaining in the early 2020s. Case-Shiller Tampa is down 1.6% over the year and inventory is 40% above 2019. Some of the Pinellas loss is storm-related and should not be extrapolated in full, but the direction is not in doubt.
Miami is the paradox in the state and worth understanding precisely, because population and price are moving opposite ways. Miami-Dade lost 10,115 residents, the third largest county decline in the country, on net domestic outmigration of roughly 73,000, and the metro fell from sixth to eighth by population. Yet Case-Shiller Miami is up 1.8% over the year, Miami is the only major Florida metro with for-sale inventory below pre-pandemic levels, single-family months' supply is 4.9 at a $695,000 median that is up 3.7%, and permits are up 1%, the only region in the state with permit growth. Very little gets built, and cash demand substitutes for the domestic buyers who left.
The exception inside Miami is the condominium market, and it is severe. Condos carry 12.3 months of supply against 4.9 for single-family in the same county, with a median of $431,000 down 3.2%. Broward condos are down 2.8% at a $250,000 median and have fallen for more than twelve consecutive months. The binding problem is financing rather than inventory. Very few buildings in the tri-county stock carry FHA project approval, which removes leveraged entry-level buyers almost entirely, and it shows up in how the market clears. Cash took 49.7% of Miami-Dade condo resales in May against a national all-cash share of about a quarter. Add the reserve-funding requirement that bit with budgets for fiscal years beginning on or after January 1, 2025, and association fee increases near $500 a month, and this is a repricing and a financing freeze in older buildings rather than a 2008-style inventory avalanche. Condo listings are actually down 11.5% over the year and sales are up 12%.
The strongest growth in Florida is inland, and the reason is affordability rather than demographics. Ocala is now the fastest-growing metro in the United States at 3.4%, Lakeland-Winter Haven is fourth at 2.7% and Punta Gorda fifth, giving Florida three of the nation's five fastest-growing metros. Polk County has ranked in the national top five for domestic migration five years running. About 59% of the people moving into Polk and Pasco came from other Florida counties, which makes this an intra-state affordability migration rather than an arrival from the North. The insurance differential is the mechanism, with inland counties paying a fraction of coastal premiums.
We would resist the retiree framing that usually accompanies this. The Villages, the purest retiree market in America, has decelerated hardest, from 7.4% growth in 2022 to 2.3% in the year ended July 2025, and it has lost the fastest-growing-metro title it held for most of a decade to Ocala. Sumter County permits are down 9% and the resale median is off 6.3%. Collier County, meaning Naples, went from 3.6% growth to 0.1%. Meanwhile the fastest-growing county in the state is St. Johns, a family suburb, and the fifth fastest-growing metro in the country is Punta Gorda, which is coastal and hurricane-exposed, but is an affordable alternative to other parts of Southwest Florida. The University of Florida's own read of the 2025 data attributes the pattern to affordability and construction availability rather than to retiree demographics. Inland Florida is winning, but it is winning working families relocating from higher priced housing markets within the state.
One more caution for anyone underwriting Florida land. Lakeland has the fourth fastest population growth in the nation and the largest for-sale inventory overhang in the state at 69% above the pre-pandemic average. Demand is real there and supply simply overshot it. That is a builder-cycle problem rather than a demand problem, and it is the mirror image of Miami, where population is falling and inventory is the tightest in the state.
Pulling the regional work together, the framework argues for a targeted approach rather than a regional bet. Remain committed to the Carolinas, which combine the nation's strongest migration with affordability that has eroded but not broken. Position early in the Georgia, Alabama and North Texas corridors, where capital has arrived well ahead of population. Underwrite Texas on scale rather than per-capita migration, favoring the eastern and northern rings over the core counties while recognizing that DFW's carrying costs are pushing its affordability frontier outward faster than Atlanta's. In Florida, separate the state from its metros: Jacksonville and inland Ocala-Lakeland-Polk are working, Orlando's growth depends on a policy-sensitive component, Tampa is correcting, and Miami is simultaneously tight in single-family homes and distressed in condominiums. Above all, check inventory against 2019 before population growth. Lakeland has the nation's fourth-fastest growth yet also its largest inventory overhang.
5. The Municipal Ledger
A narrower, more mechanical question sits beneath the migration story: does a new subdivision generate enough property tax revenue to cover the roads, sewer lines, schools and emergency services it requires. The American Farmland Trust has tracked this ratio across more than 100 municipalities nationwide and finds residential development typically costs local governments about $1.16 in services for every $1.00 it returns in property tax revenue. A 2009 peer-reviewed meta-analysis of 125 cost-of-community-services studies by economists Matthew Kotchen and Stacey Schulte confirms the pattern holds broadly, with residential land use averaging a 1.18 ratio against 0.44 for commercial and industrial land.
The location premium inside that ratio is large. A 2026 study from the World Resources Institute and ECOnorthwest, commissioned by the Pew Charitable Trusts and covering ten states, found that infill and location-efficient development costs local governments about $21,000 less per home in upfront infrastructure spending than development at the metro fringe, generates 13% more property tax revenue per acre, and pays back its infrastructure costs in roughly nine years against thirteen for fringe development. How much of that gap a city can actually recover depends on tools that vary by state; North Carolina, for instance, caps water and sewer system development fees at a jurisdiction's calculated cost of service.
The trend over the past decade adds pressure of its own. National property tax collections totaled $845 billion on a trailing four-quarter basis through the first quarter of 2026, up 69% from $500.4 billion in 2014, while public construction spending grew faster still, up nearly 99% to a $544 billion annual rate in June 2026. Whether a new subdivision pays for itself is increasingly a city-by-city question, not a national given.
This is not a Southern story, and the research behind it was not built on Southern data. The Pew work covers Arizona, Florida, Maryland, Minnesota, Montana, New Hampshire, North Carolina, Pennsylvania, Texas and Washington, and it puts ongoing maintenance at $309 a year per home in established areas against $620 on the fringe. The policy response is national too. Arizona enacted State Affordability Infrastructure Districts this year, letting developers finance infrastructure and even impact fees through tax-exempt bonds, with local jurisdictions given a thirty-day objection rather than an approval, after finding that Arizona's existing tool had raised $347 million since 2019 against $11.7 billion in Colorado and $8.9 billion in Texas. Texas moved the other way, with a September 2025 law giving developers half the seats on impact-fee advisory committees, requiring a two-thirds council vote and freezing fees for three years. Facing a $15.5 billion local infrastructure backlog, Nashville's council took up developer fees in November 2025 but needs state authorization to proceed. San Francisco has proposed halving transfer taxes on large transactions to unlock roughly 50,000 entitled but unbuilt units.
If the fiscal logic favors infill, the obvious question is whether the Opportunity Zone program helps. Our answer is that it is about to help less. The 2025 tax law made Opportunity Zones permanent with decennial redesignation, replaced the decaying benefit with a standard five-year deferral and 10% basis step-up, and tightened eligibility to tracts below 70% of area median income. The program has been a genuine housing vehicle, with qualified funds raising $43.6 billion since 2017, nearly 47% of it strictly residential, financing more than 200,000 homes across 238 cities. But the new rules create Qualified Rural Opportunity Funds carrying a 30% step-up, triple the standard benefit, with the substantial-improvement threshold halved. That is a deliberate thumb on the scale away from urban infill, and the designation map shrinks about 20%, from 7,826 tracts to roughly 6,300, when the new map takes effect in January 2027. Fund-raising has already stalled at $851 million in the first quarter as investors wait for the new rules. Investors looking to the program as an infill instrument should read the rural tilt carefully.
6. Forecast
Our July 31 forecast puts total housing starts at 1.340 million in 2026 and 1.360 million in 2027. The composition matters more than the total. Single-family starts fall to 890,000 this year from 941,000 in 2025 and recover only to 940,000 in 2027, while multifamily rises to 450,000 and then eases to 420,000. New home sales are forecast at 636,000 in 2026 and 680,000 in 2027. Existing home sales are forecast at 4.14 million in 2026 and 4.25 million in 2027, reflecting our view that the mortgage stock will not reprice enough to release locked-in supply on a faster timetable.
On price we carry 1.2% for 2026 and 2.2% for 2027. The higher 2027 figure reflects our expectation that the supply overhang in the South begins to clear while the mortgage stock still has not repriced enough to release existing supply. Our larger point is the one in Section 2: a national appreciation forecast is close to uninformative in a market split this way, and we would rather be judged on the composition call than on the average.
On rates we have the thirty-year mortgage finishing 2026 at 6.46% and 2027 at 6.64%, with the ten-year Treasury at 4.47% and 4.69% respectively. The reasoning is that we carry stronger growth, with real GDP at 2.5% in both years, payroll gains recovering from 88,000 a month in 2026 to 114,000 in 2027, and unemployment easing to 4.0% by the end of 2027. A real economy that firm does not deliver a lower long rate, particularly with the term premium where it is. That is also why we can carry a production forecast that holds its level alongside a rising long rate without contradiction. Builders respond to absorption, and absorption follows employment.
| Indicator | Units | 2024A | 2025A | 2026F | 2027F | 2028F |
|---|---|---|---|---|---|---|
| Production | ||||||
| Total Housing Starts | Thous. units, SAAR | 1,370 | 1,356 | 1,340 | 1,360 | 1,440 |
| Single-Family Starts | Thous. units, SAAR | 1,015 | 941 | 890 | 940 | 990 |
| Multifamily Starts | Thous. units, SAAR | 355 | 415 | 450 | 420 | 450 |
| Total Building Permits | Thous. units, SAAR | 1,474 | 1,431 | 1,395 | 1,450 | 1,500 |
| Residential Investment | % chg, annual | 3.2 | -2.2 | -1.8 | 4.0 | 4.0 |
| Construction Employment | Thous., annual avg | 8,205 | 8,263 | 8,336 | 8,410 | 8,500 |
| Sales | ||||||
| New Home Sales | Thous. units, SAAR | 684 | 679 | 636 | 680 | 685 |
| Existing Home Sales | Thous. units, SAAR | 4,060 | 4,060 | 4,137 | 4,250 | 4,300 |
| Prices | ||||||
| Case-Shiller National Home Prices | % YoY | 5.1 | 2.2 | 1.2 | 2.2 | 3.0 |
| Median New Home Price | $ Thous. | 419.5 | 414.4 | 411.5 | 423.8 | 438.0 |
| Median Existing Single-Family Price | $ Thous. | 412.5 | 419.3 | 427.9 | 439.0 | 451.3 |
| Inventory & Ownership | ||||||
| New Homes, Months' Supply | Months, annual avg | 8.3 | 8.8 | 9.2 | 8.9 | 8.7 |
| Existing Homes, Months' Supply | Months, annual avg | 3.6 | 4.0 | 4.3 | 4.4 | 4.4 |
| Homeownership Rate | %, annual avg | 65.6 | 65.3 | 65.2 | 65.4 | 65.6 |
| Finance | ||||||
| 30-Year Mortgage Rate | %, period end | 6.72 | 6.60 | 6.46 | 6.64 | 6.64 |
| 10-Year Treasury | %, period end | 4.21 | 4.29 | 4.47 | 4.69 | 4.69 |
Table 1. Piedmont Crescent Capital U.S. housing forecast as of July 31, 2026. Starts, permits and sales are annual averages of monthly seasonally adjusted annual rates. Multifamily is total starts less single-family and therefore includes 2-to-4 unit structures. Actuals from the U.S. Census Bureau, Bureau of Labor Statistics, National Association of Realtors, S&P Cotality Case-Shiller and Freddie Mac.
7. What Would Change Our Mind
We would revisit the volume call if the thirty-year mortgage rate held below 6% for a full quarter, which nobody on the published forecast distribution expects before 2028. We would revisit the cost call if the Section 232 metals and lumber duties were rolled back, since essentially all of this year's input-cost acceleration traces to trade policy and could reverse inside a year. We would revisit the composition call in Section 2 if two or more Sun Belt metros re-entered the top five of the Case-Shiller table, or if Southern rental absorption stalled while deliveries kept falling, either of which would suggest the regional split is being driven by demand rather than supply. We would revisit the lock-in timing if mortgage portability moved from evaluation to rulemaking, though we note that FHFA has been evaluating since November 2025 without shipping anything and the MOVE Act is still new and unscored. And we would revisit the rate call, which is our least comfortable position, if payroll growth failed to recover toward the 114,000 monthly pace we carry for 2027, since our rate path rests on a firmer real economy and the two have to travel together.
8. Implications
Builders and land. The operating question through 2027 is inventory turns rather than price. With months' supply at 9.3 and 118,000 finished unsold homes on the books, the carrying cost of spec is the binding constraint, and our forecast has single-family starts cut to 890,000 this year from 941,000 in 2025, well before base prices give. Land positions taken in 2021 and 2022 in the outer Sun Belt are the exposure to watch, since those are the markets where prices are falling and impact fees are rising at the same time.
Building products. Mix matters more than the headline. Metals and lumber exposure carries policy risk in both directions, since the same tariff structure that produced a 16.9% increase in steel mill products and 22.3% in copper wire and cable could unwind. Gypsum, millwork, concrete and roofing are running between minus 0.7% and plus 3.2%, so pricing power is concentrated rather than general.
Rental and multifamily. The Southern supply wave is receding rather than building. Market-rate apartment completions have fallen from 162,600 in the third quarter of 2024, the peak of the wave, to 77,700 in the second quarter of this year on RealPage's count, and CoStar puts first-quarter starts near 55,000, the fewest since 2011. Absorption has moved ahead of deliveries quarter to quarter, more than 187,000 units against those 77,700 in the second quarter, though on a trailing-year basis supply still runs ahead of demand. Austin posted a 1.3% quarterly rent increase in the second quarter, its first since the fall of 2022. We expect the weakest Southern rental markets to bottom over 2026 and 2027, with the metros that stopped starting units earliest recovering first.
Municipal credit. The ledger in Section 5 is the part of this report with the longest tail. Fast-growing fringe jurisdictions in the Carolinas, Georgia and Tennessee are adding service obligations faster than they are adding the base to pay for them, and the policy response has already begun. We would not look for a near-term credit event here. The revaluation of which growth is worth having runs over budget cycles rather than quarters.
Mortgage credit. The underwriting picture is mixed in a way worth watching. Serious delinquency transitions are steady at 2.97% for auto loans and 7.10% for credit cards, negative equity is negligible at roughly 2% of mortgaged properties, and foreclosure remains near record lows at 0.64%. The stress is concentrated rather than general, with subprime auto ABS sixty-day delinquency hitting a thirty-two-year high in January while prime auto sat at 0.42%. The metric we would watch is debt-to-income drift in agency purchase originations. Industry data put roughly a third of new GSE purchase loans at a DTI above 43%, against about 13% in 2013. That is affordability being solved with leverage rather than with price, and it is how this cycle stores up trouble without showing it in the delinquency data first.
9. Risks to the View
Risks run in both directions. A meaningful decline in interest rates would ease builder credit conditions and buyer affordability at once, potentially unlocking pent-up demand faster than supply-side constraints can accommodate it, though that scenario would also widen the price and cost pressures already visible in materials and regulatory compliance. A further tightening of AD&C credit combined with a slowdown in the regional capital-project cycle propping up Carolinas, Georgia, Alabama and Texas demand alike would meaningfully worsen the base case; either alone would be manageable, but together they would fall hardest on the states still waiting for their capital investment to convert into realized housing demand. The path forward runs through the same three constraints rather than around them. Regulatory costs have proven the least likely to retreat, materials inflation has re-accelerated rather than cooled, and credit conditions remain tight enough to keep incentives, not price cuts, as the primary tool builders have left. A full recovery in volume will likely wait on some combination of easier credit and a materials cost pause, neither of which appears imminent as of this writing.
Acknowledgment
This report owes a great deal to Nicholas Shaffer, our summer intern, whose work on it went well beyond what we had any right to expect. He built the county migration and permit datasets from the ground up, chased the cost-of-community-services literature back to its primary sources, rebuilt several of the exhibits more than once as the data was revised, and caught errors that would otherwise have made it into print. The regional detail in Sections 4 and 5 is largely his research. We are grateful for the effort and glad to say so here.
Mark P. Vitner
Chief Economist, Piedmont Crescent Capital
Residential Construction Outlook · Summer 2026