
Too Much of a Good Thing
A View from the Piedmont — Weekly Economic Commentary
Key Points
- We part company with the chorus calling for a September hike. Three officials dissented on Wednesday in favor of a quarter point. The July data did not support one and, on present trends, the September data will not either. September odds have faded from 82% on Monday to roughly 60% at Friday’s close.
- Our concern is not the inflation rate. It is the growth rate of private domestic demand. Real final sales to private domestic purchasers rose 3.9% in the second quarter, more than double the first quarter’s pace, against a labor force that has shrunk by roughly a million people over the past twelve months.
- The price pressure has an address. Five programs are running at once and each is pressing on a physical bottleneck: the artificial-intelligence buildout, electrification, defense replenishment, pharmaceutical onshoring and the Peak 65 retirement bulge.
- Manufacturing is turning up underneath all of it. Chicago printed 57.6, Philadelphia jumped from 10.3 to 41.4, and core capital goods orders are up 12.5% from a year ago. A goods-sector upturn is how a narrow price problem becomes a broad one.
- The oil market has priced a deal that one of the two parties says does not exist. Brent is $83.57 and WTI $79.57 this morning, down 5% and 6%, after the President cancelled the planned strike campaign subject to a deal reopening the Strait of Hormuz and OPEC+ added 188,000 barrels a day for September. Tehran rejected the account on Sunday, and its foreign ministry said this morning there are no talks with the American side at all.
- Stay short on duration, for the fifth consecutive month. The 30-year closed at 5.27%, a post-2007 high, and the 2s30s spread widened 22 basis points in July.
Market Dashboard
The month ended with the broad equity market close to unchanged, the long end of the Treasury curve at its highest yields since 2007 and Brent crude back above $90 a barrel. The table below shows where the major markets closed on Friday, the moves that produced those levels and the July totals behind them. The rates block is the place to start. The two-year yield rose 14 basis points over the month while the thirty-year added 36, and that gap accounts for most of what we have to say this week. Two things happened after these levels were struck, and both of them cut against the energy complex. The Sunday night section below has the read.
Levels as of Friday’s close, July 31.
| Indicator | Level | This Week | July |
|---|---|---|---|
| Fed Funds (target) | 3.50–3.75% | Held 9–3; three dissents to hike | — |
| 2-Year Treasury | 4.28% | −5 bp | +14 bp |
| 10-Year Treasury | 4.75% | +6 bp | +31 bp |
| 30-Year Treasury | 5.27% | +11 bp; highest since 2007 | +36 bp |
| 2s30s spread | +99 bp | +16 bp | +22 bp |
| September hike odds | ~3 in 5 | Faded from 82% on Monday | — |
| S&P 500 | 7,489.72 | +1.0% | −0.13% |
| Dow Jones | 52,485.03 | +1.0% | +0.32%; fourth straight up month |
| Nasdaq Composite | 25,373.85 | +1.6% | −3.20% |
| Russell 2000 | 2,931.34 | flat | −3.08% |
| US Dollar (DXY) | just under 100 | −1.5% | −1.6% |
| Brent Crude | $90.12 | September contract, expired at settle; October settled $87.93 | +24%; best month since March |
| WTI Crude | $84.67 | September contract | Traded above $86 after the close |
| Gold | $4,050 | −1.3% Friday | +0.5%; first gain since February |
| Copper | $6.49 / lb | — | +6.0% |
| Retail Gasoline | $4.10 / gal | — | Up from $3.83 a month ago |
| Retail Diesel | $5.31 / gal | — | Up 40% from a year ago |
| 30-Year Fixed Mortgage | 6.66% | +8 bp | — |
| VIX | 15.99 | −6.4% Friday | Spiked to 20.7 on Fed day |
Monday Morning: Before the Open
The oil market has priced a deal that one of the two parties says does not exist. As of twenty past six this morning Brent was $83.57 and West Texas Intermediate $79.57, down 5.0% and 6.0% respectively. Brent fell as much as 7% in Asian hours before steadying, and both benchmarks have been close to flat since the small hours. One caution on the arithmetic, because it is going to be misreported all day. The September Brent contract expired at Friday’s settle of $90.12, so the front month is now October, which settled Friday at $87.93. Measured against the contract that is actually trading, Brent is down $4.36. Measured from the $90.12 headline that everyone has in their notes, it looks like $6.55. The first number is the real one.
The move assumes the Strait of Hormuz reopens, and this morning Tehran said the talks behind it are not happening. Foreign ministry spokesman Esmaeil Baghaei said Iran is not currently holding talks with the American side, that its delegation is staying in the country and is not traveling to negotiate in the coming days, and that the mediator for any American channel is Pakistan working with Qatar rather than Oman. On the Omani corridor talks that are running, he said a deal there would not be sufficient to fully reopen the strait while American aggression continues. That is a harder position than Sunday’s rather than a softer one, and it came out while crude was down five percent on the opposite assumption.
Nothing physical has changed either, and that is the part we would put in front of a risk committee. The strait has been effectively closed for 155 days. The most recent hard count we can find, from July 23, puts transits at ten vessels a day against a normal rate near eighty-eight, which is roughly 11% of pre-crisis throughput. War-risk cover is running around eight times its pre-crisis cost, several protection and indemnity clubs have withdrawn cover altogether, and something like seventy tankers are moving with their transponders off. No shipping line has announced a resumption. A June memorandum that partially reopened the strait collapsed inside a month. We are not predicting that this one collapses, and we would note that at least one experienced oil strategist has called the de-escalation hopes most likely totally misplaced. We are pointing out that a five percent move has been paid for with a communique nobody has countersigned and, as of this morning, a negotiation that is not taking place.
For our purposes the policy conclusion is unchanged and, if anything, easier to hold. Whether crude settles in the high seventies or back above ninety, neither outcome touches private domestic demand growing at close to 4% against a shrinking labor force, and neither is a reason to raise rates in September. An energy move of this size in either direction is precisely the relative price change a central bank is supposed to look through. What it does change is the near-term path of headline inflation, and with it the political temperature around the September meeting. The thing to watch is the transit count rather than the crude price, and the transit count has not moved.
Our Thesis
There is a straightforward argument going around that the Federal Reserve is behind the curve and needs to raise rates, and it has gotten louder since Wednesday, when Lorie Logan, Beth Hammack and Neel Kashkari all dissented in favor of a quarter point. We understand the argument. We do not accept it, and our reasoning is easily misread as dovishness when it is nothing of the kind.
The data did not support a rate increase in July, and on present trends it will not support one in September either. Start with prices. The Dallas Fed’s trimmed mean personal consumption expenditures rate fell in June to 2.23%, its lowest since July 2021. The Cleveland Fed’s median consumer price index is up 2.7% over the past twelve months, down from 3.6% a year earlier. Core consumer prices are running at 2.6%. On employment, June payrolls came in at 57,000, manufacturing employment is down 38,000 from a year ago, and the employment cost index shows wages decelerating, to 3.1% from 3.3%. Inflation is lower and job growth has slowed. Those are the two things the Federal Reserve is charged with watching, and both of them argue against tightening right now.
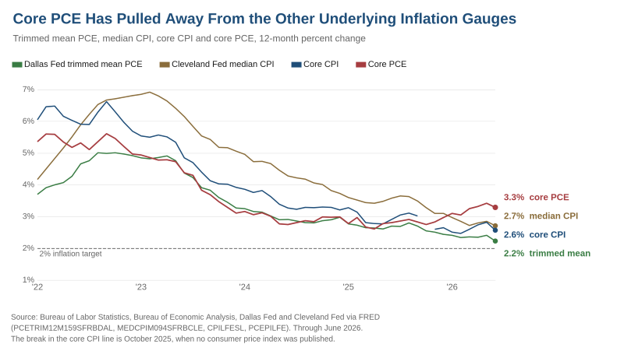
Producer prices are the honest counter-argument and we do not wave them off. Final demand is up 5.5% and has run between 5.5% and 6.0% since the spring. But a war-driven energy shock passing through a supply chain is the textbook relative price change, and the textbook answer is to look through it unless it reaches wages or expectations. It has reached neither. The Bank of England reached the same conclusion on Wednesday from a larger energy shock and a smaller economy, holding Bank Rate at 3.75% on a 6-3 vote and recording in its minutes that there had been little evidence of material second-round effects so far, while noting that pass-through lags mean this cannot be read as a strong signal about the future.
The market has come around to the same view without saying so. September hike odds were 82% on Monday, 72% after the meeting, and roughly 60% by Friday’s close. The commentary is more hawkish than the pricing, and the pricing is more hawkish than the data. We would not pay up for the commentary.
What worries us is the growth rate of private final domestic demand, which is running too fast to be consistent with containing inflation. The second quarter’s headline growth rate of 1.5% is a distraction; every part of the shortfall was inventories, imported capital goods, or a federal spending line depressed by petroleum reserve sales. The number that describes the economy is real final sales to private domestic purchasers, and it grew 3.9%, up from 1.7% in the first quarter. That is a boom pace rather than a recovery pace, arriving in the middle of a war, with oil having averaged the mid-nineties, against a labor force that has shrunk by roughly a million people over the past twelve months.
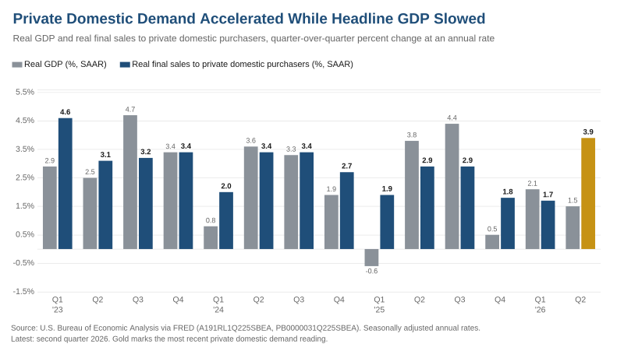
An economy cannot grow domestic demand at close to 4%, with no growth at all in available workers, and expect inflation to settle at 2% for long. That arithmetic is why we are uneasy even as we argue against a September hike. The current rate of inflation does not justify tightening; the current rate of demand growth is why we would want the Committee ready to.
The cyclical layer on top is broader than the artificial-intelligence line item. Business fixed investment grew 8.4% in the second quarter on top of 10.6% in the first, with equipment up 15.2%, which is a good deal more than data centers.
The evidence is sectoral and specific rather than aggregate. Five programs are running at once, the artificial-intelligence buildout, electrification, defense replenishment, the pharmaceutical and life sciences onshoring wave and the demographic bulge we have called Peak 65, and each is pressing on a different physical bottleneck in an economy whose labor force is not growing.
Where the Price Pressure Actually Lives
Electric power is the clearest case, and the mechanism is worth spelling out because the number that follows is not a forecast but a price already struck. The PJM Interconnection is the regional transmission organization that coordinates the wholesale power market and the high-voltage grid for more than 67 million people in all or parts of thirteen states and the District of Columbia, from Illinois east to New Jersey and south to North Carolina. Its Base Residual Auction runs roughly three years ahead of the delivery year, and what it buys is not electricity but a promise: generators are paid a fee per megawatt-day to keep capacity available for the year in question, and the clearing price is the price that draws out enough of those promises to meet PJM’s own reliability requirement. When bidders cannot supply it at any price inside the cap, the auction clears at the cap and still falls short.
That is now what happens routinely. The auction for the 2028-29 delivery year cleared at the price cap of $325 per megawatt-day, the third consecutive auction to hit the cap, at a total cost of $16.4 billion, and the cost lands in retail bills across those thirteen states. It also fell 6,831 megawatts short of its own reliability requirement, the second auction running in which the entire system came up short. For scale, the clearing price was $28.92 for the 2024-25 delivery year, an auction held in December of 2022. It is a factor of eleven in less than four years.
Lazard’s nineteenth Levelized Cost of Energy study, published July 13, sets out why. It puts unsubsidized gas combined-cycle generation at $51–129 a megawatt-hour and gas peaking at $144–276, a fifteen-year high for gas-fired power. Its most useful sentence for our purposes is the observation that measured capital costs “have not yet reached the levels of recently observed quotes, suggesting higher-cost projects may still be in the planning” stages. The index is lagging the transactions, and there is more increase in the pipeline than in the data.
Electrification stopped being a deflationary story some time ago, and most published inflation forecasts still carry electricity as a disinflationary line. One option we expect to be played out further is the extension of already operating coal-fired power plants wherever possible. The equipment corroborates it. GE Vernova’s gas turbine backlog is 116 GW, up from 100 GW a quarter earlier, with customer conversations reaching “2032 and beyond”; Siemens Energy’s backlog is €154 billion on a book-to-bill of 1.72; and industry sources report generator step-up transformer lead times of up to four years with prices up about 80% over five years.
The Steepening Has Three Sources
The market is only discussing two. The 30-year closed Friday at 5.27%, a new post-2007 high, and the 2s30s spread widened 22 bp over the month, from 77 bp to 99 bp. The two explanations in general circulation are the deficit and the Federal Reserve’s credibility, and both are real. We would add a third. A cyclical reacceleration in the goods economy is a classic long-end story, because it raises the expected path of real growth and the inflation risk premium simultaneously without touching the front end, which is anchored by a Committee that is not moving in the next six weeks. Chair Warsh came close to this on Wednesday without joining the dots. He called the strong growth of business investment the most striking feature of the economy, he noted that nominal and real yields are materially higher across the Treasury curve and that the inter-meeting move ranked among the largest in two decades, and he put that move down to market participants reacting to real data rather than to anything the Committee said. He did not connect the two. We would. The corroborating detail is that this is a real-yield move rather than a breakeven move. The 30-year inflation-protected security reached a real yield of about 2.9% in mid-July, the highest since 30-year TIPS were reintroduced in February 2010.
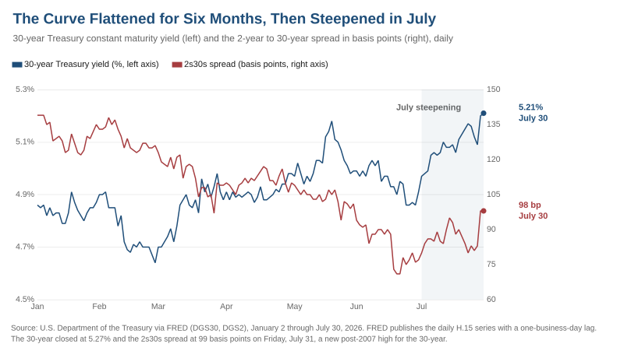
Two qualifications. First, the steepening is roughly four weeks old. Measured over three, six or twelve months the curve has flattened, because the front end repriced from cuts toward hikes faster than the long end moved. The steepener is a July phenomenon and it began the week of the dissents. Second, at least one other house making very nearly our argument about manufacturing and inflation draws the opposite conclusion on the curve and recommends a flattener. The disagreement is real and clients should be aware that it exists.
Behind the Numbers
Start with what closed the month, because the tape said something clear. The S&P 500 fell 0.13% in July, its first negative July since 2014 and the end of an eleven-year streak, and its second consecutive losing month. In the same month the Dow rose 0.32% and recorded its fourth straight winning month. The Nasdaq fell 3.2% and the Russell 3.1%. Set those side by side and the story is a market repricing one very large, very concentrated trade while the rest of the index does fine, rather than a market that is worried about the economy. Friday’s session made the point in miniature. Amazon rose 15.3% on cloud results that monetize the spending; Apple fell 7.4% on a September guide.
The labor market is why we are comfortable with a hold in September and uneasy about 2027, and both readings come from the same fact. Payroll growth has slowed to 57,000 a month and manufacturing employment is down 38,000 from a year ago. On its face that is a cooling labor market and an argument for patience, and in the near term it is. Even so, breakeven payrolls are close to zero, initial claims printed 197,000 in the week of July 25, and manufacturing weekly hours have risen half an hour since December while manufacturing average hourly earnings run 3.8% against 3.5% for all private workers. Employers in the cyclical sector are adding hours and paying up rather than hiring, which is exactly what firms do when they believe demand is improving and cannot find people. Slow payroll growth in an economy whose labor force is contracting is a constraint rather than slack, and constraints show up in prices with a lag.
Housing is where the rate regime is doing the visible damage, and the 30-year Treasury at a new 19-year high does not help. New home sales ran at 628,000 units in June, down 5.6% from a year ago, with the median price down 3.3% in a single month and 9.3 months of supply. The 30-year mortgage is 6.66%. There is, however, an awkwardness here for the tightening camp. The one sector that responds cleanly to the funds rate has already absorbed the full weight of it. A September increase would not touch a data center, a turbine order or a hospital bill. It would land on housing again, and housing is not where the demand growth is coming from.
Then the war, which moved twice after Friday’s close and finished the weekend somewhere else entirely. Friday’s reporting had the President weighing a multi-day strike campaign against Iran with oil refineries and power plants under consideration as targets, and West Texas Intermediate traded above $86 after settling at $84.67 on that reading. On Saturday evening he said the attack would be cancelled, subject to being able to make a deal quickly, and described parameters that include the immediate and complete reopening of the Strait of Hormuz and an end to Iran’s nuclear threat. He said Israel is party to the commitment; Israel has not confirmed that. Iran spent Sunday rejecting the whole account, with Mehr calling it a new lie, Fars quoting a negotiator saying the strait stays closed while American hostile actions continue, and the acting defense minister calling the President’s comments psychological and cognitive warfare. On Monday morning the foreign ministry spokesman said plainly that no talks with the American side are under way, that Iran’s delegation is not traveling, and that any American channel runs through Pakistan and Qatar rather than Oman.
We would not move a forecast on an announcement, and we said the same about the report it replaced. What we would do is note how much the distribution has changed in seventy-two hours. Friday’s risk was a campaign against Iranian refining and generation, which is a destruction-of-capacity story rather than a transit story and is asymmetric to the upside on price. Sunday’s is an unratified de-escalation whose headline term is the reopening of the strait, which is asymmetric the other way. The range of outcomes for oil over the next month is now wider than it was on Friday and centered lower, and both tails run through Tehran rather than through Washington.
OPEC+ met Sunday and approved the 188,000 barrel-a-day September increase, a sixth consecutive monthly step that completes the second of the group’s three cut packages. The seven countries running voluntary adjustments are Saudi Arabia, Russia, Iraq, Kuwait, Kazakhstan, Algeria and Oman; the United Arab Emirates left the group earlier this year. Delegates say a pause through the fourth quarter follows, though that does not appear in the communique. The group meets again on September 6, and OPEC has now cut its 2026 demand growth forecast for a third consecutive month.
Bottom Line
We hold no cut in 2026 and we do not think a hike is required. Inflation is lower, job growth has slowed, and the underlying measures built to separate signal from noise are at or near target. What has changed this week is the location of our concern rather than our policy call. Private domestic demand is growing at close to 4% against a labor force that is smaller than it was a year ago, the price pressure is concentrated exactly in the five programs producing that growth, and the most cyclical part of the economy is now turning up underneath them. That is a 2027 problem rather than a September one, and the weekend, if the de-escalation holds, takes the other argument off the table as well: an oil complex giving back its war premium pulls headline inflation down through the fall and removes the last thing a September hike could claim to be responding to. It does nothing at all to private domestic demand growing at close to 4%. Stay short on duration. We would revisit that call if private final domestic demand slows back toward 2% while the long end stabilizes.
CFO & Corporate Treasurers Corner
This section is for the people who have to act on the forecast rather than debate it. Everything below follows from the same three facts: the front end is anchored, the long end is repricing, and the binding constraints in this cycle are physical rather than financial.
Do not build a 2027 plan that assumes rate relief. Our base case is no cut in 2026, no hike required in September, and the risk of a hike migrating into 2027 as a demand story rather than an oil story. Meanwhile the long end added 36 basis points in July alone to close at 5.27%, and the 30-year real yield reached about 2.9% in mid-July, the highest since 30-year inflation-protected securities were reintroduced in 2010. We read that as a structural repricing of real rates rather than an inflation scare, which is another way of saying that waiting for a better entry is unlikely to be rewarded.
Terming out now costs 99 basis points of curve, and that is the question to put to your board. With no cut in the base case, floating-rate exposure gets no relief this year, so the decision is whether to pay the 2s30s spread to remove 2027 risk. For a borrower whose 2027 risk is a demand-driven tightening rather than a recession, we think that is a reasonable premium.
If you are siting load, the schedule is the equipment order, not the capital approval. PJM cleared at the cap for a third consecutive auction and still came up 6,831 megawatts short. Generator step-up transformer lead times run to four years with prices up about 80% over five years. GE Vernova’s turbine conversations now reach 2032 and beyond. Budget electricity above the 4.0% consumer price print, which we regard as a floor.
The weekend improved the entry for fuel consumers and did not settle anything. Brent is $83.57 and WTI $79.57 this morning, five and six percent below Friday, on an announcement Tehran rejected on Sunday and on talks its foreign ministry says are not happening. We would layer hedges incrementally rather than in size, and treat the level as a chance to extend coverage rather than as a new forecast. Watch Strait of Hormuz transit counts and war-risk quotes, which move well before the price does. Transits were last counted at about a tenth of normal and war-risk cover at roughly eight times pre-crisis, and neither has moved.
Budget benefits well above headline inflation for 2027. The employment cost index shows wages decelerating to 3.1% from 3.3%, which flatters the picture, because the index rotated into benefits and the cost that drives a renewal is medical. Hospital services in the consumer price index are up 5.5% and the producer price index for hospital services 3.6%.
Check whether you have repriced since the spring. Producer prices for final demand are up 5.5% and have run between 5.5% and 6.0% since April, against core consumer prices at 2.6%. That gap is unrecovered input cost sitting in somebody’s margin, and if the energy unwind pulls headline inflation down through the fall the window to pass it through narrows rather than widens.
The Week Ahead
| Date | Release | Why It Matters |
|---|---|---|
| Sun Aug 2 | Iran strike cancelled, then denied | The President says the attack is off subject to a deal reopening the Strait of Hormuz. Tehran rejected the account the same day and says the strait stays closed; Israel has not confirmed joining. Crude sold off anyway. |
| Mon Aug 3 | US-Iran talks: Tehran says there are none | The President said talks would begin Monday afternoon. Iran’s foreign ministry said this morning that no talks with the American side are under way and its delegation is not traveling. Transit counts and war-risk premiums are the tell, not the crude price, and neither has moved. |
| Sun Aug 2 | OPEC+ decision (done) | The seven voluntary-adjustment countries approved a 188,000 b/d September increase. Delegates say a pause through Q4 follows; that is sourced, not in the communique. Next meeting September 6. |
| Wed Aug 5 | Treasury quarterly refunding announcement | Coupon sizes into a 30-year at a post-2007 high and a term premium that rebuilt through July. |
| Mon Aug 3 | ISM Manufacturing, July | June was 53.3, sixth straight expansionary month. The prices index was 73.0 after 21 consecutive months of increase, and that is the number. |
| Mon Aug 3 | Construction spending, June | Watch manufacturing structures, down 22% year over year and falling every month this year. The defense and pharma money has to show up here first. |
| Wed Aug 5 | ISM Services; ADP employment | Services selling-price inflation is near a four-year peak in the flash survey. |
| Thu Aug 6 | Q2 productivity and unit labor costs | The most important release of the week. The employment cost index rotated into benefits; whether that is inflationary depends entirely on productivity. |
| Fri Aug 7 | July Employment Situation | June was +57,000 with unemployment at 4.2%. Summer data is often volatile and full of surprises. |
| Aug 27–29 | Jackson Hole; Chair Warsh speaks | Where a September hike gets prepared or walked back. |
| Sep 15–16 | FOMC | Roughly three-in-five market odds of a hike, faded from 82% on July 27. |
Mark P. Vitner
President & Chief Economist, Piedmont Crescent Capital
mark.vitner@piedmontcrescentcapital.com · 704-458-4000
A View from the Piedmont is published weekly by Piedmont Crescent Capital for informational purposes only and does not constitute investment, legal, or tax advice. Views expressed are those of the author as of the date of publication and are subject to change.