
The War Widens, the Barrel Rallies, and the Labor Force Scare That Wasn’t
A View from the Piedmont — Weekly Economic Commentary
Summary
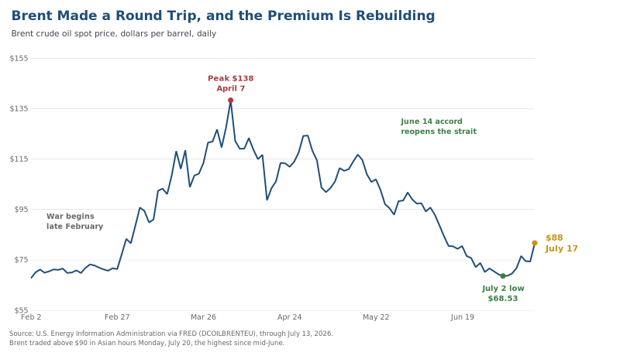
- The truce is gone in all but name. U.S. strikes on Iran ran through a ninth consecutive night, Iran hit U.S. positions in six countries, two American service members were killed and one is missing in Jordan, a third died in Iraqi Kurdistan, and Kuwait reported Iranian strikes on power and water desalination plants three times in three days. Brent finished the week at $88.10, a round trip from $68.53 on July 2.
- The inflation news broke the Fed’s way just in time. June CPI fell 0.4% and PPI fell 0.3%, the friendliest pair of prints since the war began. Hike odds for July collapsed to roughly 17%. We hold our call: no move in 2026, next move a hike in early 2027.
- June’s participation scare is demographics, not discouragement. Prime-age participation is running at 83.7% over the past twelve months, above any comparable stretch between 2002 and the pandemic, and stood at 83.9% as recently as May. The slide in the headline rate reflects Peak 65 retirements and slower immigration. The economy has fewer workers, not fewer willing workers.
- The retiree wave is steadying the consumer. Nearly 53 million Americans age 65 and over now sit outside the labor force, most of them healthy and active, spending from inflation-indexed Social Security, pensions and portfolios rather than paychecks. Happy hour at The Villages arrives on schedule whether the market has a good day or a bad one.
- Equities have an AI problem, not an Iran problem. The S&P 500 slipped 1.9% below its June 2 record as semiconductors sold off on hyperscaler capex worries, even as 88% of early reporters beat on earnings, well above the five-year average, and energy rallied.
Market Snapshot
| Indicator | Level | Our Read |
|---|---|---|
| Brent Crude | $88.10 / bbl | Round trip from $68.53 on July 2. Base case settles near $78 by year-end; upside risk while the strait stays shut. |
| WTI Crude | $82.49 / bbl | Up 4.5% Friday on the Kuwait infrastructure strike. |
| S&P 500 | 7,475.69 | Off 1.9% from the June 2 record; the AI capex question, not the war, is setting the tone. |
| 10-Yr Treasury | 4.55% | Rangebound between safety flows and hike repricing. Year-end base case 4.40%, with 4.70% upside. |
| Gold | ~$4,010 / oz | The safe-haven bid keeps fading; a firm dollar and a hawkish Fed outweigh nine nights of strikes. |
| 30-Yr Mortgage | 6.55% | Cooler-for-longer housing until spreads narrow. |
| Fed Policy | July 28–29 FOMC | No change expected; hike odds repriced to roughly 17% after CPI. No move in 2026; next move a hike, penciled in for early 2027. |
The Truce Is Gone in All but Name
The Gulf conflict widened on every axis last week, and the weekend brought the most serious escalation since the war began in February. U.S. Central Command has now run strikes on Iranian military targets for nine consecutive nights, hitting coastal defense sites, missile batteries and maritime infrastructure. Iran answered with attacks on U.S. positions in Bahrain, Jordan, Kuwait, Oman, Qatar and Syria, killing two American service members in Jordan and leaving a third missing, and struck Kuwaiti power and water desalination plants three times in three days, the first sustained attacks on infrastructure critical to civilian life in a Gulf ally. Sixteen U.S. service members have now been killed and more than 430 wounded since the war began. Washington is reportedly moving dozens of additional refueling aircraft into the region, which keeps a larger strike package on the table. Tehran said Sunday that the ceasefire has effectively collapsed, and President Trump answered by proposing shipping fees on strait transits and restarting the blockade of Iranian ports. Brent traded above $90 in Asian hours Monday, the highest since mid-June. Qatar continues to mediate, but neither side is negotiating from the script that produced the spring ceasefire.
The Strait of Hormuz is functionally impaired even though it is not formally closed. Transits are running near 10 a day against a pre-war norm near 90, nearly all remaining traffic is following the Iranian-directed northern route, shadow-fleet crossings have stopped entirely, and a U.S. Hellfire strike disabled the tanker Belma, a blockade runner, near Kharg Island midweek. CENTCOM disputed Iranian claims that two tankers struck mines, but the dispute itself is the point: war-risk premia, not port authorities, are now rationing the world’s most important oil artery. Iran has also reportedly instructed the Houthis to prepare to disrupt Red Sea shipping if U.S. strikes extend to Iranian power infrastructure. A simultaneous two-strait disruption remains a tail risk rather than a base case, and that is exactly why it belongs in every hedging conversation.
Our scenario probabilities stand at 55/15/30, with risk shifting toward the darker end of the adverse bucket. The base case, at 55%, still has the flare-up contained, diplomacy resuming, and Brent settling near $78 by year-end as the risk premium compresses. The upside scenario, at 15%, has a durable framework agreement pulling crude back into the low $70s. The adverse scenario, at 30%, carries the strait closure into the fall with Brent holding in the $90s or higher, gasoline reclaiming its spring peak, and the June inflation relief proving a one-month reprieve. The weekend’s American casualties and the strike on Kuwaiti civilian infrastructure did not change the probabilities, but they moved the center of gravity within the adverse case.
The Inflation News Broke the Fed’s Way, Just in Time
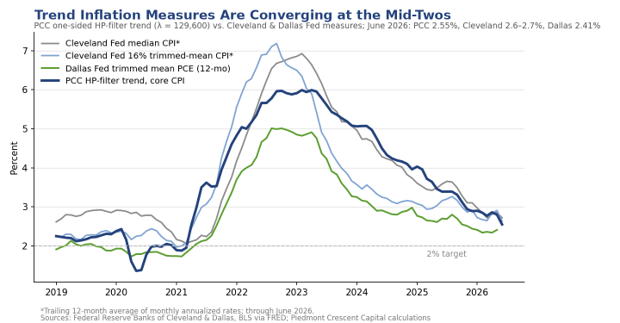
June delivered the friendliest pair of inflation prints since the war began. CPI fell 0.4% on the month, the largest one-month decline since April 2020, pulling the annual rate to 3.5% from 4.2% as gasoline dropped 9.7%. Core prices were flat, easing the core rate to 2.6%. Producer prices fell 0.3%, the first deceleration in five months, though final demand remains up 5.5% from a year ago and stage 2 intermediate demand is up 9.8%, so the pipeline has not cleared. Our HP-filtered estimate of trend core inflation eased to roughly 2.6%, and the spread across the four underlying-inflation gauges we track is the narrowest of this cycle. The war-driven price spike is being refunded, at least partially for now.
The refund is already being clawed back at the wholesale rack. Brent’s two-week rally from $68.53 to $88.10 will reach retail gasoline within weeks, and diesel remains the freight market’s problem regardless. That tug of war frames the July 28–29 FOMC: futures-implied odds of a hike collapsed to roughly 17% after CPI, and we expect a hold with hawkish body language. Our call is unchanged. No move in 2026, and the next move is a hike, penciled in for the first half of 2027 under the Warsh Fed. The committee is not going to validate cut hopes while an oil shock of uncertain duration sits between it and its target.
Fewer Workers, Not Fewer Willing Workers
June’s participation scare is demographics, not discouragement, and we take the argument apart in a new Piedmont Perspective this week. The labor force participation rate slid to 61.5% in June, the lowest reading in 50 years outside the pandemic, feeding a narrative that prime-age workers are giving up. The monthly figures deserve skepticism: the household survey covers roughly 60,000 households, June carries seasonal noise as the school year ends, and the updated population controls introduced with the February data removed roughly 1.5 million men, concentrated in the 25-54 age group. The longer-run trend shows prime-age participation remains quite strong. It averaged 83.7% over the past twelve months, higher than any comparable stretch between 2002 and the pandemic, and stood at 83.9% in May and 84.0% in January, readings never reached in the eighteen years before the pandemic. On the same twelve-month basis, the number of 25-54 year olds on the sidelines is near a two-decade low.
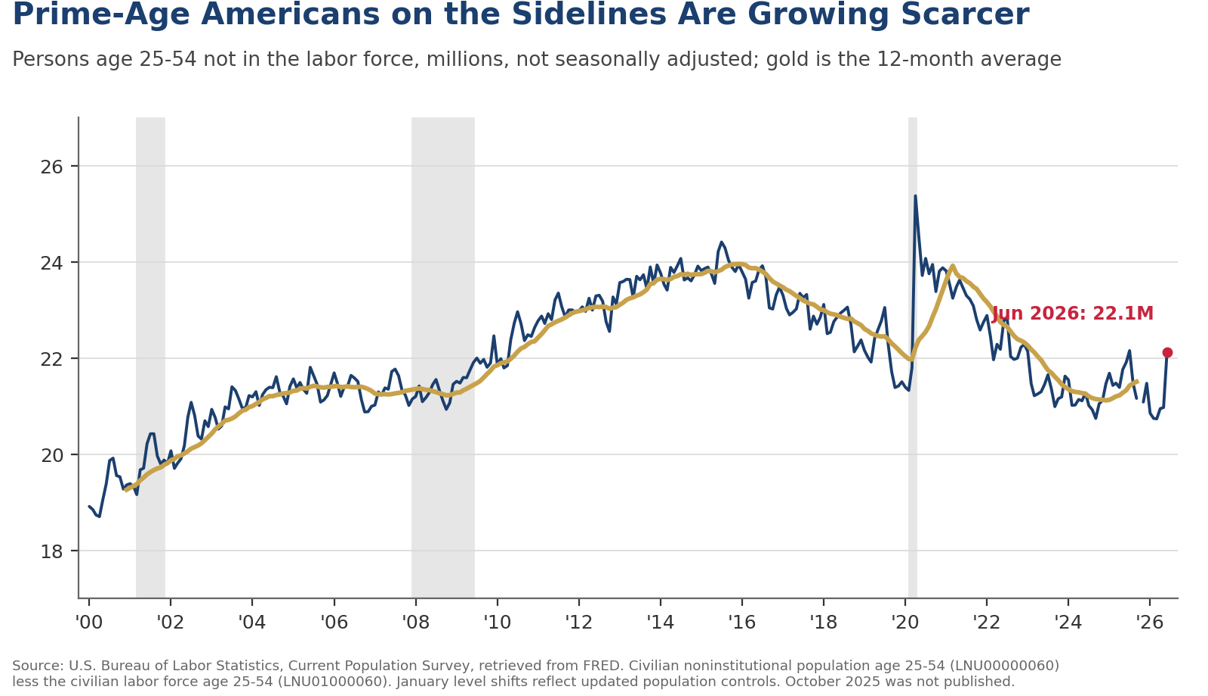
The slide in the headline rate is Peak 65 at work, and the swelling ranks of retirees are steadying the consumer. The number of Americans 65 and over outside the labor force has climbed from 31 million in 2008 to 52.7 million, most of them healthy and active, spending from inflation-indexed Social Security, pensions and portfolios rather than paychecks. Adults 50 and over already account for more than half of U.S. consumer spending, according to AARP, and that spending rests on inflation-indexed benefits rather than paychecks. The economy has fewer workers, not fewer willing workers, and with trend labor force growth below 10,000 per month, a 57,000 payroll print still tightens the labor market. The full analysis, including what the retiree wave means for manufacturers, retailers, restaurateurs, travel, health care, housing and financial services, appears in this week’s Piedmont Perspective.
Equities Have an AI Problem, Not an Iran Problem
The stock market’s July setback traces to the AI trade, not the Gulf. The S&P 500 fell 1.0% Friday to 7,475.69 and sits 1.9% below the June 2 record of 7,621, with the Nasdaq off 1.4% as semiconductors extended a slide driven by worries that hyperscaler capital spending will disappoint. Energy was the only sector to gain Friday, and Travelers jumped 9% on an earnings beat that lifted the insurers. The breadth beneath the surface remains encouraging: 88% of early S&P 500 reporters have topped earnings estimates, against a five-year average of 78%, and eight of eleven sectors rose Thursday even as the indexes fell. Gold tells the same story from the other direction, drifting near $4,010 and down more than a quarter from January’s record despite nine nights of strikes, because a firm dollar and a Fed with a tightening bias are more powerful than the safe-haven bid. Housing rounded out the week’s data with June starts beating expectations while permits fell short, another cooler-for-longer reading with mortgage rates at 6.55%.
What CFOs and Treasurers Should Do Now
Extend energy hedges before the forward curve catches up. The back of the crude curve still prices substantial normalization. Layering calendar 2027 diesel and jet fuel coverage on pullbacks is cheaper insurance than it will be if the strait stays shut through August.
Term out funding while credit windows are open. Spreads remain tight and the earnings beat rate is running at 88%, well above the five-year average. With our rate path pointing up rather than down, opportunistic issuance beats waiting for cuts that are not coming.
Put Hormuz and the Red Sea in the same contingency review. War-risk insurance, freight surcharges and routing alternatives should be priced as sticky through year-end. Surcharges reset weekly and pass through faster than contract rates.
Keep cash working but liquid. Treasury bills near 3.8% remain the treasurer’s friend. Resist reaching for duration in the liquidity book while the term premium is still rebuilding.
Refresh sanctions and counterparty screening. Momentum behind secondary sanctions on Russian oil buyers accelerated last week. Energy and shipping counterparties in the Gulf deserve a fresh compliance pass.
Plan for a tight labor market, not a weak one. The participation decline is a supply story. Budget for continued wage pressure in labor-intensive functions and lean into automation where the business case was marginal a year ago.
The Week Ahead
The calendar is light and the Fed is quiet, which leaves the Gulf in charge. Jobless claims arrive Thursday, with S&P Global flash PMIs and new home sales closing the week Friday. Alphabet and Tesla report Wednesday after the close and Intel follows Thursday, with Alphabet the cleanest read on whether AI capital spending plans survive the chip correction. The Fed is in blackout ahead of the July 28–29 FOMC. The indicators that matter most will not be on the calendar: daily tanker transit counts through the strait, the Kuwaiti response to the desalination plant strike, and whether the Houthi threat to the Red Sea moves from instruction to action. We would also keep an eye on wholesale gasoline, where the war’s second price wave is already forming.
U.S. Economic & Financial Outlook
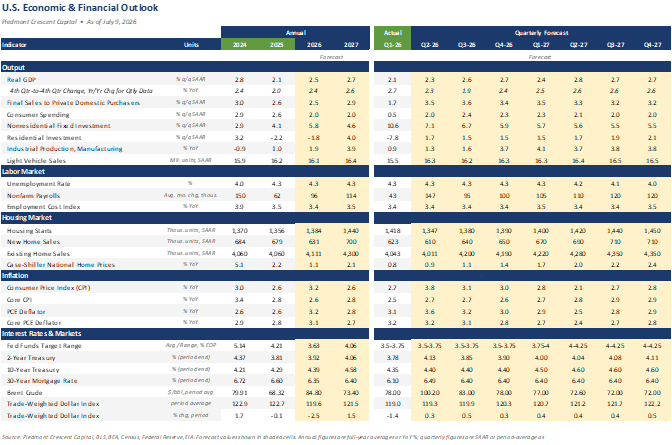
Source: Piedmont Crescent Capital, BLS, BEA, Census, Federal Reserve, EIA. Forecast values shown in shaded cells. Annual figures are full-year averages or year-over-year percent changes; quarterly figures are seasonally adjusted annual rates or period averages as noted in Units.
Forecast disclaimer: The projections above reflect Piedmont Crescent Capital’s views as of the date shown and are subject to change without notice. They are provided for informational purposes only, are not a guarantee of future results, and do not constitute investment advice or a recommendation to buy or sell any security. Actual outcomes may differ materially.
Mark P. Vitner – President & Chief Economist, Piedmont Crescent Capital
mark.vitner@piedmontcrescentcapital.com · (704) 458-4000
About Piedmont Crescent Capital. Piedmont Crescent Capital provides economic research and advisory services covering U.S. and regional economic conditions, financial markets, housing and commercial real estate. A View from the Piedmont is published weekly. Sources: U.S. Bureau of Labor Statistics; U.S. Census Bureau; Federal Reserve; U.S. Social Security Administration; CNBC; Reuters; Trading Economics; company reports. Chart sources appear beneath each exhibit. This commentary is for informational purposes only and does not constitute investment advice. © 2026 Piedmont Crescent Capital, LLC. All rights reserved.