
Strait Out of Hormuz
Renewed Fears at the Pump and Growing Concerns That the AI Boom Will Not Be Profitable Enough to Justify the Investment Boom
Inflation Finally Broke the Fed’s Way. Payrolls Slowed, but So Has Labor Supply. The Truce Is Fraying at Sea and the AI Trade Is Being Repriced. We Hold Our No-Cut Base Case, with Risks Now Roughly Balanced.
This Month's Key Points
- The energy refund arrived at the register. June CPI fell 0.4%, the largest one-month decline since April 2020, pulling the annual rate down to 3.5% from 4.2% as gasoline dropped 9.7%. Core prices were flat on the month, easing the core rate to 2.6%, and producer prices fell 0.3%, taking annual PPI to 5.5% in its first deceleration in five months. Our HP-filtered estimate of trend core inflation eased to roughly 2.6%, and the spread across the four underlying-inflation gauges we track is now the narrowest of the cycle. The war-driven price spike is being refunded, at least partially for now.
- Payrolls slowed to 57,000 in June, and the labor market still tightened. April and May were revised down a combined 74,000, yet the unemployment rate fell to 4.2% as the participation rate slid to 61.5%, the lowest since March 2021. With Fed staff research putting labor force growth below 10,000 per month, a 57k print remains above breakeven. Jobless claims fell to 208,000 in mid-July. Leisure and hospitality shed 61,000 jobs on slower-than-usual seasonal hiring; the drop might also reflect an earlier than usual pickup in hiring, reflecting an early Memorial Day, as well as hiring ahead of the World Cup.
- The cyclical broadening is intact, but the second quarter carries an asterisk. ISM Manufacturing posted its sixth consecutive expansionary reading at 53.3 in June, and core retail sales rose 0.5% on top of May’s outsized 0.8% gain. Yet the Atlanta Fed’s GDPNow is tracking Q2 at 1.7% as of this morning’s update, lifted by the housing starts surge but still well below the spring pace. We read the gap as largely war distortion working through trade, inventories and energy-squeezed consumption, and we hold our above-consensus 2.5% full-year growth call, while conceding the risks around it are no longer tilted higher.
- The AI trade is being repriced, not repealed. Semiconductor shares are roughly 20% off their recent highs, Netflix fell double digits on earnings, and the S&P 500 has backed off the June 2 record of 7,621. The 10-Year completed a round trip, touching 4.62% Monday before rallying to the mid-4.50s as the inflation data cooled and safe-haven flows returned. Futures-implied odds of a July hike collapsed to roughly 17% from north of 40% after CPI.
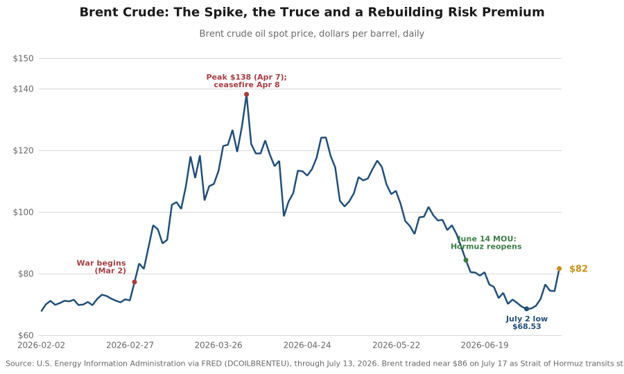
- The truce frayed badly at sea. After Iranian attacks on commercial shipping, US forces have struck Iranian targets on six consecutive nights and the IRGC has again declared the Strait of Hormuz closed. Brent traded from a July 2 low of $68.53 back to roughly $87 by Friday afternoon. Senator Lindsey Graham’s sudden passing, one day after announcing a White House-endorsed agreement on his Russia sanctions bill, has accelerated momentum toward secondary sanctions on Russian oil buyers, one more reason a risk premium stays embedded in crude.
- Our scenario probabilities move to 55/15/30 from 60/20/20. The base case still has the flare-up contained, diplomacy resuming and the Warsh Fed on an extended hold, with no cut in 2026 and the next move a hike, which our updated forecast pencils in for the first half of 2027. But the re-closure of the strait forces us to carry a fatter adverse tail than we did in June.
Market Snapshot
| Indicator | Level | Context |
|---|---|---|
| Brent Crude | ~$87 / bbl | Up about 3% Friday after the reported strike on Kuwaiti water infrastructure; still well below the April peak of $138. Our base case has Brent settling near $78 by year-end, with upside risk while the strait stays shut. |
| WTI Crude | ~$81.50 / bbl | Rose about 3% Friday on the renewed fighting in the Gulf. |
| 10-Year Treasury | 4.54% | Touched 4.62% Monday, then rallied on the soft CPI and PPI and Friday’s safety bid; the term premium keeps our year-end base case at 4.40% with 4.70% upside. |
| 30-Year Fixed Mortgage | 6.55% | Freddie Mac weekly average, up from 6.49%; housing stays cooler-for-longer until spreads narrow. |
| Fed Funds Target | 3.50–3.75% | Hold expected July 28–29; market-implied July hike odds collapsed to ~17% from north of 40% after CPI. |
| Headline CPI (June) | 3.5% YoY | Fell 0.4% on the month, the largest decline since April 2020; energy did nearly all the work, in reverse this time. |
| Core CPI (June) | 2.6% YoY | Flat on the month; ex food, shelter and energy, prices fell 0.1% and are up just 2.1% over the year. |
| PCC HP-Filter Trend | 2.6% | Our trend estimate of underlying core inflation; Cleveland trimmed measures 2.6–2.7%, Dallas trimmed mean PCE 2.4%. The gauges are converging on the mid-twos. |
| Headline PPI (June) | 5.5% YoY | Fell 0.3% on the month, the largest decline in over a year; core PPI at 4.7%. |
| June Payrolls | +57k / 4.2% | April-May revised down 74k; unemployment fell on a participation slump to 61.5%. Above breakeven even at 57k. |
| ISM Manufacturing | 53.3 | Sixth straight month of expansion, off May’s four-year high of 54.0. |
| Atlanta Fed GDPNow (Q2) | 1.7% | Raised from 1.3% in this morning’s update on the housing starts surge; the war-distorted quarter. We look for a stronger second half as fuel-price relief repairs purchasing power. |
| Housing Starts (June) | 1.427M | +19% on the month, nearly all of it coming from the volatile multifamily segment (513k); single-family slipped to 895k and permits fell 3.0%. |
| UMich Sentiment (July prelim) | 54.4 | Released this morning; a five-month high, up from 49.5 in June, with one-year inflation expectations easing to 4.2% from 4.6%. |
| S&P 500 | Off record highs | June 2 record of 7,621; semiconductors in a ~20% correction as the AI trade reprices against a higher cost of capital. |
Sources: BLS, BEA, Census, EIA, Freddie Mac, CME Group, Atlanta Fed, ISM, FactSet. As of midday Friday, July 17, 2026.
“The refund is arriving at the register just as the risk premium rebuilds at sea. The Fed can be patient with both. It cannot print oil, and it should not tax a capital cycle to fight a fuel surcharge that is already being rebated.”
— Mark P. Vitner, Chief Economist, Piedmont Crescent Capital
The Macro Backdrop: The Refund and the Reprieve
A month ago we argued the war piece of the economy was beginning to take a back seat to the cyclical piece. June’s data delivered the evidence, and July’s geopolitics promptly complicated it. The June CPI fell 0.4%, as gasoline handed back 9.7% and the annual rate dropped to 3.5% from May’s 4.2%. Producer prices fell 0.3%, with the annual rate easing for the first time in five months. Real average hourly earnings jumped 0.8% in June and turned positive over the year for the first time since the war began. The imported tax we have described all year is being partially refunded, and the refund is landing first on the households that paid the most regressive share of it.
At the same time, the re-closure of the Strait of Hormuz has interrupted the energy normalization that made the refund possible. Brent has climbed from $68.53 on July 2 back to roughly $87, tanker throughput through the strait has fallen to a small fraction of normal, and no large commercial vessels have broadcast positions along the strait’s southern route since July 7. Fading pass-through at the register and a rebuilding risk premium at sea frame this month’s outlook, and they are why we carry both a friendlier inflation forecast and a fatter adverse tail than we did in June.
The deeper story has not changed. This remains a capital-led, employment-light expansion, powered by AI infrastructure, reshoring, defense replenishment and the productivity gains they finance. The manufacturing recession of 2024–2025 is fading away: ISM Manufacturing has now expanded six consecutive months. What is new is that the market is finally asking the capital cycle to justify its cost of capital, with semiconductor shares roughly 20% off their highs. We view that repricing as a test of valuations rather than of the underlying investment demand, which continues to show up in orders, backlogs and power procurement.
The Labor Market: Soft Prints, Tight Market
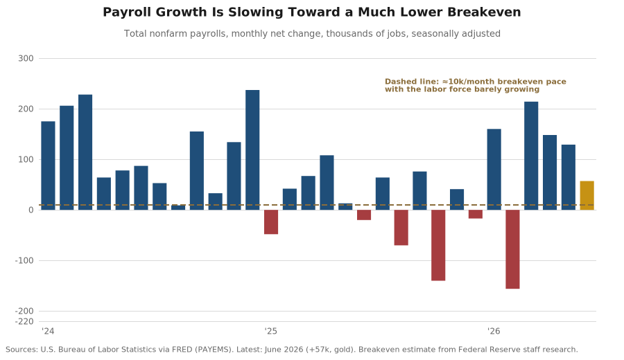
Employers added 57,000 jobs in June, roughly half the consensus, and April and May were revised down a combined 74,000. The unemployment rate fell anyway, sliding to 4.2%. The reconciliation of those two facts is the single most important thing to understand about this labor market: the labor force is barely growing. Participation slid 0.3 percentage points to 61.5%, the lowest since March 2021, as demographics and the immigration reversal both work against supply. Fed staff research puts labor force growth below 10,000 workers per month, which means breakeven payrolls sit near zero. A 57k month does not loosen this market; arithmetically, it tightened it. We suspect that the Fed staff’s estimate is too low but even if breakeven payrolls is near 50,000 jobs a month, job growth is still likely to exceed that pace, leading to higher wages and higher inflation.
The composition tells the same story we told last month, in reverse. Leisure and hospitality shed 61,000 jobs on slower-than-usual seasonal hiring, the beginning of the World Cup giveback we warned readers to expect, as an unusually early Memorial Day and the World Cup lifted hiring at restaurants and bars a little sooner than usual, which was amplified by seasonal adjustment. Professional and business services added 36,000 jobs, social assistance 25,000 and health care 22,000. Jobless claims fell to 208,000 in the July 11 week, and the Beige Book described employment rising on balance across the districts. Layoffs remain rare, hiring is deliberate and the labor supply behind both has stopped growing, which is why soft-looking payroll prints keep coinciding with a falling unemployment rate.
Inflation: The Refund Arrives, the Trend Converges
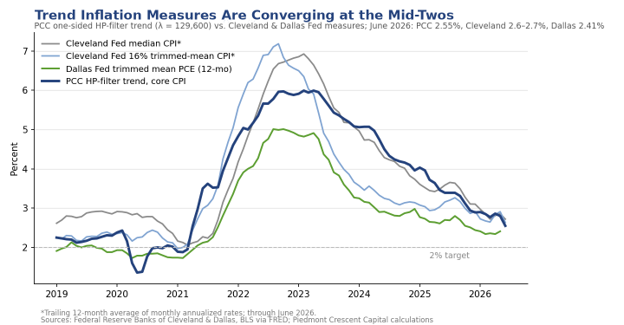
June’s inflation reports were the best of the cycle, and the details were more persuasive than the headline. The 0.4% headline decline was almost entirely energy driven: the energy index fell 5.7%, gasoline 9.7% and fuel oil 9.2%. But core prices were flat on the month (against expectations for a 0.2% rise) and the annual core rate eased to 2.6% from 2.9%. Strip out food, shelter and energy and prices actually fell 0.1% in June, leaving that cleanest cut up just 2.1% over the year. Shelter rose 0.1%, the smallest monthly increase since January 2021, with rent of primary residence slowing to 2.8% annually. Motor vehicle insurance fell a further 2.0% and is now down 4.1% over the year, an underappreciated source of disinflation in the core.
Our HP-filtered estimate of trend core inflation eased to roughly 2.6% in June from 2.8% in May, extending an almost unbroken glide from 3.4% a year ago. The convergence across gauges is the real news: the Cleveland Fed’s trimmed measures now sit at 2.6–2.7% on a trailing basis, the Dallas trimmed mean PCE at 2.4% through May, and the spread across all four measures is the narrowest of the cycle. When the gauges that make different compromises in the composition all point to the same mid-twos destination, the trend is the signal. The June PCE report at month-end, the last clean read before the BLS and BEA methodology changes take effect with the August releases, should confirm it. We estimate those changes will trim roughly 0.2 percentage points from measured year-over-year core PCE.
Two caveats keep us from declaring the final mile complete. First, households have not felt it yet: the New York Fed’s one-year inflation expectation rose to 3.7% in June, the highest since September 2023, and the three-year measure hit a four-year high. This morning’s Michigan survey offered the first crack in that wall, however, with one-year expectations easing to 4.2% from 4.6%. Expectations follow lived experience with a lag, and the price level is still a burden even as its rate of change improves. Second, our technology watch item is live. The AI memory-chip shock is arriving the way hedonic indexes receive cost shocks: not as price spikes but as the disappearance of routine deflation. Computers and smart-home equipment are down just 0.8% over a year in a category built to deflate several times that fast. If memory costs stay elevated into the fall, the tech aisle flips from a drag on core goods to a modest contributor just as tariff pass-through fades.
Growth and Housing: Broadening, with a Second-Quarter Asterisk
The cyclical broadening we described in June remains visible in the surveys and the orders data, but the second quarter’s GDP arithmetic will not flatter it. The Atlanta Fed’s GDPNow has Q2 tracking at 1.7% as of this morning’s update, lifted from 1.3% by the housing starts surge, though still down sharply from the 3%+ readings of mid-June. We attribute most of the gap to war distortions: the energy price shock squeezed real consumption in April and May, trade and inventory flows whipsawed around the strait closure, and the June relief arrived too late in the quarter to rescue the average. Retail sales rose 0.2% in June on top of May’s outsized gain, ISM Manufacturing held expansionary at 53.3, industrial production edged up 0.1% in June, and this morning’s preliminary July reading from the University of Michigan showed sentiment jumping to 54.4, a five-month high. Our own tracking puts second quarter growth closer to 2.3%, with final sales to private domestic purchasers rebounding to roughly a 3.5% pace. We hold our 2.5% full-year growth call, which now leans on a stronger second half as cheaper fuel repairs household purchasing power, while conceding that the risks around the call are no longer tilted higher. The renewed Hormuz closure is the swing variable: each month it persists shaves the energy relief that our second-half acceleration depends on.
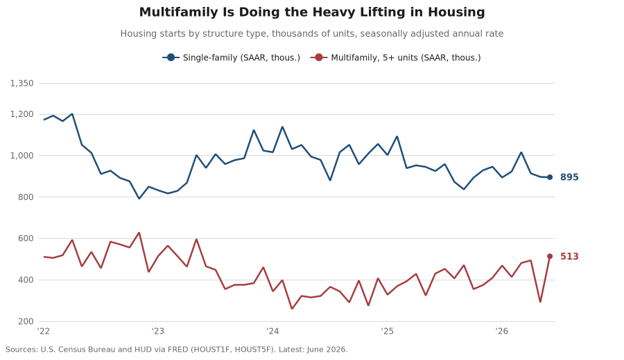
Housing showed both of its faces in June. Total starts jumped 19% in June to a 1.427 million-unit pace, comfortably beating expectations, and nearly all of the surge was multifamily, which soared to 513,000 after a depressed May. Single-family starts slipped 0.2% to 895,000, permits fell 3.0%, and the Freddie Mac 30-year rate ticked up to 6.55%. The multifamily strength is real: rental demand is firm precisely because the for-sale market is locked up, and developers who shelved projects in the high-rate years are restarting them into tight vacancy. Single-family construction, however, is likely to stay range-bound until mortgage rates break meaningfully below 6.5%, and with the deficit outlook holding the term premium up, that break is unlikely before the Fed’s path clarifies. Existing sales at 4.09 million and flat prices tell the same story: housing turns when rates do, and rates turn on the inflation trend and the strait.
Markets and Rates: The AI Trade Meets the Cost of Capital
The correction we warned about arrived on schedule, and it arrived where we said the risk was concentrated. In June we wrote that a market this concentrated in one theme can correct hard without the economy doing anything wrong. Semiconductor shares are now roughly 20% below their recent highs, the sell-off deepened globally into Friday on a new Chinese model release and fresh questions about hyperscaler capex, and Netflix’s double-digit earnings-day decline showed how little forgiveness is priced into richly valued growth stories. SK Hynix’s record $26.5 billion US listing marked the top of the enthusiasm almost to the day. The S&P 500 has pulled back only modestly from its June 2 record of 7,621, however, with a sharp rotation underneath as financials, industrials and energy absorb the flows leaving the chips.
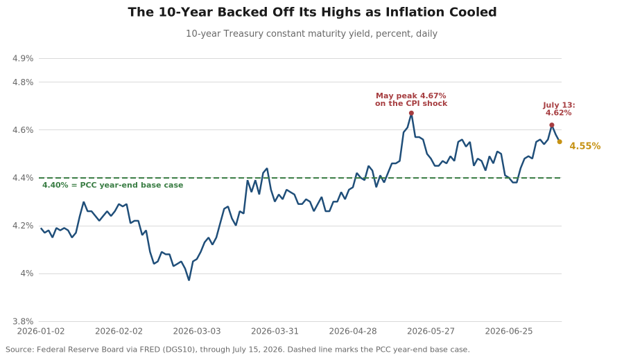
We would resist the temptation to read the correction as a verdict on the capital cycle. Earnings, not multiples, have carried this market all year; Q1 margins set records and the Q2 season now underway will test whether that holds. The features of durable market tops (speculative mania, deteriorating growth, a flood of issuance, a tightening Fed) remain mostly absent, though the SK Hynix episode shows issuance appetite testing its limits. The bond market, meanwhile, delivered a round trip that validates patience: the 10-Year touched 4.62% on Monday, then rallied through the soft CPI and PPI to the mid-4.50s, with Friday’s safe-haven bid taking yields lower still across the curve. Futures-implied odds of a July hike collapsed from 42% to roughly 17% over two sessions. The term premium story has not gone away (deficits and issuance guarantee that), which is why we hold a 4.40% year-end base case rather than chasing the rally, with 4.70% the upside marker if the adverse scenario materializes.
Geopolitics: A Fraying Truce and a Sudden Loss
The June 14 memorandum of understanding is, for practical purposes, lost at sea. After Iranian missile attacks on three commercial vessels transiting the strait, the first such attacks since the MOU was signed, US Central Command has struck Iranian targets on six consecutive nights, more than 300 of them in the first three, including missile and drone sites, naval assets and coastal surveillance positions. Iran claims retaliatory strikes on US facilities across the Gulf, and Kuwait reported an Iranian attack on a power and desalination plant early Friday. The IRGC has again declared the strait closed, and tanker traffic has all but stopped, with no large vessels broadcasting positions along the Oman-hugging southern route since July 7. President Trump has declared the MOU over while insisting talks will continue, and diplomacy is in fact continuing: Foreign Minister Araghchi traveled to Muscat, Oman for talks, Oman has drafted a traffic-management proposal, and Qatari mediators remain engaged. Oil’s measured response (Brent near $87 rather than anywhere near the spring’s $138) suggests the market still expects this flare-up to be contained. We agree, but with less conviction than a month ago, which is what our 30% adverse probability expresses.
Senator Lindsey Graham’s untimely death adds a poignant and consequential twist to the Russia file. Graham died July 11 of an aortic tear at 71, one day after announcing in Kyiv that the White House would support a version of his long-pending sanctions bill, co-authored with Senator Blumenthal. The bill would authorize sweeping tariffs and secondary sanctions on countries purchasing Russian oil and gas, aimed squarely at China, India and Brazil, and colleagues in both parties are urging swift passage as a tribute. Enactment prospects have improved markedly at the very moment Gulf flows are disrupted, stacking a second supply risk on top of Hormuz. The Russia-Ukraine war may be approaching its own inflection as well: Washington has agreed to license Patriot production in Ukraine, Ukrainian long-range drones are striking refineries deep inside Russia, and the Russian economy is flirting with recession and a budget crisis. Both diplomatic momentum and escalation risk are rising at once, which is the environment in which energy and defense markets move fastest. South Carolina’s August 11 special primary begins the contest for Graham’s seat and for the bridge role he played between the administration and the Senate.
Monetary Policy: Patience, Priced
The July 28–29 FOMC meeting arrives with the decision effectively made and the framing the only live question. A hold keeps the funds rate at 3.50–3.75%, where it has sat all year. What changed this month is the balance of risks around it. In June, the committee’s hawkish projections and the May inflation spike had futures markets pricing 50 basis points of hikes through mid-2027; we called that an overcorrection, and the June CPI proved the point in a single morning, with hike odds collapsing to roughly 17%. Chair Warsh’s semiannual testimony this week walked the line his ECB Forum remarks drew: inflation “too high” but improving, no forward guidance, and a pointed refusal to submit a dot, making him the first chair to withhold one since the plot began in 2012. The June minutes revealed a committee split almost evenly between holders and hikers; the July data should thin the hikers’ ranks considerably.
Our view evolves with the evidence. We hold our no-cut base case for 2026, and we continue to think the next move, whenever it comes, is more likely a hike than a cut, driven by growth pressing into a full-employment labor market with no labor supply behind it. Our updated forecast now pencils in the first quarter-point hike in the first quarter of 2027 and a second by midyear, taking the funds rate to 4.00–4.25%, earlier than the late-2027-or-2028 timing we carried in June. But the June report removed the near-term hike tail, and we now describe the risks around the extended hold as roughly balanced rather than tilted toward tightening. Two things could still disturb the patience: an expectations problem (the New York Fed survey’s drift higher is the number we watch most) and a sustained strait closure that re-runs the spring’s energy passthrough. Neither is our base case. The August statistical-methodology changes, which we estimate will trim about 0.2 percentage points from measured core PCE, will complicate the autumn’s inflation debate just as the committee’s patience is being tested; expect hawks and doves alike to claim vindication from the same releases.
CFO & Treasurer Corner
Funding and liquidity: The post-CPI rally reopened the fixed-rate issuance window at better levels than any point since April. With the FOMC on July 28–29 and the strait situation fluid, the two weeks after the meeting may offer the month’s best conditions, or its worst. Issue opportunistically rather than on a calendar. Floating-rate borrowers should stress coverage on hikes beginning in early 2027; our updated forecast has the funds rate at 4.00–4.25% by midyear 2027.
Energy and input costs: The July 2 lows were the year’s best forward-hedging levels, and firms that acted on last month’s guidance to hedge “while forward prices remain well below the spring peaks” are being rewarded. Forwards have risen with spot but remain far below the war highs; treasurers with Gulf-exposed logistics should extend coverage on any diplomatic bounce. Track electronics and memory-chip costs separately from energy: the equity correction in semiconductors does not translate into cheaper components, and contract prices are still rising.
Russia sanctions contingency: Passage of the Graham-Blumenthal bill now looks probable rather than possible. Firms with Chinese, Indian or Brazilian counterparties should map secondary-sanctions exposure through shipping, insurance and settlement chains before enactment forces the exercise on a deadline.
Labor and wages: Discount the July and August payroll prints for World Cup givebacks; June’s leisure and hospitality decline was the preview. Seasonals are likely to play with the leisure and hospitality numbers all summer, as Labor Day comes unusually late, keeping summer workers on the payroll longer than usual. The structural reality is unchanged: no labor supply, scarce-category wage pressure, and productivity as the only sustainable offset. Budget for tight skilled-labor conditions through 2027.
Planning assumption: Base case: an extended Fed hold with no 2026 cut and quarter-point hikes beginning in early 2027, Brent settling near $78 by year-end if diplomacy reasserts itself, the 10-Year near 4.40% and full-year growth near 2.5% on a stronger second half. Keep a strait-stays-closed case (oil above $110, headline inflation re-accelerating, the Fed pinned) live for Q3 board discussions, at 30% rather than 20% weight.
Looking Ahead
| Date | Release / Event | Why It Matters |
|---|---|---|
| Wed, Jul 22 | Existing Home Sales (June) | The rate-sensitive corner’s cleanest read; watch inventory more than sales; supply is the missing ingredient. |
| Fri, Jul 24 | Flash PMIs (July); New Home Sales (June) | First July read on whether the capital-cycle momentum survived the chip correction and the strait re-closure. |
| Tue–Wed, Jul 28–29 | FOMC meeting and press conference | A hold is near-certain. The story is whether the statement acknowledges the improved inflation trend and how Warsh frames the energy tail risk. |
| Thu, Jul 30 | Q2 GDP, advance estimate | The war-distorted quarter. Look through the headline to final sales to private domestic purchasers for the true pulse. |
| Fri, Jul 31 | June PCE deflator; ECI (Q2); Dallas trimmed mean | The last clean read on the Fed’s preferred gauge before August’s methodology changes muddy year-over-year comparisons. |
| Fri, Aug 7 | July Employment Situation | World Cup givebacks begin in earnest. Discount the headline; watch participation and the diffusion indexes. |
Scenario Framework
| Scenario | Macro and Market Implications | Corporate Finance Action |
|---|---|---|
| Base Case (55%) | The flare-up is contained; Muscat-track diplomacy restores a managed reopening of the strait through the fall. Brent settles near $78 by year-end, headline CPI drifts toward 3% as the energy passthrough unwinds, and the HP trend holds in the mid-twos. The Warsh Fed holds all year with no cut; quarter-point hikes follow in the first half of 2027, taking the funds rate to 4.00–4.25% by midyear. The 10-Year finishes near 4.40%; the S&P grinds higher on earnings as the chip correction resolves without spreading. | Lock fixed-rate funding on post-FOMC strength. Maintain productivity-led capex with disciplined hurdle rates. Model no 2026 cut; keep 2027 hike risk in coverage tests. Extend energy hedges on diplomatic bounces. |
| Benign (15%) | A new, more durable agreement reopens the strait quickly. Brent breaks below $70; the energy refund accelerates and headline CPI approaches the core rate by year-end. Real income gains lift the rate-sensitive sectors (single-family housing, autos and other durables) into the broadening, and the Fed’s patience is rewarded with a soft landing on trend. Equities extend gains on breadth, not concentration. | Step up capex against an extended hold. Open the refinancing window fully. Add exposure to energy-sensitive demand recovery and rate-sensitive sectors. |
| Adverse (30%) | The strait stays closed into the autumn or the conflict widens. Brent averages above $110 with spikes higher; headline CPI re-accelerates through 4% and the trimmed gauges follow with a lag. Inflation expectations break higher and the Fed is pinned between imported inflation and a slowing consumer; a hike returns to the table for late 2026. The 10-Year tests 4.70%+ and the chip correction turns into a broader selloff. | Build liquidity now. Stress floating-rate exposure and covenant headroom at 10-Year 4.70%+. Hedge energy and freight aggressively on any dip. Defer non-essential capex; shorten working-capital cycles. |
Forecast Update
Piedmont Crescent Capital | As of July 17, 2026
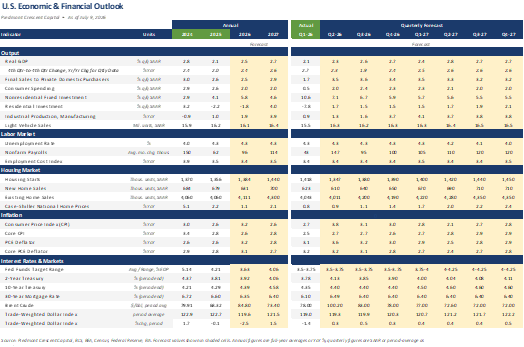
Forecast disclaimer: The projections above reflect Piedmont Crescent Capital’s views as of the date shown, are subject to change without notice and do not constitute investment advice.
Strategic Takeaway
A month ago, we said we might have to stand alone in arguing that the next Fed move would be driven by growth into full employment rather than by the inflation overshoot. June’s data moved the consensus toward us. The overshoot is unwinding on schedule: headline inflation is at 3.5% and falling, core is at 2.6%, and every underlying gauge is converging on the mid-twos. What remains is the framework we have carried all year: a capital cycle broadening beyond AI, a labor force that has stopped growing, a consumer whose real paycheck finally caught a break and a Fed with room to be patient. The complications are the strait, which has re-closed and taken our adverse probability to 30%, and the chip correction. For CFOs: take the improved issuance window seriously, extend energy hedges on diplomatic bounces, map secondary-sanctions exposure before the Graham-Blumenthal bill forces the timeline, and discount the labor headlines seasonal quirks are amplifying. We remain constructive on the expansion, but the second-half acceleration our 2.5% growth call now leans on requires the energy refund to resume, and that will not happen until tankers are again moving freely through the strait.
Mark P. Vitner – Chief Economist, Piedmont Crescent Capital
Questions? Email: CompassReport@cavusecurities.com
About The CAVU Compass. The CAVU Compass is a monthly macroeconomic outlook and market commentary published by CAVU Securities, LLC and Piedmont Crescent Capital. © 2026 CAVU Securities, LLC / Piedmont Crescent Capital. This publication is for informational purposes only and is not a recommendation, offer, or solicitation with respect to any security or other financial product, nor does it constitute investment advice. Forward-looking statements are subject to change at any time; information from external sources has not been verified but is generally considered reliable.