
An Energy Refund, a Paycheck Reprieve
Gasoline hands back part of the spring surge, pulling the headline down 0.4% and the annual rate to 3.5%, while core slips to 2.6% and real earnings turn positive.
Early Signals
- Energy gave it back. Headline CPI fell 0.4% in June, the largest one-month decline since April 2020, as gasoline dropped 9.7%. The 12-month rate fell to 3.5% from 4.2%.
- Core went quiet. The core index was unchanged on the month, easing the annual rate to 2.6%, and our HP-filtered trend estimate puts underlying inflation just above 2.5%.
- Paychecks caught a break. Real average hourly earnings jumped 0.8% in June and turned positive on a year-over-year basis, up 0.1%, after running negative through the spring.
- Expectations cut the other way. The New York Fed’s one-year inflation expectation rose to 3.7%, the highest since September 2023, a reminder that households have not yet felt the relief.
Key Takeaways
| Key Concept | Findings |
|---|---|
| Headline CPI | Fell 0.4% in June after rising 0.5% in May, the largest monthly decline since April 2020. The 12-month rate eased to 3.5% from 4.2%. Energy did nearly all of the work, in reverse this time. |
| Energy | Down 5.7% on the month as gasoline fell 9.7% and fuel oil dropped 9.2%. Even after June’s retreat, energy is up 15.7% over the year and gasoline 26.7%. |
| Core CPI | Unchanged in June after a 0.2% rise in May, lowering the annual rate to 2.6% from 2.9%. Stripping food, shelter, and energy, prices fell 0.1% and are up just 2.1% over the year. |
| HP-Filtered Trend | Our one-sided HP-filter estimate of trend core inflation eased to roughly 2.6% in June from 2.8% in May, continuing a steady glide. With this morning’s June update, the Cleveland Fed trimmed measures eased to 2.6–2.7%, and the Dallas Fed trimmed mean PCE sits at 2.4% through May. |
| Shelter | Up just 0.1%, the smallest monthly increase since January 2021. Owners’ equivalent rent rose 0.2% and rent of primary residence 0.1%; over the year, rent has slowed to 2.8%. |
| Real Earnings | Real average hourly earnings rose 0.8% in June and are up 0.1% over the year, after running negative through the spring. Production workers’ real pay rose 0.8% on the month. |
| Policy Signal | The report removes the hike tail without making the case for a cut. Expectations at 3.7% one-year ahead argue the Warsh Fed stays patient. We hold our no-cut base case with risks now roughly balanced. |
The Overview
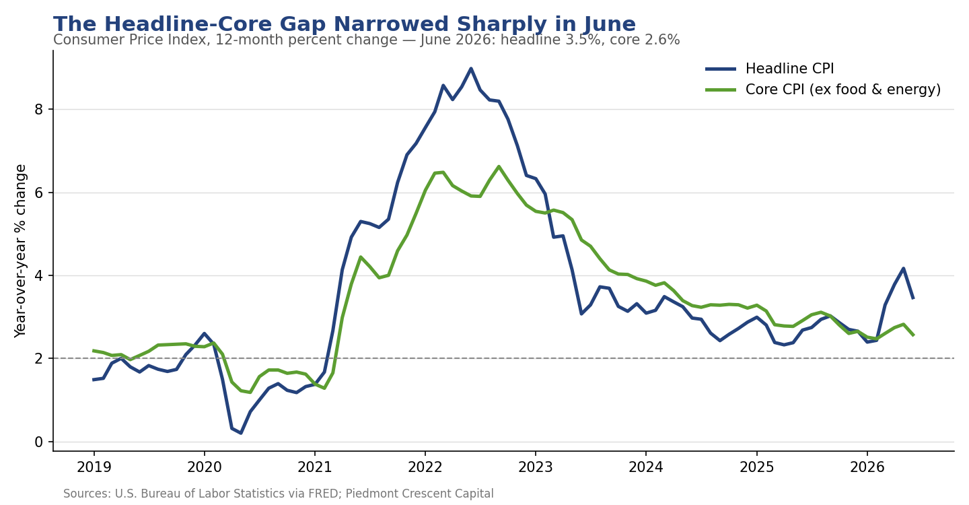
The June inflation report is the fourth installment of the energy story, and the first one told in reverse. For three months a surge in energy prices did most of the work pushing the headline higher; in June the pump gave a good part of it back. The Consumer Price Index fell 0.4%, the largest one-month decline since April 2020, and the 12-month rate dropped to 3.5% from 4.2% in May. The energy index alone fell 5.7%, more than offsetting modest increases in food and shelter.
Just as we cautioned against reading the spring’s four handle as evidence of reigniting inflation, we would caution against reading June’s negative print as the arrival of disinflation’s final mile. What changed, again, was the price of a gallon of gasoline. The more meaningful development sits underneath: core prices were flat on the month, shelter posted its smallest increase in over five years, and the measures that strip away the noise point to an underlying trend in the mid-twos. The quiet in this report is more persuasive than the drama.
Energy Gave Back the Spring Surge
The energy index fell 5.7% in June, its largest monthly decline since April 2020, as gasoline dropped 9.7% and fuel oil fell 9.2%. Electricity slipped 1.0%, while natural gas rose 0.5%. The reversal was broad enough that energy more than offset every increase elsewhere in the index. Even so, the year-over-year arithmetic remains lopsided: energy is still up 15.7% from a year ago and gasoline 26.7%, so the cumulative bill from the spring shock has hardly been refunded in full.
The distributional point we made in May now runs in the other direction. The same households that absorbed the most regressive form of inflation on the way up capture the most immediate relief on the way down. A cheaper commute and grocery run provide the greatest immediate relief on the budgets with the least slack, which is why the real-earnings reversal later matters more than the headline.
Core Inflation: Quiet, and Quietly Softer
The core index was unchanged in June after a 0.2% rise in May, lowering the annual rate to 2.6% from 2.9%. The internals read like a disinflation checklist. Motor vehicle insurance fell 2.0% on the heels of a 1.7% May decline and is now down 4.1% over the year, a quiet, underappreciated force working through the core. Communication costs fell 1.5%, apparel declined 0.6%, and used vehicles slipped 0.2%. Medical care edged down 0.1% as physicians’ services and prescription drugs both declined. The offsets were modest: recreation rose 0.5%, household furnishings and personal care each gained 0.2%, and airline fares, which are up 26.5% over the year, added just 0.2% on the month.
The cleanest exclusion-based cut of the data (all items less food, shelter, and energy) fell 0.1% in June and is up just 2.1% over the past year. Food was similarly calm, rising 0.2%, with eggs bouncing 4.3% on the month, although they remain down nearly 28% from a year ago, and coffee prices fell 2.0%. Breadth, the thing we watch most closely for evidence of second-round effects from the energy shock, narrowed rather than widened in June.
The Underlying Trend: Our HP-Filter Read
Our HP-filtered estimate of trend core inflation stands at roughly 2.6% as of June, down from 2.8% in May and 2.9% at the turn of the year. The trend has now descended in an almost unbroken line from 3.4% a year ago, and June’s soft core reading extended the glide path rather than bending it.
Each of the popular measures of underlying inflation makes a different compromise. Core CPI excludes food and energy every month, whether or not those categories carry signal. The Cleveland Fed’s median CPI and 16% trimmed-mean CPI, and the Dallas Fed’s trimmed mean PCE, discard the outliers in each month’s cross-section of price changes but still treat every month in isolation. The HP filter works along the other dimension: it uses the full run of monthly data to separate a slow-moving trend from transitory noise, without throwing out any category. When a shock is genuinely temporary, the filter looks through it; when a shock persists, the trend moves, which is precisely the distinction policymakers need.
The spring provided a live demonstration. The Cleveland measures spiked to annualized rates near 5% in April as the energy shock bled into enough categories to survive the trim, then retreated over the following two months; with this morning’s June update, their trailing 12-month averages have eased to 2.7% and 2.6%. The Dallas Fed’s trimmed mean PCE, at 2.4% through May, never flinched. Our filtered estimate split the difference and, more importantly, never treated the spring as a change in trend. The June readings from Cleveland, released mid-morning, sealed the point: the median CPI rose at just a 2.1% annualized rate and the trimmed mean was essentially flat. Our filter puts underlying core inflation a touch above 2.5%, and the spread across all four measures is now the narrowest of the cycle. The measures are converging on the same conclusion from different directions: the trend is in the mid-twos and drifting lower.

Shelter: The Anchor Slips Further
Shelter rose just 0.1% in June, the smallest monthly increase since January 2021, and the category’s key components are finally telling the same story. Rent of primary residence rose 0.1% and has slowed to 2.8% over the year, a level consistent with the new-lease data that has pointed lower for two years. Owners’ equivalent rent, the heavier and stickier piece, rose 0.2% and is running at 3.3% annually. Lodging away from home fell 2.3%, adding to the month’s softness. Room rates had risen the prior month, likely due to the arrival of the World Cup. Because shelter carries more than a third of the index’s weight, a shelter category growing at a 2½-to-3% pace is the single most powerful argument that core inflation’s descent has further to run.
Technology Prices: Looking for the Memory Shock
We flagged one category for special attention this month: technology goods, where soaring memory-chip costs have been expected to pressure retail prices. The pass-through has not arrived as higher consumer prices, at least not yet, but it is visible as slower deflation. Information technology commodities fell 0.9% in June and are down 7.2% over the year, and smartphones are down 11.9%. Those are steep declines by ordinary standards, but these are categories built to fall as quality improves. The more telling reading is computers, peripherals, and smart home assistants: down just 0.8% over the past year, a remarkably shallow decline for a category that routinely deflates at several times that pace, and one that posted outright increases in April and May before dipping in June. Video and audio products are up 1.9% over the year, an unusual positive print for consumer electronics.
This is the overlooked story in the June report. The memory shock is arriving the way hedonically adjusted indexes usually receive a cost shock: not as a price spike, but as the disappearance of the deflation that consumers have come to treat as automatic. If memory costs remain elevated into the fall, the tech aisle could flip from a steady drag on core goods prices to a modest contributor, at precisely the moment tariff pass-through is fading elsewhere in the goods basket. We will keep this watch item in place.
Real Earnings: A Paycheck Reprieve
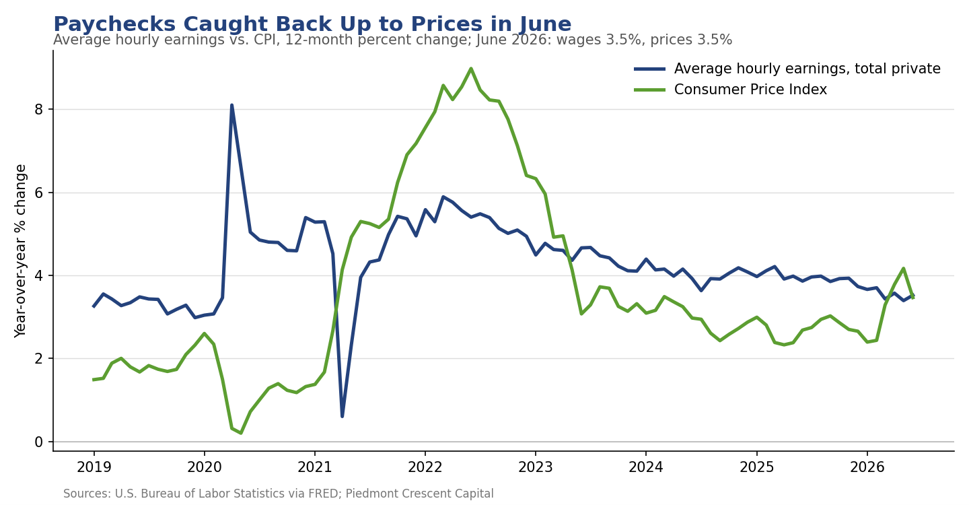
The companion release delivered the month’s best news for households. Real average hourly earnings jumped 0.8% in June, a 0.3% nominal wage gain compounded by the 0.4% decline in consumer prices, and turned positive over the year, up 0.1%, after running negative through the spring. Real weekly earnings rose 0.8% on the month and are up 0.3% over the year. For production and nonsupervisory workers, real hourly pay also rose 0.8% in June, though it remains down 0.1% over twelve months.
One good month does not repair a year of erosion, and the level of prices (the grocery bill, the insurance premium, the rent) still sits well above where paychecks left off. But the direction matters. The squeeze we have tracked all year loosened in June for the first time in a meaningful way, and if energy stays quiet, the arithmetic favors the worker for the balance of the summer.
What Households Expect
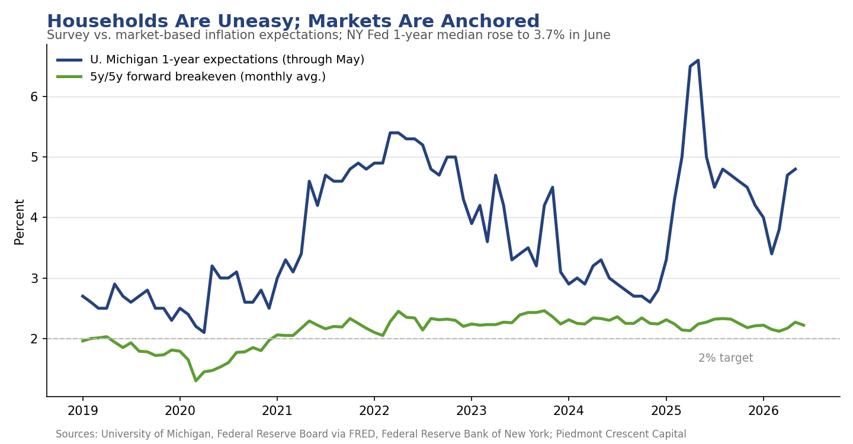
Households have not yet felt the relief. The New York Fed’s June Survey of Consumer Expectations, taken before the full extent of the gasoline decline registered at the pump, showed the median one-year inflation expectation rising two tenths to 3.7%, the highest since September 2023, and the three-year measure climbing to 3.3%, the highest since June 2022. The five-year expectation held at 3.0%. The texture beneath tells the same two-sided story as the hard data: households marked their gasoline price expectations down sharply, to 1.5%, the lowest since August 2022, even as they braced for rent to rise 8.3% and medical care 9.4% over the year ahead.
Households expect rents to rise more than 8%; the CPI says rents actually rose 2.8% over the past year and are decelerating. The gap between what renters fear and what the lease data show is one of the widest on record, and it is a useful reminder that expectations follow lived experience with a long lag. Labor market expectations, at least, improved across the board in June.
Our Call
A negative print is a partial energy refund, not the onset of deflation. June’s 0.4% decline unwinds a piece of the spring surge, and the drop in the 12-month change to 3.5% flatters the trend for the same reason April’s 4.2% maligned it. The signal sits in the middle. Our HP-filtered trend puts underlying core inflation just above 2.5%, the Dallas trimmed mean sits at 2.4%, and the Cleveland measures near 2.9%. Underlying inflation is in the mid-twos and grinding lower, which marks genuine progress, but not mission accomplished.
The composition finally favors the household. The most regressive inflation of the spring reversed first, real earnings turned positive over the year, shelter posted its smallest increase in five years, and motor vehicle insurance is now falling outright. The two-Americas framing we have carried all year is still intact (the price level remains a burden), but June was the first month in some time in which the wage earner, not just the asset holder, came out ahead.
For the Warsh Fed, June buys patience, not a pivot. The report removes the hike tail that the spring spike had put back on the table, but with the New York Fed’s one-year expectation at 3.7% and the three-year at a four-year high, the Committee cannot yet claim expectations are anchored at target. One negative energy print does not make a trend, and the second-round watch (airfares, transport, and technology products) stays open. We hold our no-cut base case for 2026, with the risks around it now roughly balanced rather than skewed toward a hike.
Mark P. Vitner – Chief Economist, Piedmont Crescent Capital
mark.vitner@piedmontcrescentcapital.com · (704) 458-4000
Disclaimer: This report is provided for informational purposes only and does not constitute investment, legal, tax, or accounting advice, nor an offer or solicitation to buy or sell any security. Information is drawn from sources believed to be reliable, including the U.S. Bureau of Labor Statistics and the Federal Reserve Banks of Cleveland, Dallas, and New York, but its accuracy and completeness are not guaranteed. Views expressed are those of the author as of the date of publication and are subject to change without notice. Past performance is not indicative of future results.