
Fewer Jobs, Fewer Workers
A soft June payroll print met a shrinking labor force. Beneath the surface, we see a broadening economic expansion, with less overall slack than the headline suggests.
Early Signal
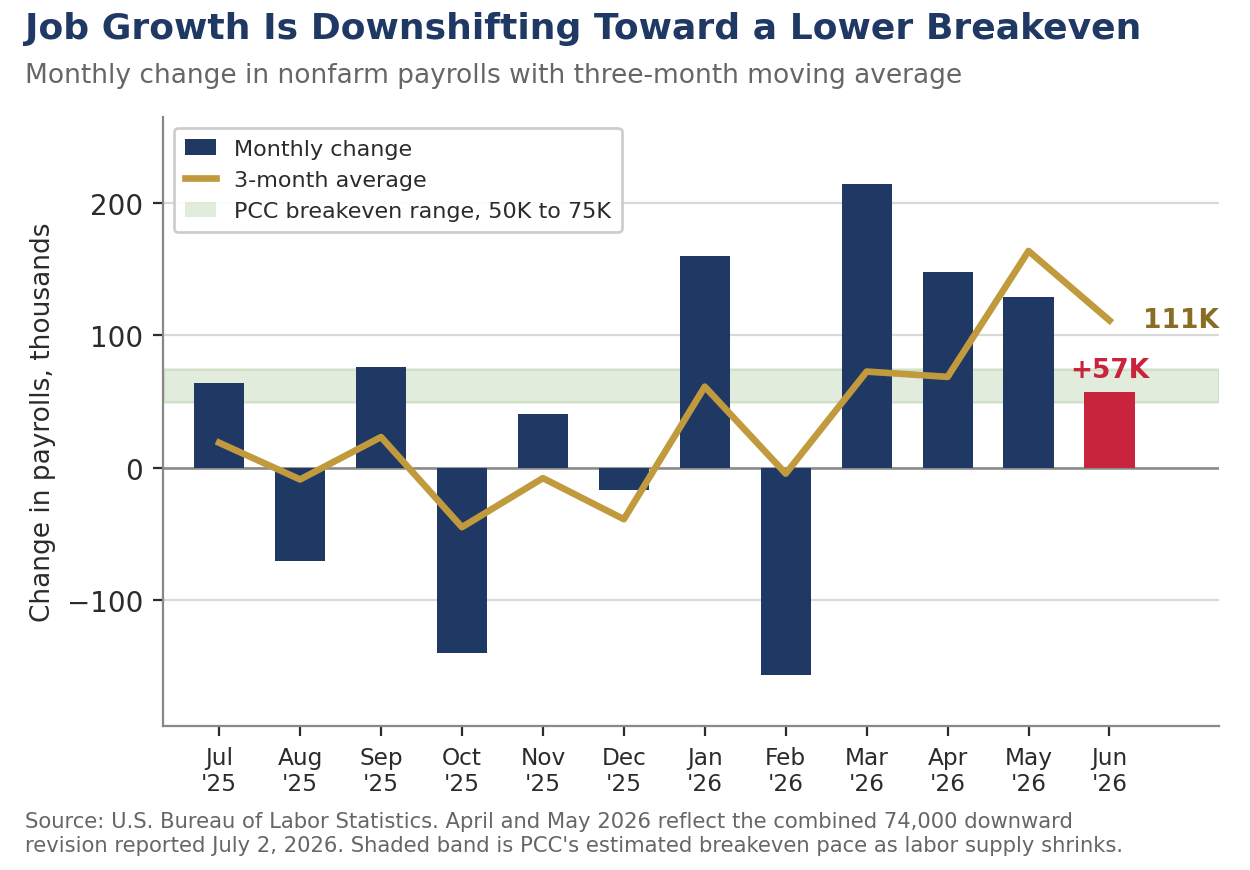
- June payrolls rose just 57,000, roughly half the consensus call of around 113,000, and April and May were revised down a combined 74,000 (to 148,000 and 129,000), unwinding much of the spring's upside surprises.
- The unemployment rate fell to 4.2%, but for reasons that give little comfort. Household employment fell 507,000 and the labor force shrank by 720,000, pulling the participation rate down 0.3 percentage point to 61.5%.
- The participation drop was concentrated among workers aged 25 to 34, whose participation rate fell 1.6 percentage points, the largest one-month decline outside the pandemic. Slower immigration and stepped-up enforcement appear to be shrinking labor supply.
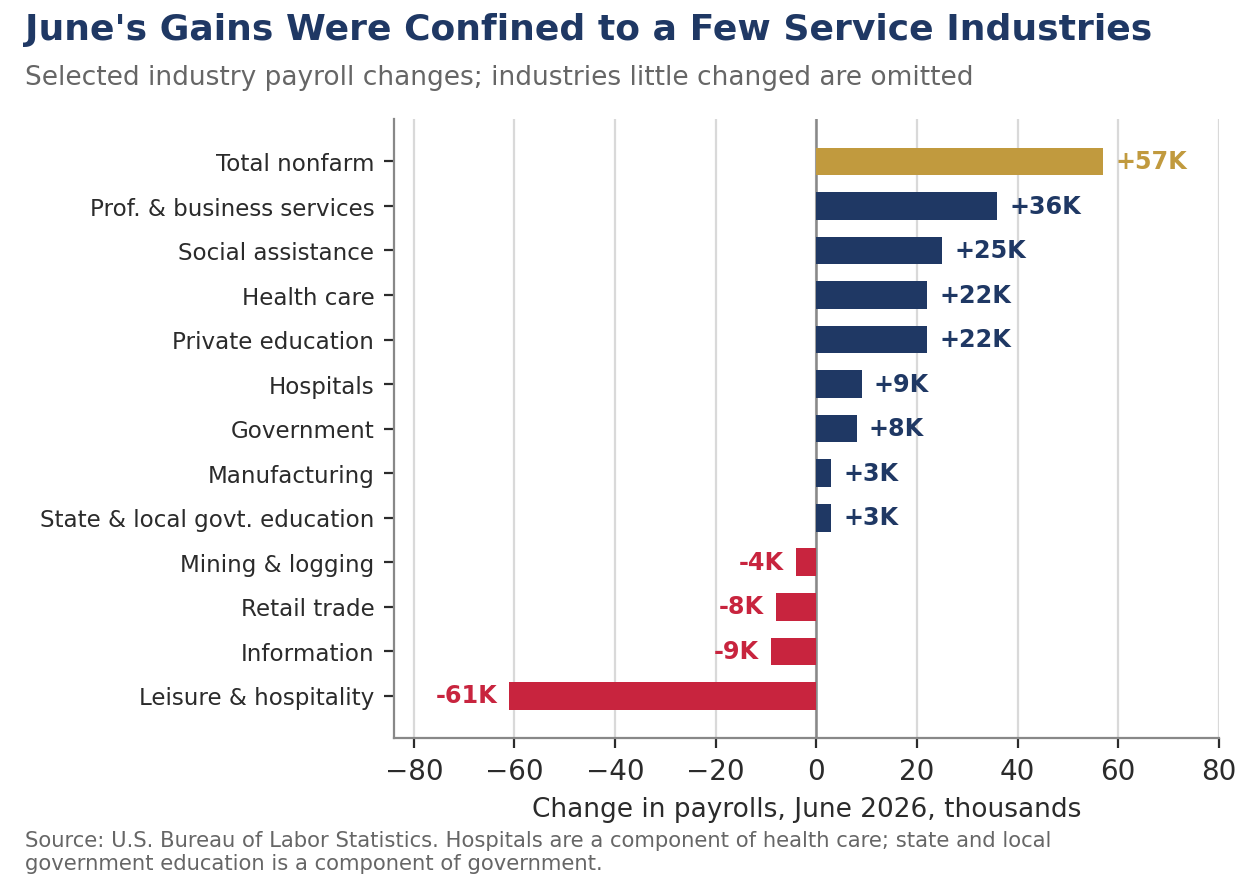
- Leisure and hospitality shed 61,000 jobs, more than reversing May's gain. As we noted last month, the early Memorial Day likely pulled summer hiring into May, so June's decline owes more to the calendar than to any genuine crack in consumer spending or hiring.
- The World Cup is likely boosting payrolls by more than the data show. The tournament kicked off the day before the survey reference week began, and much of the lift is coming through longer hours and busier afternoons at bars and restaurants across the country, not just in the host cities.
- Manufacturing breadth is quietly improving. The factory diffusion index rose 2.8 points to 55.6, the highest reading in more than a year, and manufacturing payrolls added 3,000 jobs, consistent with an ISM survey that has held above 50 all year.
- Wage growth firmed rather than faded. Average hourly earnings rose 0.3% in June and are up 3.5% over the past year, while the workweek held at 34.3 hours.
A Soft Print, With Asterisks
The June employment report was the softest of the year, but it arrives with more than the usual number of asterisks. Nonfarm payrolls rose 57,000, well short of expectations. Private payrolls accounted for just 49,000 of the gain, while government added 8,000 following an outsized May increase that was revised lower. We feel the best way to look at this number is to take the three-month average of job growth, which slipped to 111,000. The downward revisions to April and May sting a bit more than the June miss itself. Last month we noted that the persistent downward-revision pattern of late 2025 had finally reversed. That reprieve lasted exactly one report. April was marked down 31,000 and May 43,000, and the spring hiring surge now looks more modest than it did a month ago. Even after the revisions, job growth is strong enough to keep the unemployment rate in check. The jobless rate actually fell just over 0.1 percentage point in June to 4.2%.
Job growth narrowed in June, though it did not collapse. The one-month diffusion index slipped 1.6 points to 54.4, and the three-month measure eased to 56.2. A majority of industries are still adding workers, but the broadening we highlighted in the May report lost a step. The gains that did materialize came from familiar places. Professional and business services added 36,000 jobs and has now added 172,000 since its October low, a genuine bright spot that suggests firms are rebuilding white-collar capacity and suggests that fears of AI hollowing out white-collar employment are, at least so far, overblown. More and more firms are finding they need more workers to get more out of AI. Social assistance added 25,000 and health care 22,000, though the latter is running well below its 38,000 average monthly pace over the past year. Private education added 22,000, a gain we read as a seasonal-adjustment artifact rather than genuine hiring. On the other side of the ledger, information, retail trade, and mining all shed jobs, and state and local government education added just 3,000, breaking a pattern of strong first prints in June that had held for several years. The earlier than usual Memorial Day likely distorted the payroll figures in a number of these categories, which we will detail later.
Payback at the Pool Bar, and a World Cup Wild Card
Leisure and hospitality's 61,000-job decline looks alarming until the calendar is fully considered. Memorial Day fell on May 25 this year, one of the earliest possible dates, and pulled a slug of seasonal hiring at pools, resorts, restaurants, and amusement venues forward into the May survey week. We flagged the timing effect last month, when it flattered the May figures, and June's drop is simply the other side of the same trade. The seasonal factors anticipate even larger hiring gains in June than in May, so the two months together likely do not fully net out. This is an issue we are likely to deal with all the way into the fall. Labor Day comes unusually late this year, falling on September 7, which means summer hires will likely remain on payrolls longer than usual.
The impact of the early Memorial Day extends well beyond the leisure and hospitality sector. Private education payrolls added a surprising 22,000 jobs in June. The gain is a statistical artifact, however. On a non-seasonally adjusted basis, employment in private education fell by 181,400 jobs. The reason employment rose on a seasonally adjusted basis is that employment fell more than usual in May, as the school year ended earlier than usual for many schools, resulting in a smaller than usual June dropoff.
Hiring at home improvement centers and hardware stores, another highly seasonal business, was also a casualty of the calendar. Hiring rose strongly on a non-seasonally adjusted basis in May, resulting in less hiring than usual in June, producing a seasonally adjusted loss of 11,900 jobs this past month. There are undoubtedly more distortions than these, but they are among the most visible.
The World Cup is the wild card the seasonal factors cannot see. The tournament opened across the United States, Mexico, and Canada on June 11, one day before the establishment survey's reference period began, which means much of the staffing tied to the event either came too late in the month to be counted or simply was not reported yet. The bigger point is that the boost is not confined to the eleven U.S. host cities. With matches airing through the afternoon, sports bars and restaurants all across the country are drawing crowds in parts of the day that are normally quiet, and much of that lift shows up first in longer hours, added shifts, and busier tip jars rather than in new positions. Some of it will surface as hiring in the July report, which will make an already noisy month noisier still, and some of it will show up in revised data for May and June. Our read is that the true pace of leisure and hospitality activity in June was meaningfully firmer than the payroll figures suggest, but maybe we are just paying more attention to the matches ourselves.
Unemployment Fell for the Wrong Reasons
The drop in the unemployment rate to 4.2% is the least reassuring decline we have seen in some time. Household employment fell 507,000 in June, and the labor force contracted by 720,000, dragging the participation rate down to 61.5% and the employment-population ratio down to 59.0%. Nearly all of the labor force decline came from workers aged 25 to 34, whose participation rate plunged 1.6 percentage points, the largest one-month drop outside the pandemic in the history of the series. The decline was evident among both men and women in the cohort. A move that large among prime-age workers is hard to square with retirements or schooling. It is much easier to square with sharply slower immigration and stepped-up enforcement pulling foreign-born workers out of the measured labor force. The calendar may also be a factor, with more younger workers joining the workforce in May and fewer than usual joining in June, leading to a seasonally adjusted drop.
We want to be careful when discussing younger workers. This group has become a focal point of the political debate recently, with concern about job prospects and affordability featuring prominently in the policy conversation. The unemployment rate for those ages 25 to 34 fell 0.1 percentage point to 4.6% in June. The jobless rate for this age cohort is the highest within prime working age adults. The rate for men is slightly higher, at 4.8%, while the rate for women is 4.3%. By comparison the unemployment rate for those ages 35 to 44 is currently 3.3% and the unemployment rate for those 45 to 54 is 3.1%. Elevated joblessness among younger workers is the signature of a low-hire economy, where entry-level hiring has slowed the most, and it helps explain why more of them are leaving the labor force.
The low-hire, low-fire labor market remains firmly in place, but the low-hire side is starting to leave marks. Initial jobless claims held at 215,000 in late June and continuing claims near 1.8 million, so layoffs remain scarce. The number of permanent job losers dipped in June, and the Sahm rule remains comfortably below its recession threshold on both the unemployment rate and prime-age employment measures. Yet the number of long-term unemployed has climbed 286,000 over the past year to 1.9 million and now accounts for 27.3% of all unemployed workers. Those who lose a job are staying out of work longer, even as the chances of losing one remain low. That combination is the household-survey signature of the same story the establishment data tell: businesses are meeting demand with capital and productivity rather than headcount.
A shrinking labor force also resets the bar for what counts as a weak report. If labor supply is barely growing, monthly payroll gains in the 50,000 to 75,000 range are enough to hold the unemployment rate steady. June's 57,000, which would have signaled stall speed two years ago, now sits close to that breakeven pace, and the falling unemployment rate says as much. The economy is not generating fewer jobs than it needs. It is generating fewer workers.
Wages, Hours and the Fed
For the Fed, June's report offers something for everyone and a clear case for no one. Doves will point to the weakest payroll print of the year and a diffusion index that narrowed slightly. Hawks will point to an unemployment rate that fell to 4.2%, average hourly earnings that rose 0.3% on the month and firmed to 3.5% over the year, and a labor supply that is contracting. Wage gains were strongest in information, utilities, and finance, precisely the industries at the center of the capital-led expansion. The average workweek held at 34.3 hours, and factory overtime edged up even as the manufacturing workweek slipped, leaving aggregate hours little changed. Total hours worked edged up just 0.1% for the month. For the quarter, aggregate hours worked climbed at a 1.3% annual rate. After adding in 2% productivity growth, that would be consistent with 3% plus GDP growth. Real earnings are also turning a corner. Paychecks trailed inflation over the three months through May as war-driven energy costs outran wage gains, but with energy prices falling, that arithmetic likely flipped back in workers' favor in June.
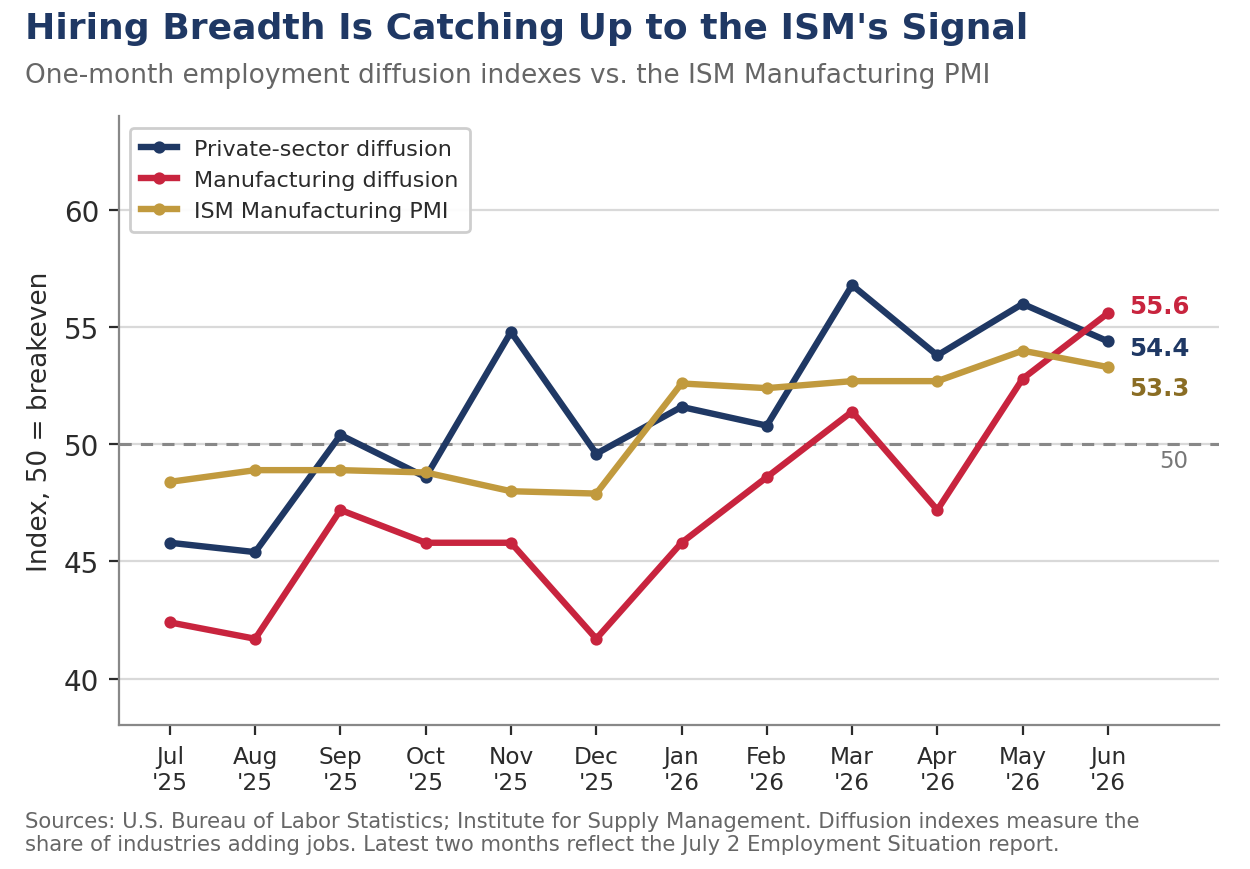
Our read is more upbeat still. Forecasters are already drifting our way, with some shops that until recently penciled in a 2026 cut now dating the next move deep into 2027. We see job growth as broadening and feel the slight drop in the diffusion index is mostly seasonal noise. The diffusion index in the factory sector actually improved in June, rising 2.8 points to 55.6, the highest reading in more than a year. That reading is consistent with what we have been seeing in the ISM report, which has remained above the key 50 breakeven level all year. Manufacturing payrolls also edged higher in June, adding 3,000 jobs. We believe overall hiring during the prior three months was likely overstated and expect payroll growth to average around 90,000 jobs a month during the third quarter and see the pace strengthening later this year. Manufacturing provides much of the cyclical momentum for the economy and the factory sector looks to be on the upswing right now, with rising orders, lean inventories and improving productivity setting the stage for stronger job gains. That improvement will quickly spill over into the broader economy.
A Weak Print That Argues for Patience, Not Cuts
Bond yields fell within minutes of the release as futures markets moved to price a fall rate cut. We would not chase that move. A labor market where hiring has slowed to roughly its breakeven pace, the unemployment rate is falling, and wage growth is firming toward 3.5% is not one crying out for easier policy, particularly with underlying inflation still running near 2.9%. We continue to look for no cut in 2026 and still believe the next move is more likely to be a hike than a cut, arriving in 2027 or 2028 if growth presses the economy back toward full employment. The July report, with World Cup hiring and the Memorial Day payback both in the mix, will be unusually noisy. The signal worth watching is labor supply. If participation among 25-to-34-year-olds does not bounce back, breakeven job growth is lower than the Street believes, and so is the unemployment rate consistent with stable inflation.
Chief Economist, Piedmont Crescent Capital
mark.vitner@piedmontcrescentcapital.com
Sources: U.S. Bureau of Labor Statistics, The Employment Situation, June 2026; U.S. Department of Labor, Unemployment Insurance Weekly Claims; Oxford Economics.
This report is for informational purposes only and does not constitute investment advice. Views expressed are those of Piedmont Crescent Capital as of the date of publication and are subject to change without notice.