Firming up Chair Warsh’s definition of the Fed’s 2 percent target
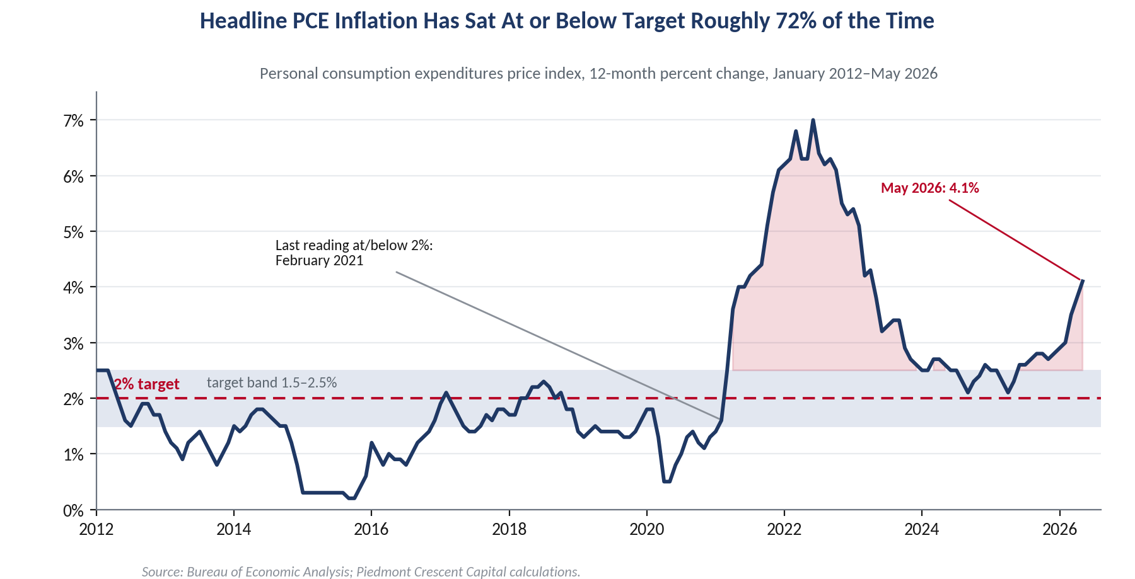
The Federal Reserve adopted its explicit 2 percent inflation goal in January 2012, which means the target turns fourteen this year. With the headline PCE deflator climbing to 4.1 percent in May, reported this morning, on the back of the energy shock now working through the system, it is worth stepping back from the monthly noise to ask a longer question. Since the goal was set, how often has inflation actually been where the Fed wants it?
The objective was written into the Committee’s Statement on Longer-Run Goals and Monetary Policy Strategy, adopted effective January 24, 2012 and reaffirmed every January since. It is defined on the headline PCE price index, measured as a twelve-month change, and in 2016 it was clarified as a symmetric goal rather than a ceiling. That symmetry matters for the scorecard, because it means undershooting the mark counts as a miss in the same way overshooting does.
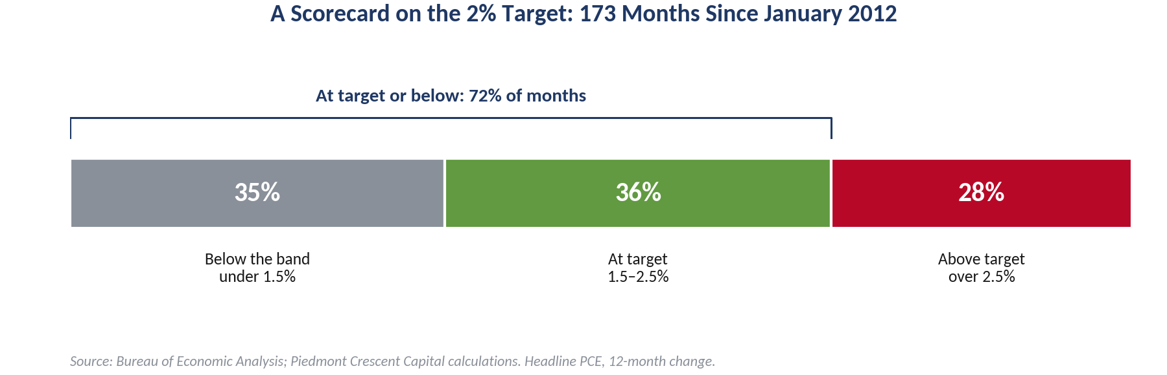
We took the 173 monthly readings from January 2012 through May and sorted them into three bins: at target, which we define as within half a point on either side of the goal, or 1.5 to 2.5 percent; below that band; and above it. The result runs against the prevailing mood. Inflation has sat at target or below it roughly 72 percent of the time, and above the upper edge of the band only about 28 percent of the time.
There is a definitional question lurking inside that figure, and Chair Warsh framed it well when he said he likes to focus on the left side of the decimal point. Some read that pessimistically, and perhaps deliberately so, as meaning that anything with a two in front of it counts as success, which would wave a 2.9 percent print through as on target. We read it as the number that rounds to two, which is both the sensible standard and the one behind our band. A reading of 1.8 percent rounds to two and clears the bar, as does 2.3 percent, while a reading of 2.99 percent rounds to three and plainly does not.
Splitting the at-or-below group is where the picture gets interesting. Time spent squarely in the band, at about 36 percent of months, is almost exactly matched by time spent below it, at about 35 percent. For most of the last decade the Fed was not fighting inflation at all. It was coaxing it up toward a target it kept missing on the low side. That persistent undershoot is the reason the Committee rewrote its framework in 2020 to allow inflation to run moderately hot for a time, and it is worth remembering now that the lived experience of the 2010s was disinflation, not the reverse.
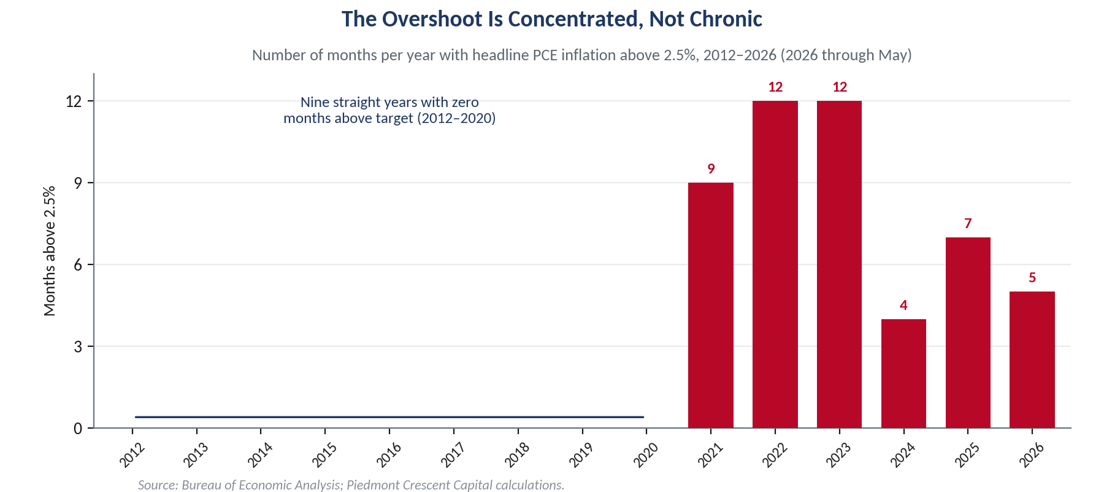
The overshoot, when it finally came, was violent but concentrated. From the target’s adoption through February 2021, a span of nine years, not a single month printed above 2.5 percent. Every above-target reading in the record sits inside two episodes, the 2021 to 2023 surge and the reacceleration underway this year. The 2024 and 2025 readings spent much of their time pressed against the top of the band, neither cleanly inside it nor far above it, which is the uncomfortable middle ground the Committee has been navigating.
A Filter, Not a Trim
There is a definitional cousin to the trimmed mean worth setting beside it. The trimmed-mean family answers one question. Strip the most extreme price moves in a given month, weight what remains, and read the center. The Cleveland Fed does this for the CPI with its median and trimmed measures, and the Dallas Fed does it for the PCE with its trimmed mean. We lean on these gauges because they are honest about what a headline print hides, which is that a handful of categories can carry an entire month in either direction.
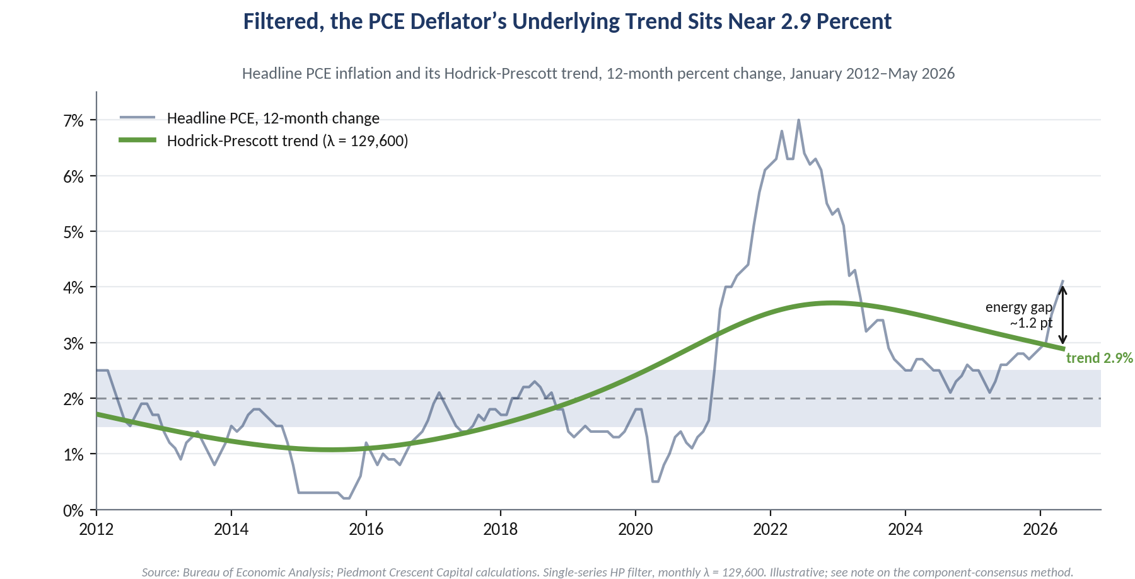
We reach a similar place by a different road. Rather than trim the cross-section of one month’s price changes, we filter the time path of each component, pull out its underlying trend with a Hodrick-Prescott filter, and take the cross-sectional median of those trends. The trim discards the outliers in space, across categories within a single month. The filter discards them in time, the month-to-month noise within each category. Taking the median across the filtered trends keeps the center and drops the tails, which is what the trim does to the cross-section, so the two are cousins. When they agree, we have more confidence that we are looking at signal rather than noise.
Run on the headline deflator alone, the filter puts the underlying trend near 2.9 percent, with May’s 4.1 percent reading sitting about 1.2 points above it. That gap is an energy price spike from the supply disruption abroad resting on a firm underlying rate, the mark of a supply shock rather than a broadening of price pressure, and it is the clearest picture of why the headline can cool in the second half without the Committee gaining anything that would justify a cut. Softer energy pulls the headline back down toward the trend. It does not pull the trend down to two. The filtered trend has come well off its 2022 peak near 3.7 percent, but at roughly 2.9 percent it sits closer to three than to two.
We would not lean on that single-series read for a turning-point call. A filter run on one aggregate is fragile at the endpoint, where it has no future data to anchor it, and it can mistake a real reacceleration for noise for months before the trend catches up. That is the weakness the consensus version is built to handle. Running the filter across dozens of components and taking the median averages out the idiosyncratic endpoint errors and, more to the point, lets us see breadth. When most components turn up together rather than one or two doing the work, the firming is real. That breadth is what the comparable CPI consensus showed this spring, and it is what we will be watching the PCE components to confirm.
We would not read that 72 percent, the share of months inflation has spent at or below the top of the target band, as cause for comfort. The composition of the misses has changed in kind, not just in degree. The last episode was a demand shock and a supply shock layered together. The current one is an energy-led impulse from the conflict abroad, arriving while the underlying economy is running into full employment rather than slack. That is the configuration we have flagged before: growth pressing against capacity, capital spending leading the expansion, and an inflation impulse that is harder to dismiss as transitory because it is not landing on a weak labor market. Our filter and the trimmed-mean gauges point the same way, with the underlying rate firm and a touch above the mark rather than back at it, and we continue to think the path of least resistance for the Committee this year is to hold rather than to cut.
This Morning’s Print
This morning’s release put hard numbers on that picture. The headline PCE price index rose 0.4 percent on the month and 4.1 percent over the year in May, up from 3.8 percent in April and a tenth above what the consensus expected. Core, which strips out food and energy, rose 0.3 percent on the month and firmed to 3.4 percent over the year, its highest reading since late 2023. The spending side held up, with personal income and nominal consumer spending each up 0.7 percent, real spending up 0.3 percent once prices are stripped out, and the saving rate edging up to 3.0 percent, though the income gain leaned on a round of farm and disaster-relief payments as much as on wages. Energy did the heavy lifting on the headline, the supply-shock signature we described, while the firmer core says the underlying pace is still drifting the wrong way rather than settling back.
Markets took it in stride, and the reaction said as much about positioning as about prices. Treasuries barely moved, with the ten-year note holding near 4.4 percent, and equity futures were firmer on the morning, though that owed more to a blowout result from a large memory-chip maker than to anything in the inflation data. The relief was that the print was not worse, given how far energy had run. Underneath the calm, the policy story kept moving in one direction. Futures now put the odds of a rate hike by September near two-thirds, up from less than a third a week ago, and not a single meeting this year is priced for a cut. What markets are leaning on is that crude has round-tripped much of its war premium this month as tanker traffic through Hormuz normalized, which means the energy spike that drove the May headline is already reversing in real time. That is consistent with our read. The headline should cool as energy fades, the core will be slower to follow, and neither development hands the Committee a reason to cut.
Fourteen years in, the record reads less like a story of chronic overshoot and more like a target missed in both directions, low for a decade and high for a stretch, with relatively few months spent exactly on the mark. For an investor, the lesson is in the duration of the misses rather than their direction. They have tended to run in long regimes rather than quick reversions, and that argues for respecting the current impulse rather than fading it.
Chief Economist, Piedmont Crescent Capital
704-458-4000 · mark.vitner@piedmontcrescentcapital.com
The Piedmont Perspective is published by Piedmont Crescent Capital for informational purposes only and does not constitute investment, legal, or tax advice. Inflation buckets are computed from the headline PCE price index, 12-month change, seasonally adjusted, and are subject to revision by the Bureau of Economic Analysis.