
March Housing Starts Surge as Builders Make Up for a Brutal February; Permits Tell a Softer Story
Single-family construction surged to a 13-month high as builders made up for ground lost during a brutal February. The bigger story is in permits, where the trend is unmistakably softer.
| Indicator (SAAR, 000s) | March 2026 | February 2026 | Change |
|---|---|---|---|
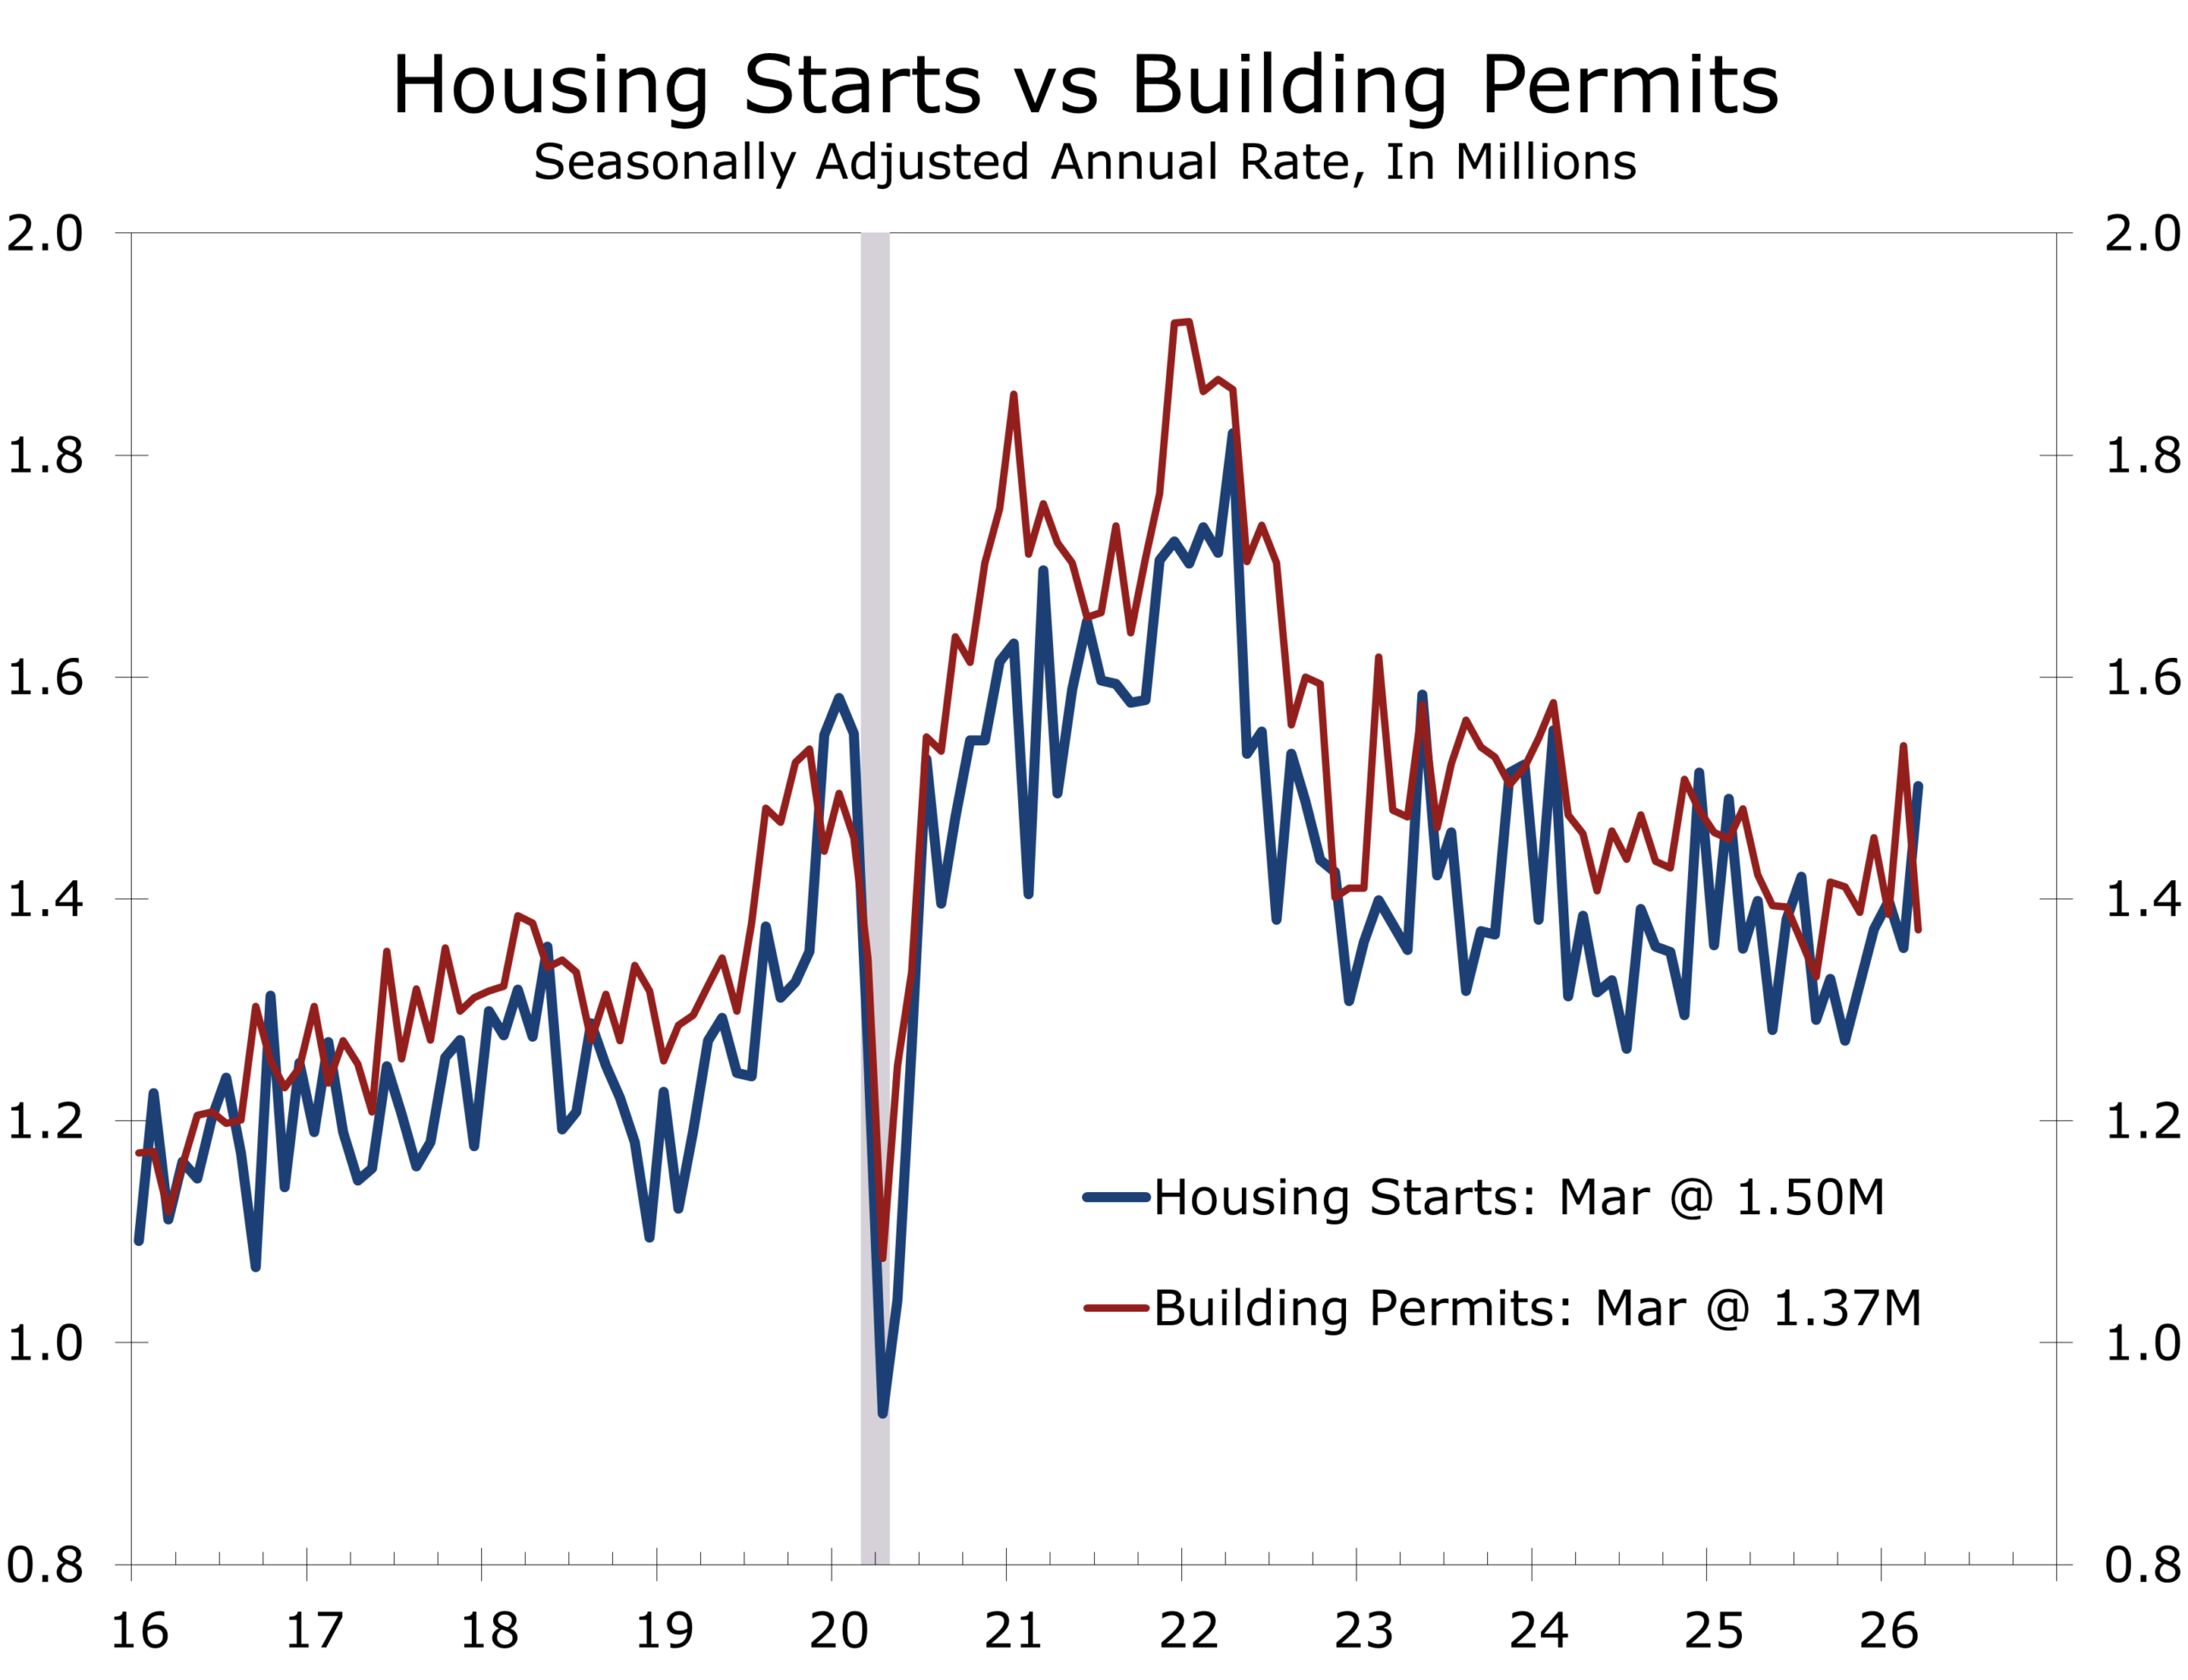
| Total Housing Starts | 1,502 | 1,356 | +10.8% |
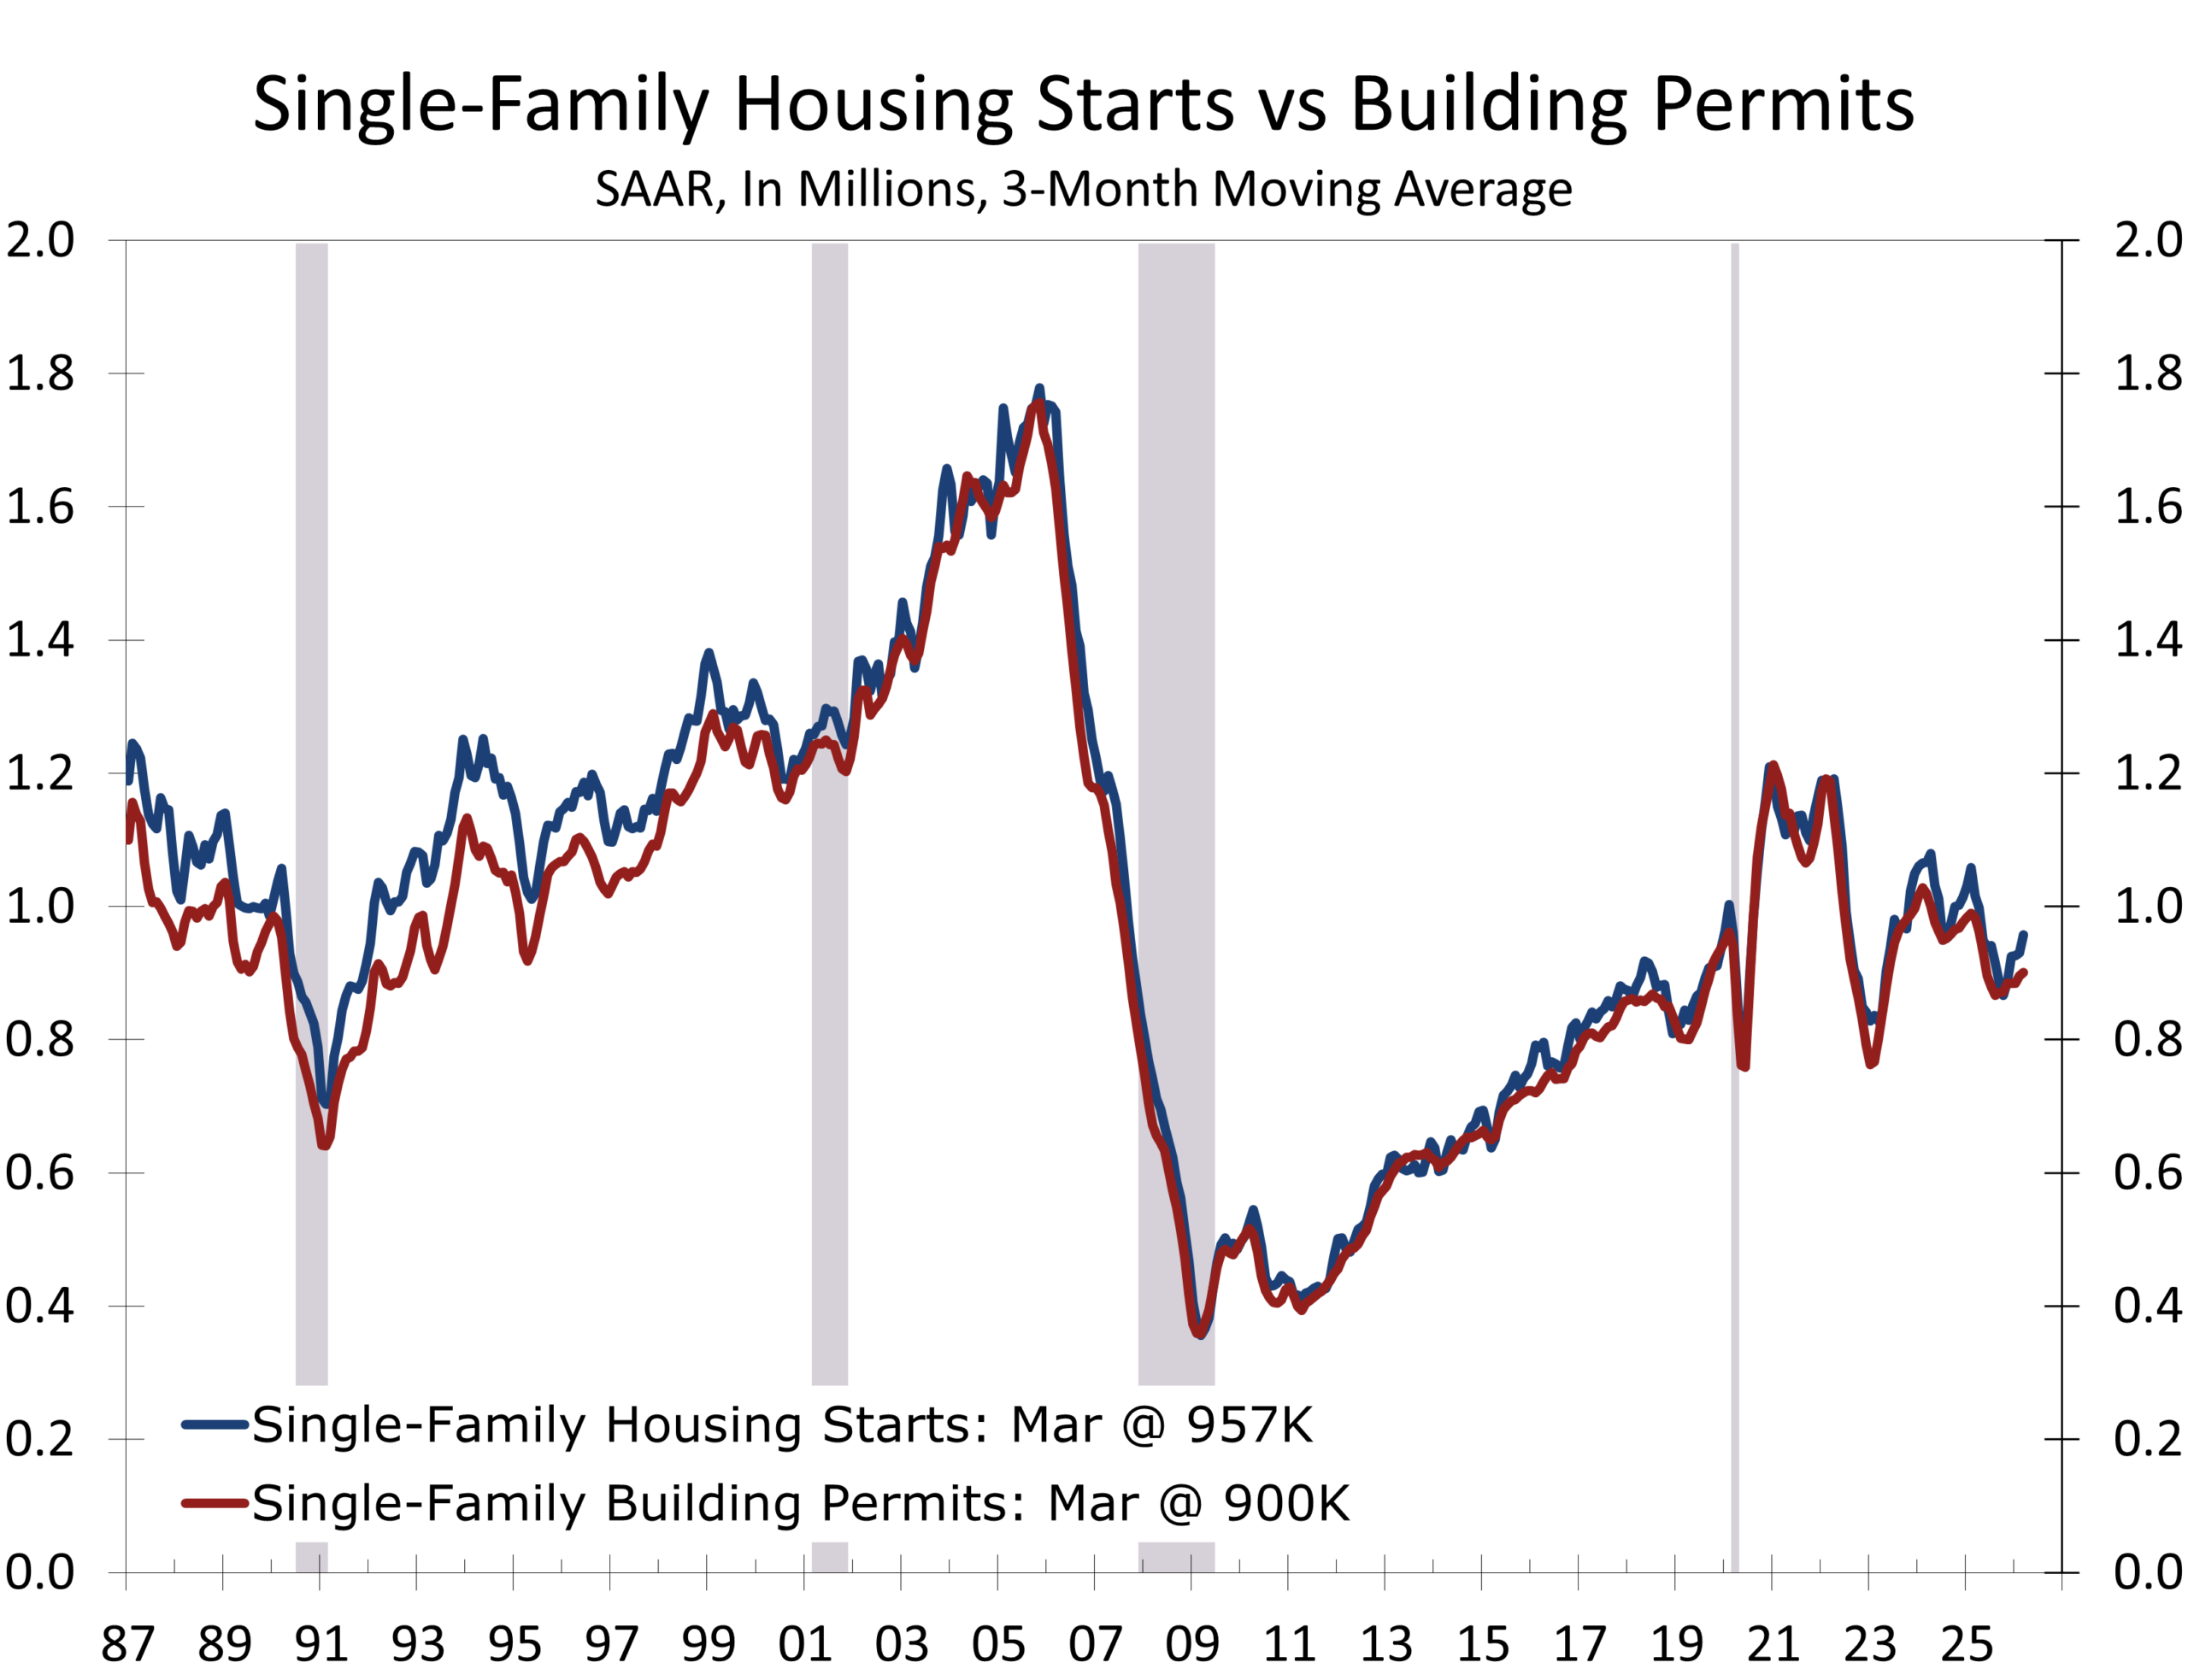
| Single-Family Starts | 1,032 | 941 | +9.7% |
| Multi-Family Starts (5+) | 446 | 407 | +9.6% |
| Total Building Permits | 1,372 | 1,538 | −10.8% |
| Single-Family Permits | 895 | 930 | −3.8% |
| Multi-Family Permits (5+) | 427 | 544 | −21.5% |
| Total Completions | 1,366 | 1,364 | +0.1% |
Headline Print
Privately-owned housing starts climbed 10.8% to a seasonally adjusted annual rate of 1.502 million in March, the strongest reading in fifteen months and well above the 1.40 million consensus. The Census Bureau released February data with this report, originally scheduled for March 17 but delayed alongside the March release as part of the Bureau’s adjusted indicator calendar following the recent lapse in federal funding. February starts came in at 1.356 million, with January revised down to 1.398 million from 1.487 million originally reported.
Single-family starts surged 9.7% to 1.032 million, the highest pace since February 2025. Multi-family starts in buildings with five or more units rose 9.6% to 446,000. The advance was broad-based regionally — the Northeast jumped 24.8%, the Midwest rose 12.2%, the South — which is by far the largest region — advanced 9.1%, and the West gained 7.2%.
The headline gain is real, but most of it reflects payback from a weather-impaired February. The polar-vortex collapse in mid-February, the late-month Northeast blizzard that dropped one to three feet of snow from Philadelphia to Boston, and a string of cold-air outbreaks that pushed snow as far south as the Carolinas, Texas, and Florida sidelined construction across much of the country. By contrast, March brought near-ideal building conditions across most of the South and Mountain West, regions that account for well more than half of national single-family activity. The pattern of the rebound, with the strongest gains in the regions hit hardest in February, is the giveaway.
The cleaner way to read the underlying pace is to look through the weather noise. Combined Q1 starts averaged 1.42 million SAAR, above the 1.35 million we had been tracking but only modestly so. For the Q1 GDP residential investment line specifically, the level of homes already under construction during the quarter matters more than the rate at which new units broke ground in March, since the bulk of construction spending occurs three to five months after groundbreaking. The starts surge therefore matters more for Q2 and Q3 spending than for Q1. With units under construction at 1.264 million — gradually drifting lower — Q1 residential investment is on track to decline at roughly a 0.5% annualized pace, in line with our prior forecast. The Q1 starts average lends only modest upside risk to that estimate.
March’s strong starts print is a payback from a weather-disrupted February — not a turning point in the housing cycle.
Builder Sentiment: A Step Lower
The April NAHB/Wells Fargo Housing Market Index fell four points to 34; the lowest reading since September 2025 and a meaningful step down from the early-2026 hopes that the sector was stabilizing. All three sub-indices declined: current sales conditions fell to 37, future sales dropped seven points to 42, and prospective buyer traffic eased three points to 22.
Two factors are weighing on builders. First, the war with Iran has driven oil prices higher and pushed up the cost of nearly everything that arrives at a job site by truck. Sixty-two percent of builders reported their suppliers had raised material costs because of higher fuel prices, and energy inputs account for roughly 4% of residential construction costs. Seventy percent of builders said they were having trouble pricing homes given the uncertainty around materials. Second, mortgage rates, while off the post-war peak, remain elevated. The retracement has gotten about halfway back toward pre-war levels, but with inflation set to run higher for longer and the FOMC almost certainly on hold through mid-year, further declines are unlikely in the near term.
Builder concessions remain a defining feature of this cycle. Thirty-six percent of builders cut prices in April, with an average reduction of 5%, and 60% offered some form of sales incentive; the 13th consecutive month at or above that threshold. Affordability is being delivered through builder margin compression rather than through lower mortgage rates or lower asking prices, and that is not a model that scales easily as input costs rise.
Regional Picture: The Sunbelt Bent but Did Not Break
On a year-to-date basis, combined single- and multi-family starts are 36% higher in the Northeast, 7.8% higher in the Midwest, 3% higher in the South, and 15.5% lower in the West. The South’s modest YTD gain understates the underlying picture in much of the Carolinas, Georgia, Florida, Texas, and the broader Sunbelt, where continued strong in-migration and resilient job growth, particularly in Texas and the Carolinas, continue to support demand even as price reductions and incentives have become standard. The Midwest has been the only region to post positive year-over-year single-family starts growth on a sustained basis, a notable reversal of the past several years’ Sunbelt-led pattern.
On the permit side, the year-to-date data are softer: permits are up 15.4% in the Northeast (the smallest new home market) and 1.1% in the Midwest, but down 9.1% in the South and up only 6% in the West. The South’s permit weakness is the data point worth watching most closely. Inventories remain high throughout the region and Florida’s economy has slowed in a major way. The South accounts for roughly 55% of national single-family construction, and a sustained pullback in Southern permitting would mean more for the national pace than gains elsewhere can offset. We do not yet treat the Southern slowdown as a trend break, but it warrants close attention through the spring.
Inventory Dynamics and the Path Ahead
There are now 587,000 single-family units under construction and 677,000 multi-family units — a combined 1.264 million, which is 451,000 below the October 2022 peak but still modestly elevated compared with the 1.1 to 1.2 million range typical of the three years preceding the pandemic. Composition matters more than the level. Builders are now completing slightly more single-family homes than they are starting on a 12-month basis, gradually working down the inventory of unsold completed homes. On the multi-family side, completions have been running ahead of starts for several quarters, and that trend will persist into 2027.
For starts to improve on a sustained basis from here, builders need to continue working through their inventory of completed but unsold homes, and the affordability picture needs to improve. There are only a few ways to accomplish that: lower mortgage rates, slower price appreciation, faster wage growth, or some combination of the three. None of those is likely to deliver decisively this year. Mortgage rates appear range-bound while the Fed waits for inflation to cool. Builder margins have already absorbed about as much price reduction as the math supports. Wage growth is solid but no longer accelerating.
Implications
Q1 GDP tracking modestly higher. The stronger-than-expected March single-family starts, alongside the upward revision to February, lend slight upside risk to residential investment in the Q1 print. We continue to expect real residential investment to decline at roughly a 0.5% annualized pace, with the upside risk concentrated in inventory accumulation rather than the headline.
April starts will give some of March’s gain back. The permits read points to a pullback, and seasonal patterns suggest the South and Sunbelt’s March outperformance will normalize. We would not be surprised by a starts print in the 1.35 to 1.40 million range for April.
Multi-family deserves separate attention. Completions are running ahead of starts on a 12-month basis, the apartment pipeline is being drawn down, and the April permits reading was particularly weak. The apartment construction cycle has moved past its peak. New supply will continue to arrive through 2026, which will keep effective rents in check, but the supply tap will be much smaller in 2027 and 2028. That sets up favorable rent dynamics in apartment markets with steady demand, including across much of the Carolinas, Georgia, and Florida.
Bottom Line
March’s strong starts print is best understood as a snapback from a weather-impaired February that was amplified by seasonal adjustment rather than as a signal that the housing market has turned the corner. The three-month Q1 average of 1.42 million is a more honest read of the underlying pace, and that pace is consistent with residential investment subtracting modestly from Q1 GDP rather than contributing to it.
Permits, builder sentiment, and the affordability arithmetic all argue against extrapolating March’s strength into the spring. The April permits read suggests starts will pull back. We do not look for a sustained recovery in housing activity until either mortgage rates move materially lower or the inventory of completed unsold homes comes down further, and neither is likely to happen quickly. The cycle has not turned. The deterioration in starts has merely stabilized.