The BEA’s second look at third quarter real GDP growth revealed the economy grew at a slightly stronger pace, with real GDP climbing at a 2.9% annual rate. The increase follows two consecutive quarterly declines during the first half of the year and pushes back on some of the talk that a recession is imminent. Upward revisions to consumer spending and business investment offset a downward revision to inventory building. Imports were also revised lower.
Underlying Momentum Remains Soft
- Real GDP growth was revised up 0.3 pp to a 2.9% annual rate for the third quarter.
- Stronger growth during the third quarter now slightly offsets the declines during the two prior quarters, leaving real GDP 0.1% higher than it ended 2021.
- The headline number once again creates a misperception about the economy’s underlying momentum. Real final sales to private domestic purchasers, our preferred output measure, rose at just a 0.5% annual rate for the second quarter in a row.
- Gross Domestic Income was also surprisingly weak, rising at just a 0.3% annual rate after falling at an 0.8% pace in the prior quarter.
- Inflation rose slightly faster than first reported. The core PCE price index rose at a 4.6% annual rate, up from a previous 4.5%.
- Corporate profits declined by $31.6 billion in Q3, and profit margins narrowed to 11.6% of GDP, down from 12.1% a year ago.
Even taken at face value, the third quarter rebound in real GDP merely brings output a smidgen above where it began the year. Moreover, the underlying details still show the economy losing momentum, particularly in the more interest-rate sensitive sectors, such as housing and business fixed investment.

Consumer spending also remains under pressure, with higher prices for food, energy and housing causing consumers to cut back on discretionary spending. Spending on goods fell at a 0.2% annual rate, marking the third consecutive quarterly drop. The latest drop was led by declines in outlays for motor vehicles and food and beverages. The latter partly reflects an outlet bias, with consumers’ grocery purchases shifting toward less expensive food items at less expensive outlets, including wholesale clubs, discount stores and farmers markets. Overall consumer outlays rose at a 1.7% pace, with services accounting for the entire gain.
Housing was clearly the weak spot in Q3. Residential investment plummeted at a 26.8% annual rate, marking the steepest drop since the onset of the pandemic. Nearly all the drop has been in single-family home building and lower commissions on the sale of existing homes. Apartment construction is still going strong, although leasing has slowed, and vacancy rates are now trending higher.
Business fixed investment rose at a 5.1% annual rate during the third quarter, with increased spending on equipment and intellectual property offsetting a 6.9% SAAR drop in nonresidential structures. Most of that was in commercial construction. Oil and gas exploration increased during the quarter.
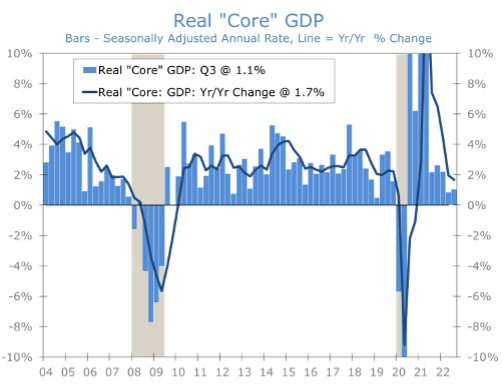
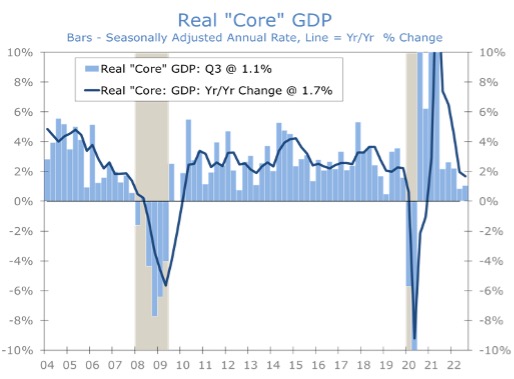
Taken together, consumer spending, housing and business fixed investment constitute what we like to call core GDP. This is the part of the economy that is most directly influenced by monetary policy. Core GDP has averaged just a 1% pace over the past two quarters and is now up 1.7% over the past year. That looks and awful lot like a soft landing. Unfortunately, conditions also look like they are getting even softer.
While growth will likely slow further, the economy is not yet on the cusp of recession. The revised GDP data suggest a recession is a little further out than previously thought. The fourth quarter should be solidly positive, with output expanding at around 1.5% annual rate. Consumer spending got off to a solid start in October and early reports suggest the holiday shopping season is off to a strong start.
Housing will clearly continue to lose momentum. While October’s new home sales came in higher than expected, the data omit cancelations, which have surged over the past three months. Pending home sales, which tend to lead existing home sales by 1-2 months, tumbled a further 4.6% in October. That drop combined with lower home prices, means broker commissions will fall ever further in Q4.
While housing appears set to be a drag on economic growth over the next few quarters, the economy should get a modest boost from inventory building. Inventory building during Q3 was revised lower, subtracting a full percentage point from economic growth. Farm inventories fell sharply again, while nonfarm inventories rose by $66.4 billion, down from $123.6 billion in the prior quarter. We suspect the slowdown in nonfarm inventories is due to container traffic being rerouted to the East Coast ahead of possible port disruptions and look for a rebound in Q4.
The revised GDP data suggest a recession is a little further out than previously thought.
The GDP report also provided the first look at corporate profits, which are proving unexpectedly resilient. While profits fell by $31.6 billion, all the drop was in the financial sector, with Federal Reserve Banks booking all the loss there. Nonfinancial profits edged 0.3% higher. Stronger profits should aid capital spending and reduce the need for job cuts.
Disclaimer: This publication has been prepared for informational purposes only and is not intended as a recommendation offer or solicitation with respect to the purchase or sale of any security or other financial product nor does it constitute investment advice.