Domestic Demand Growth Slows to 1.2% in Q2, Averages 1.55% in First Half
- Real GDP rose at a 3.0% annual rate in Q2, reversing Q1’s 0.5% contraction
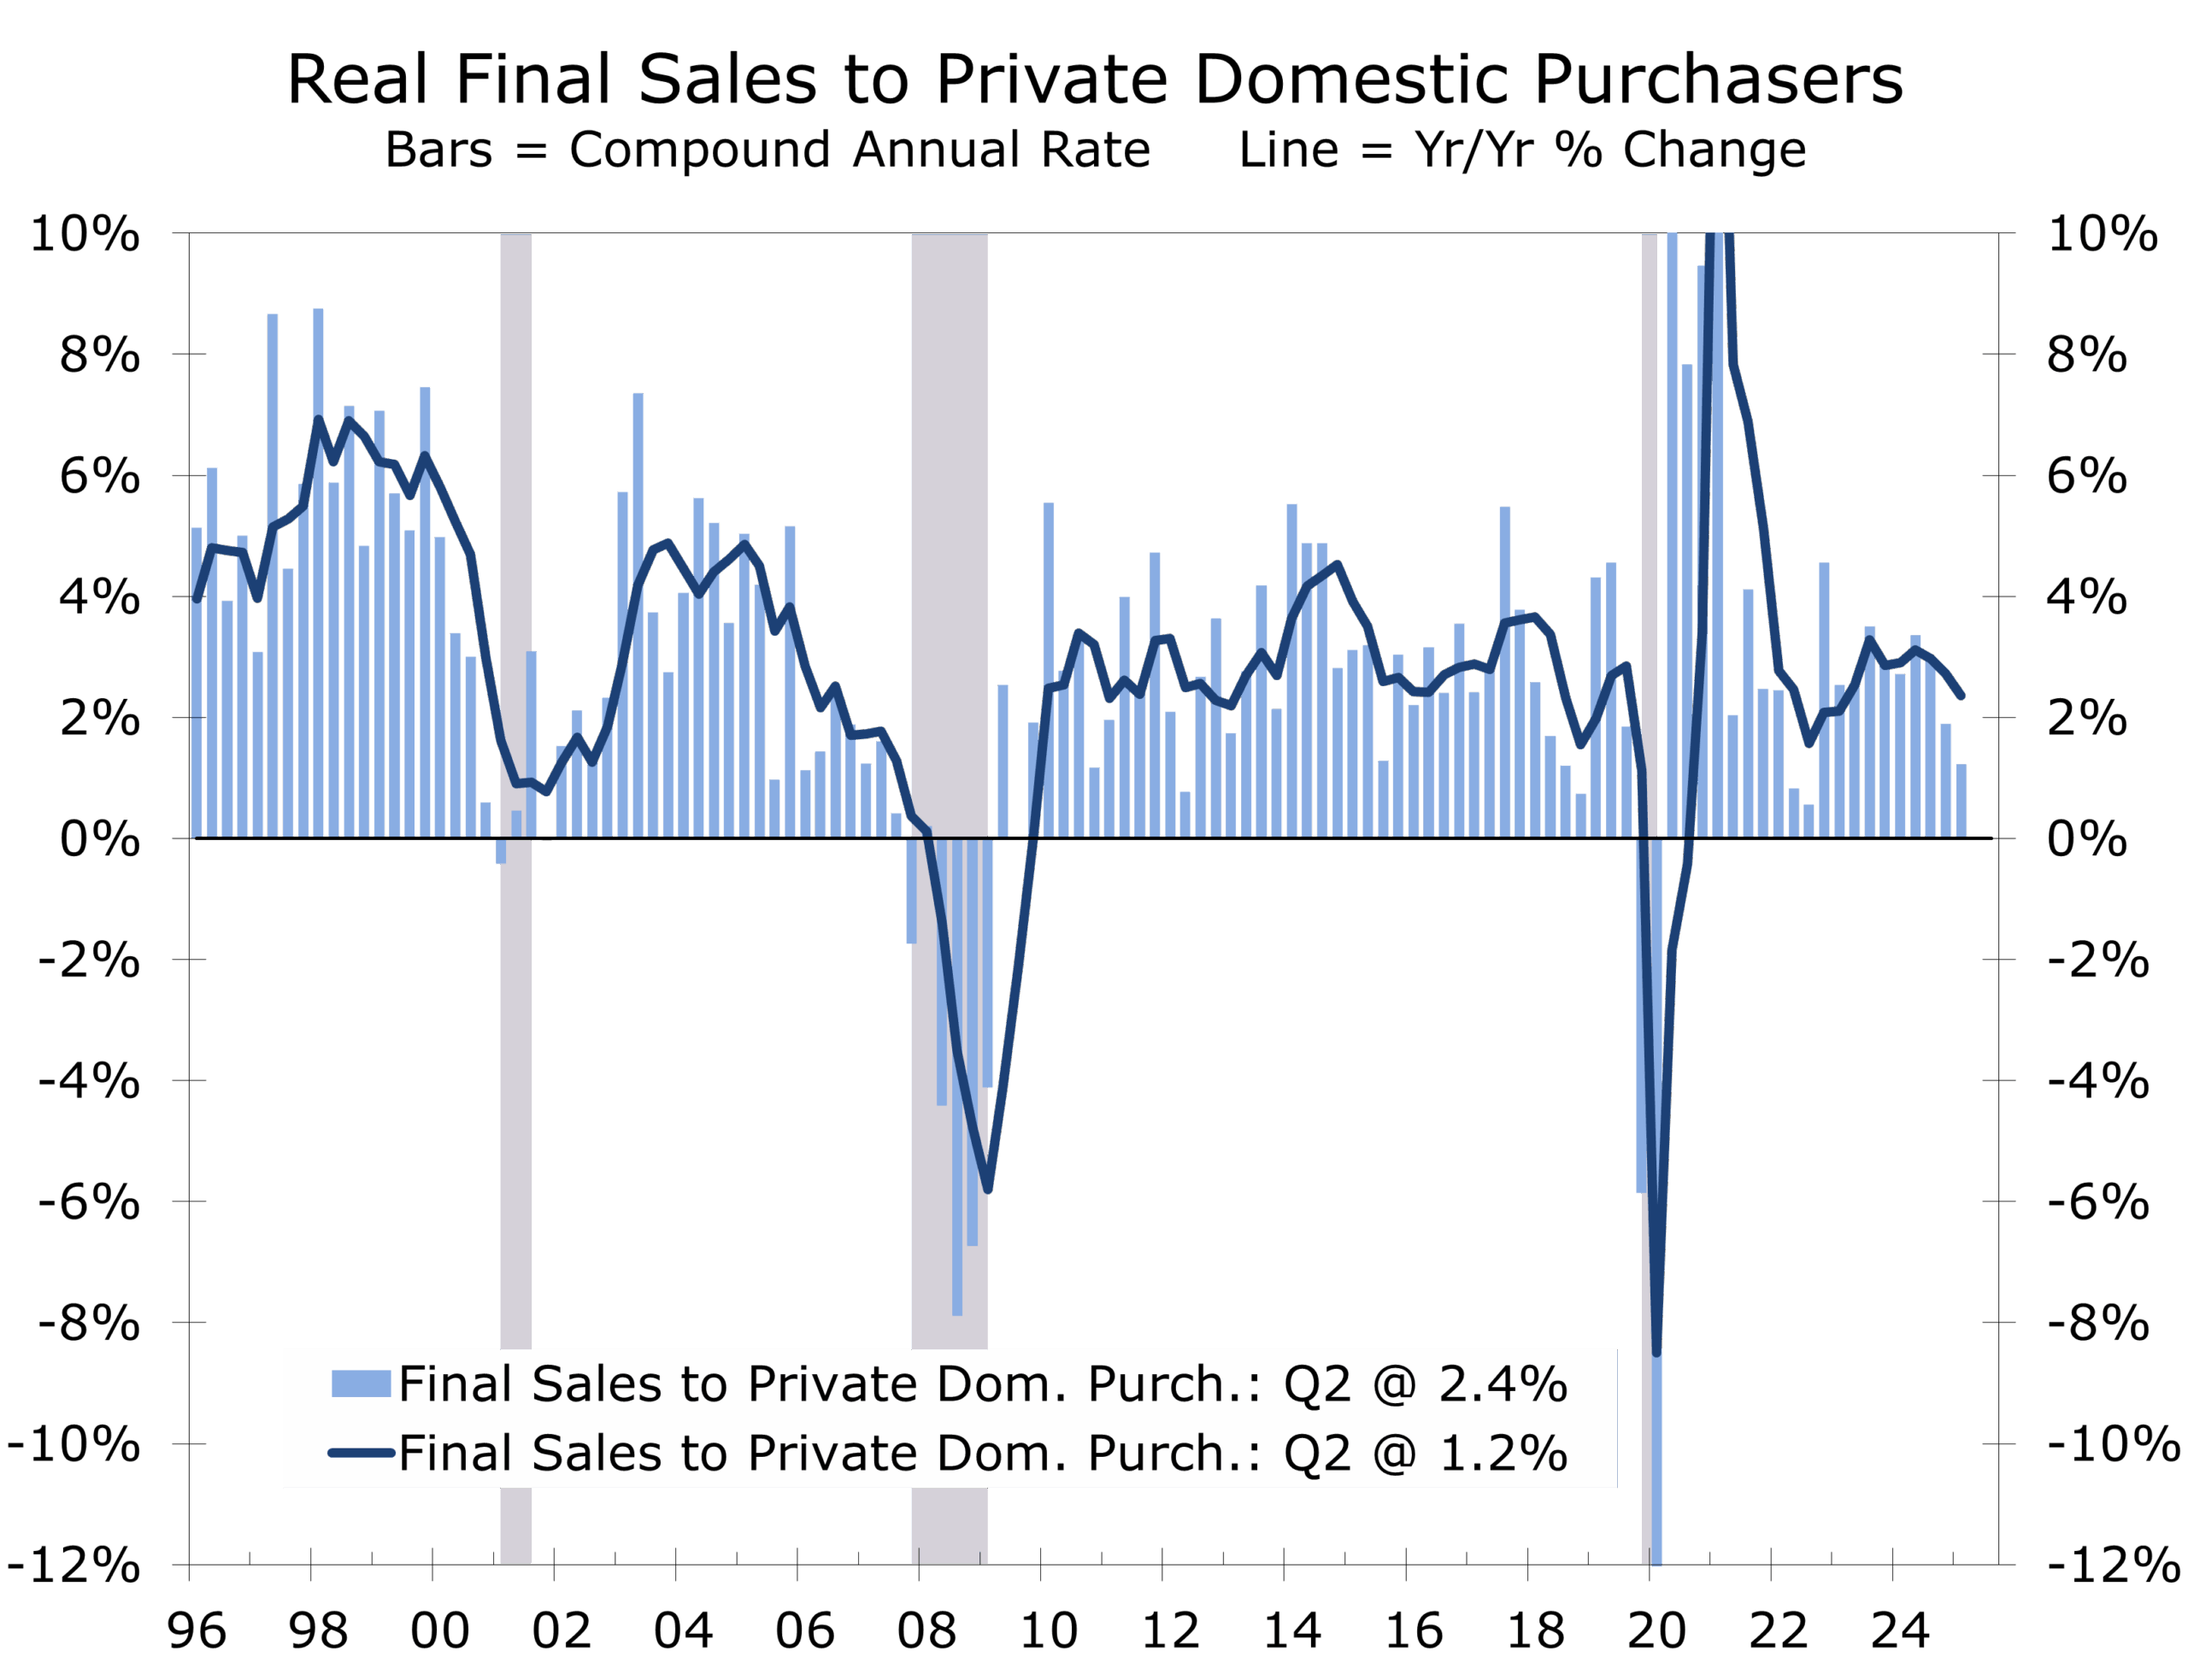
- Final sales to private domestic purchasers—a key gauge of core domestic demand—rose just 1.2%, the slowest pace since Q4 2022
- Trade dynamics reversed: net exports added 5.0 ppt to growth after subtracting 4.6 ppt in Q1
- Consumer spending edged up at a 1.4% annual rate, with goods purchases rising 2.2% and services outlays climbing 1.1%
- Business fixed investment rose at a 1.9% pace, with solid gains in equipment and intellectual property
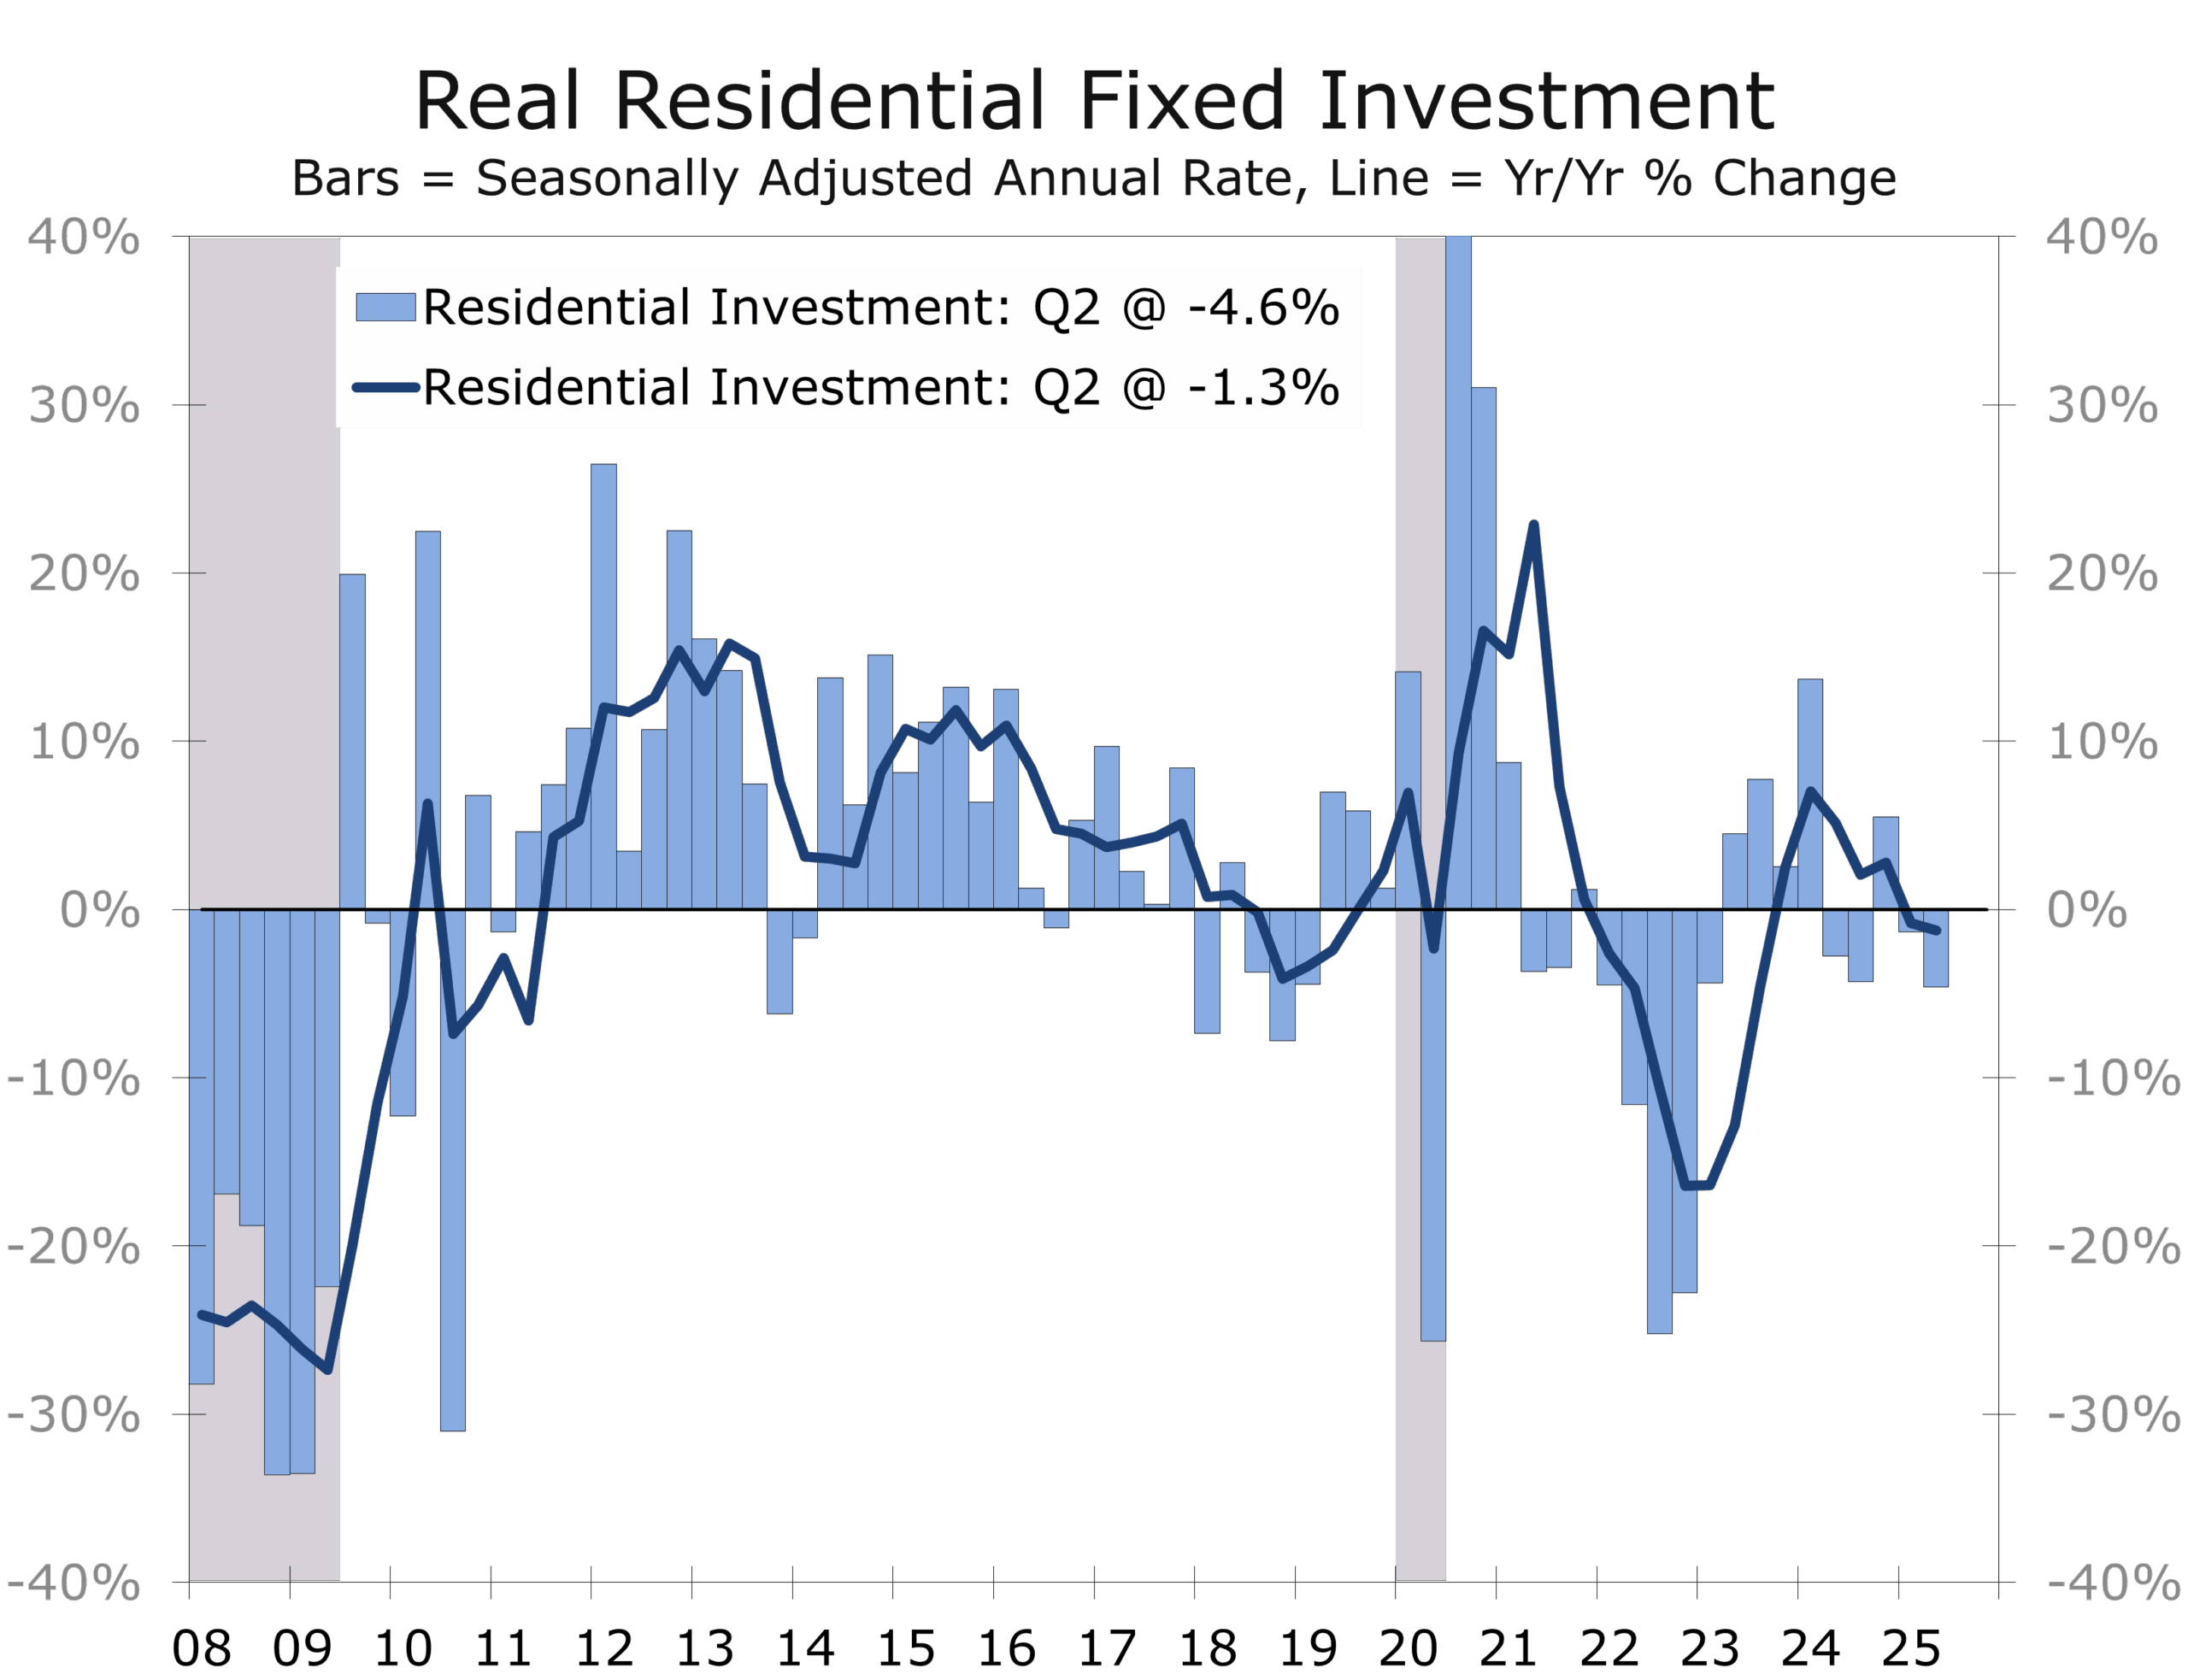
- Residential investment declined 4.6%, reflecting weaker home sales and a dwindling pipeline of new construction
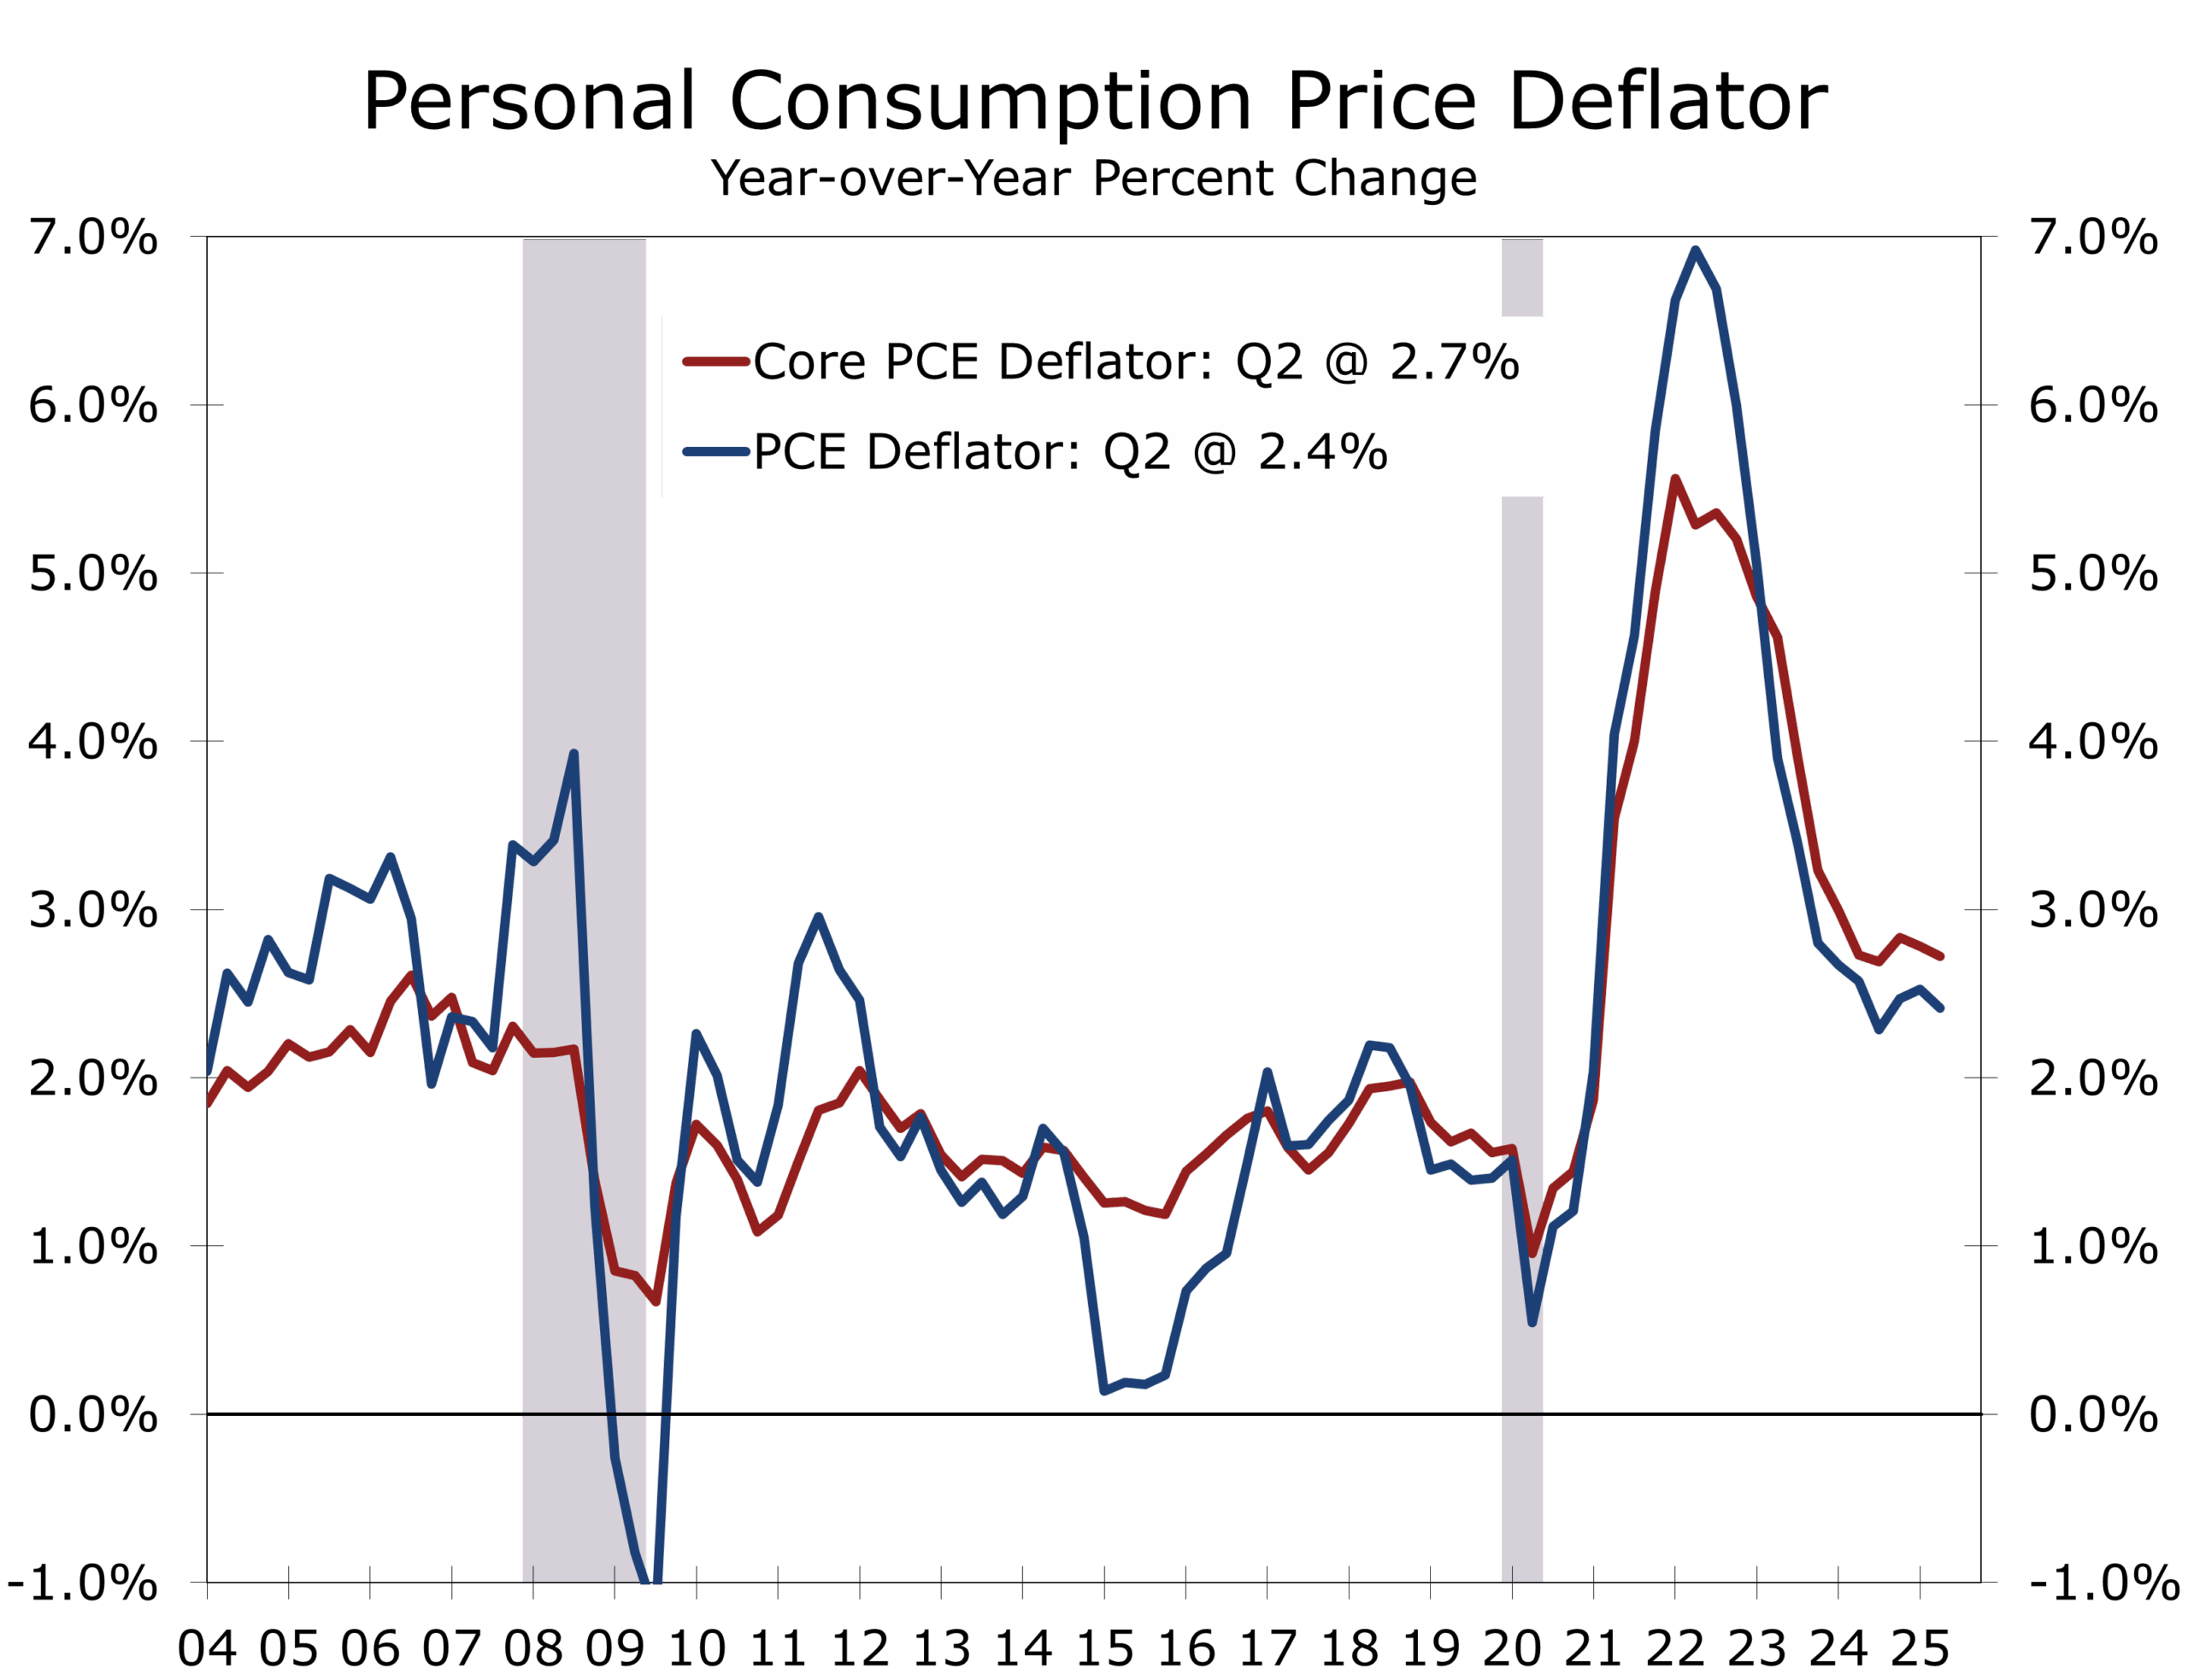
- The GDP price index rose 2.0%; Core PCE inflation increased at a 2.5% pace, while the overall PCE deflator rose just 2.1%. On a year-over-year basis, inflation is running at 2.4%, and Core PCE at 2.7%. Though above the Fed’s 2% target, the central bank retains room to ease restrictive policy
GDP Growth Rebounds on Trade Reversal, But Underlying Demand Cools
Real GDP expanded at a 3.0% annualized pace in Q2 2025, exceeding the consensus forecast of 2.4% and sharply reversing Q1’s 0.5% decline. The better-than-expected print followed reports of a much smaller May goods trade deficit, which lifted net exports.
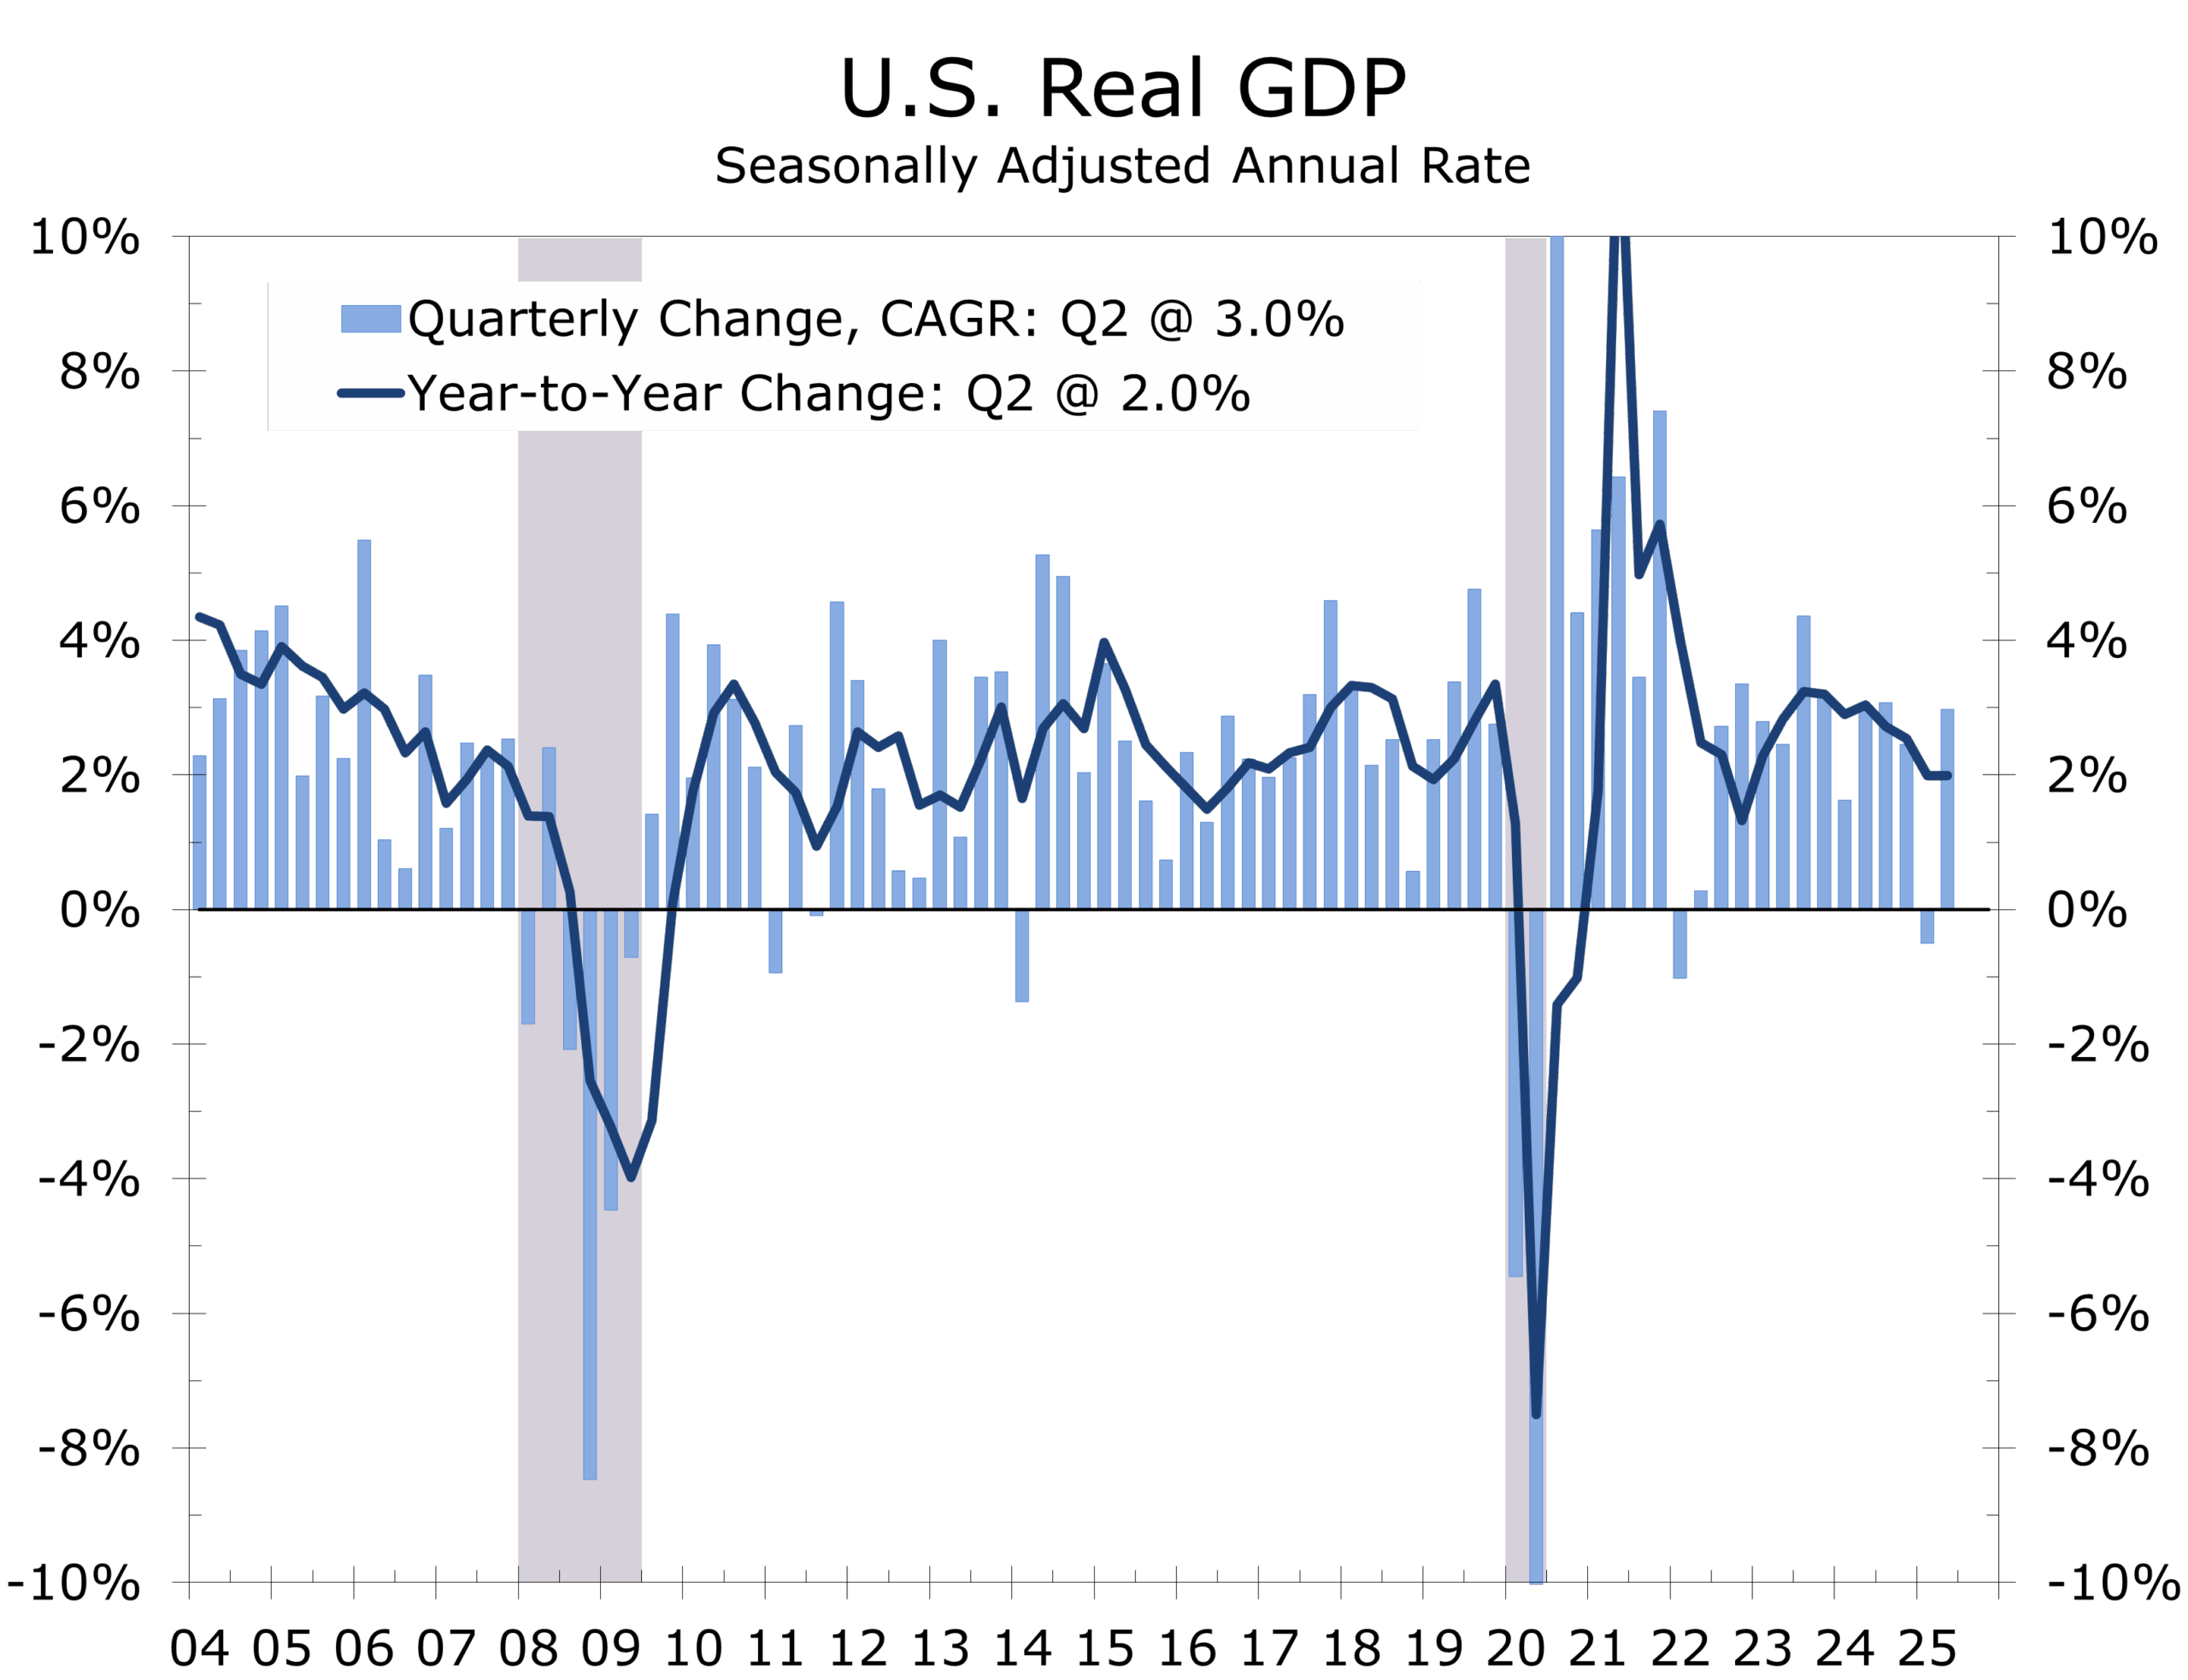
The underlying economy, however, delivered far more modest gains—closer to 1.5%. Much of the bounce reflects reversing trade distortions that have clouded GDP readings for two quarters running.
In Q1, businesses accelerated imports to beat sweeping new tariffs, causing net exports to subtract 4.8 ppt from GDP growth. That flipped sharply in Q2 as imports normalized, driving net exports to add 5.0 ppt to growth.
Tariff Reversal Drives 5.0 ppt Boost to GDP. Core Domestic Demand at Two-Year Low.
A simple average of the two quarters shows roughly 1.25% growth. Final sales to private domestic purchasers climbed 1.2% in Q2, down from 1.9% in Q1 and marking the weakest core GDP reading since Q4 2022—highlighting how trade volatility is obscuring underlying demand.
Consumer Spending Cools, Business Investment Softens
Consumption rose only 1.4% in Q2. Goods spending was supported by a 2.2% gain (nondurables +3.7%, durables +1.3%), while services rose 1.1%—an improvement from Q1’s 0.6%, but still below trend. Rising imports may be crowding out domestic-focused services like travel and dining, which are clearly softening.
Business fixed investment grew a modest 2.3%. Equipment spending rose 4.4%, while intellectual property products posted a strong 6.4% gain. Structures investment remained weak, reflecting challenges in commercial and energy sectors. Declining nondefense capital goods orders hint at possibly slower capex ahead—but we expect investment activity to revive later in 2025 and into 2026 as policy uncertainty subsides.
Housing Slumps to Worst Pace Since 2002. Capex Holds—But Outlook Turns Cautious.
Housing Drag Grows, but Weakness Could Be Short‑Lived
Residential investment fell 4.6%, the steepest drop since Q4 2002. A slowdown in home sales and an inventory build from completed, unsold units lifted vacancy rates and weighed on activity. Homebuilders face higher financing costs and waning demand. The drag is compounded by falling commission income, another component of residential investment. Housing may remain a headwind until mortgage rates ease and excess inventory is absorbed.
Overall government spending was unchanged. Federal outlays declined 3.7%—largely reflecting a pullback in nondefense spending (-11.2%), possibly due to DOGE initiatives. DOGE launched via executive order in January 2025 to modernize federal operations and cut waste. Defense spending rose 2.2%, while state and local outlays grew at a 3.0% pace.
Inflation Softens, Policy Flexibility Expands
Inflation trends eased in Q2. The GDP deflator rose 2.0%, with Core PCE inflation at 2.5%. Year-over-year, headline PCE stands at 2.4%, while Core PCE is 2.7%. Despite remaining above target, the moderation supports the possibility of upcoming rate cuts.
The Fed has room to ease despite inflation running slightly above its 2% target.
Murky Growth Outlook Persists Into H2
While the 3.0% GDP growth is eye-catching, beneath the surface the economy is growing more slowly. Weaknesses in final sales and trade distortions suggest muted momentum ahead. With nearly 60% of imports still uncovered by trade deals and persistent uncertainty over trade policy, growth is expected to average only about 1% in the second half of 2025.
The Fed is expected to maintain its policy rate at 4.25%–4.50% at the July FOMC meeting but may initiate up to three rate cuts by year-end. Clear signaling will be needed to reassure markets that easing is possible with inflation above target, which be made easier give softening labor conditions. While a recession is not forecast, near-term risks are elevated compared to 2026. Clarity on trade policy and lower rates may help shift the landscape later in the year as business investment and housing gradually improve.
Disclaimer: This publication has been prepared for informational purposes only and is not intended as a recommendation offer or solicitation with respect to the purchase or sale of any security or other financial product nor does it constitute investment advice.
July 30, 2025
Mark Vitner, Chief Economist
(704) 458-4000