Another Solid Quarter for Economic Growth
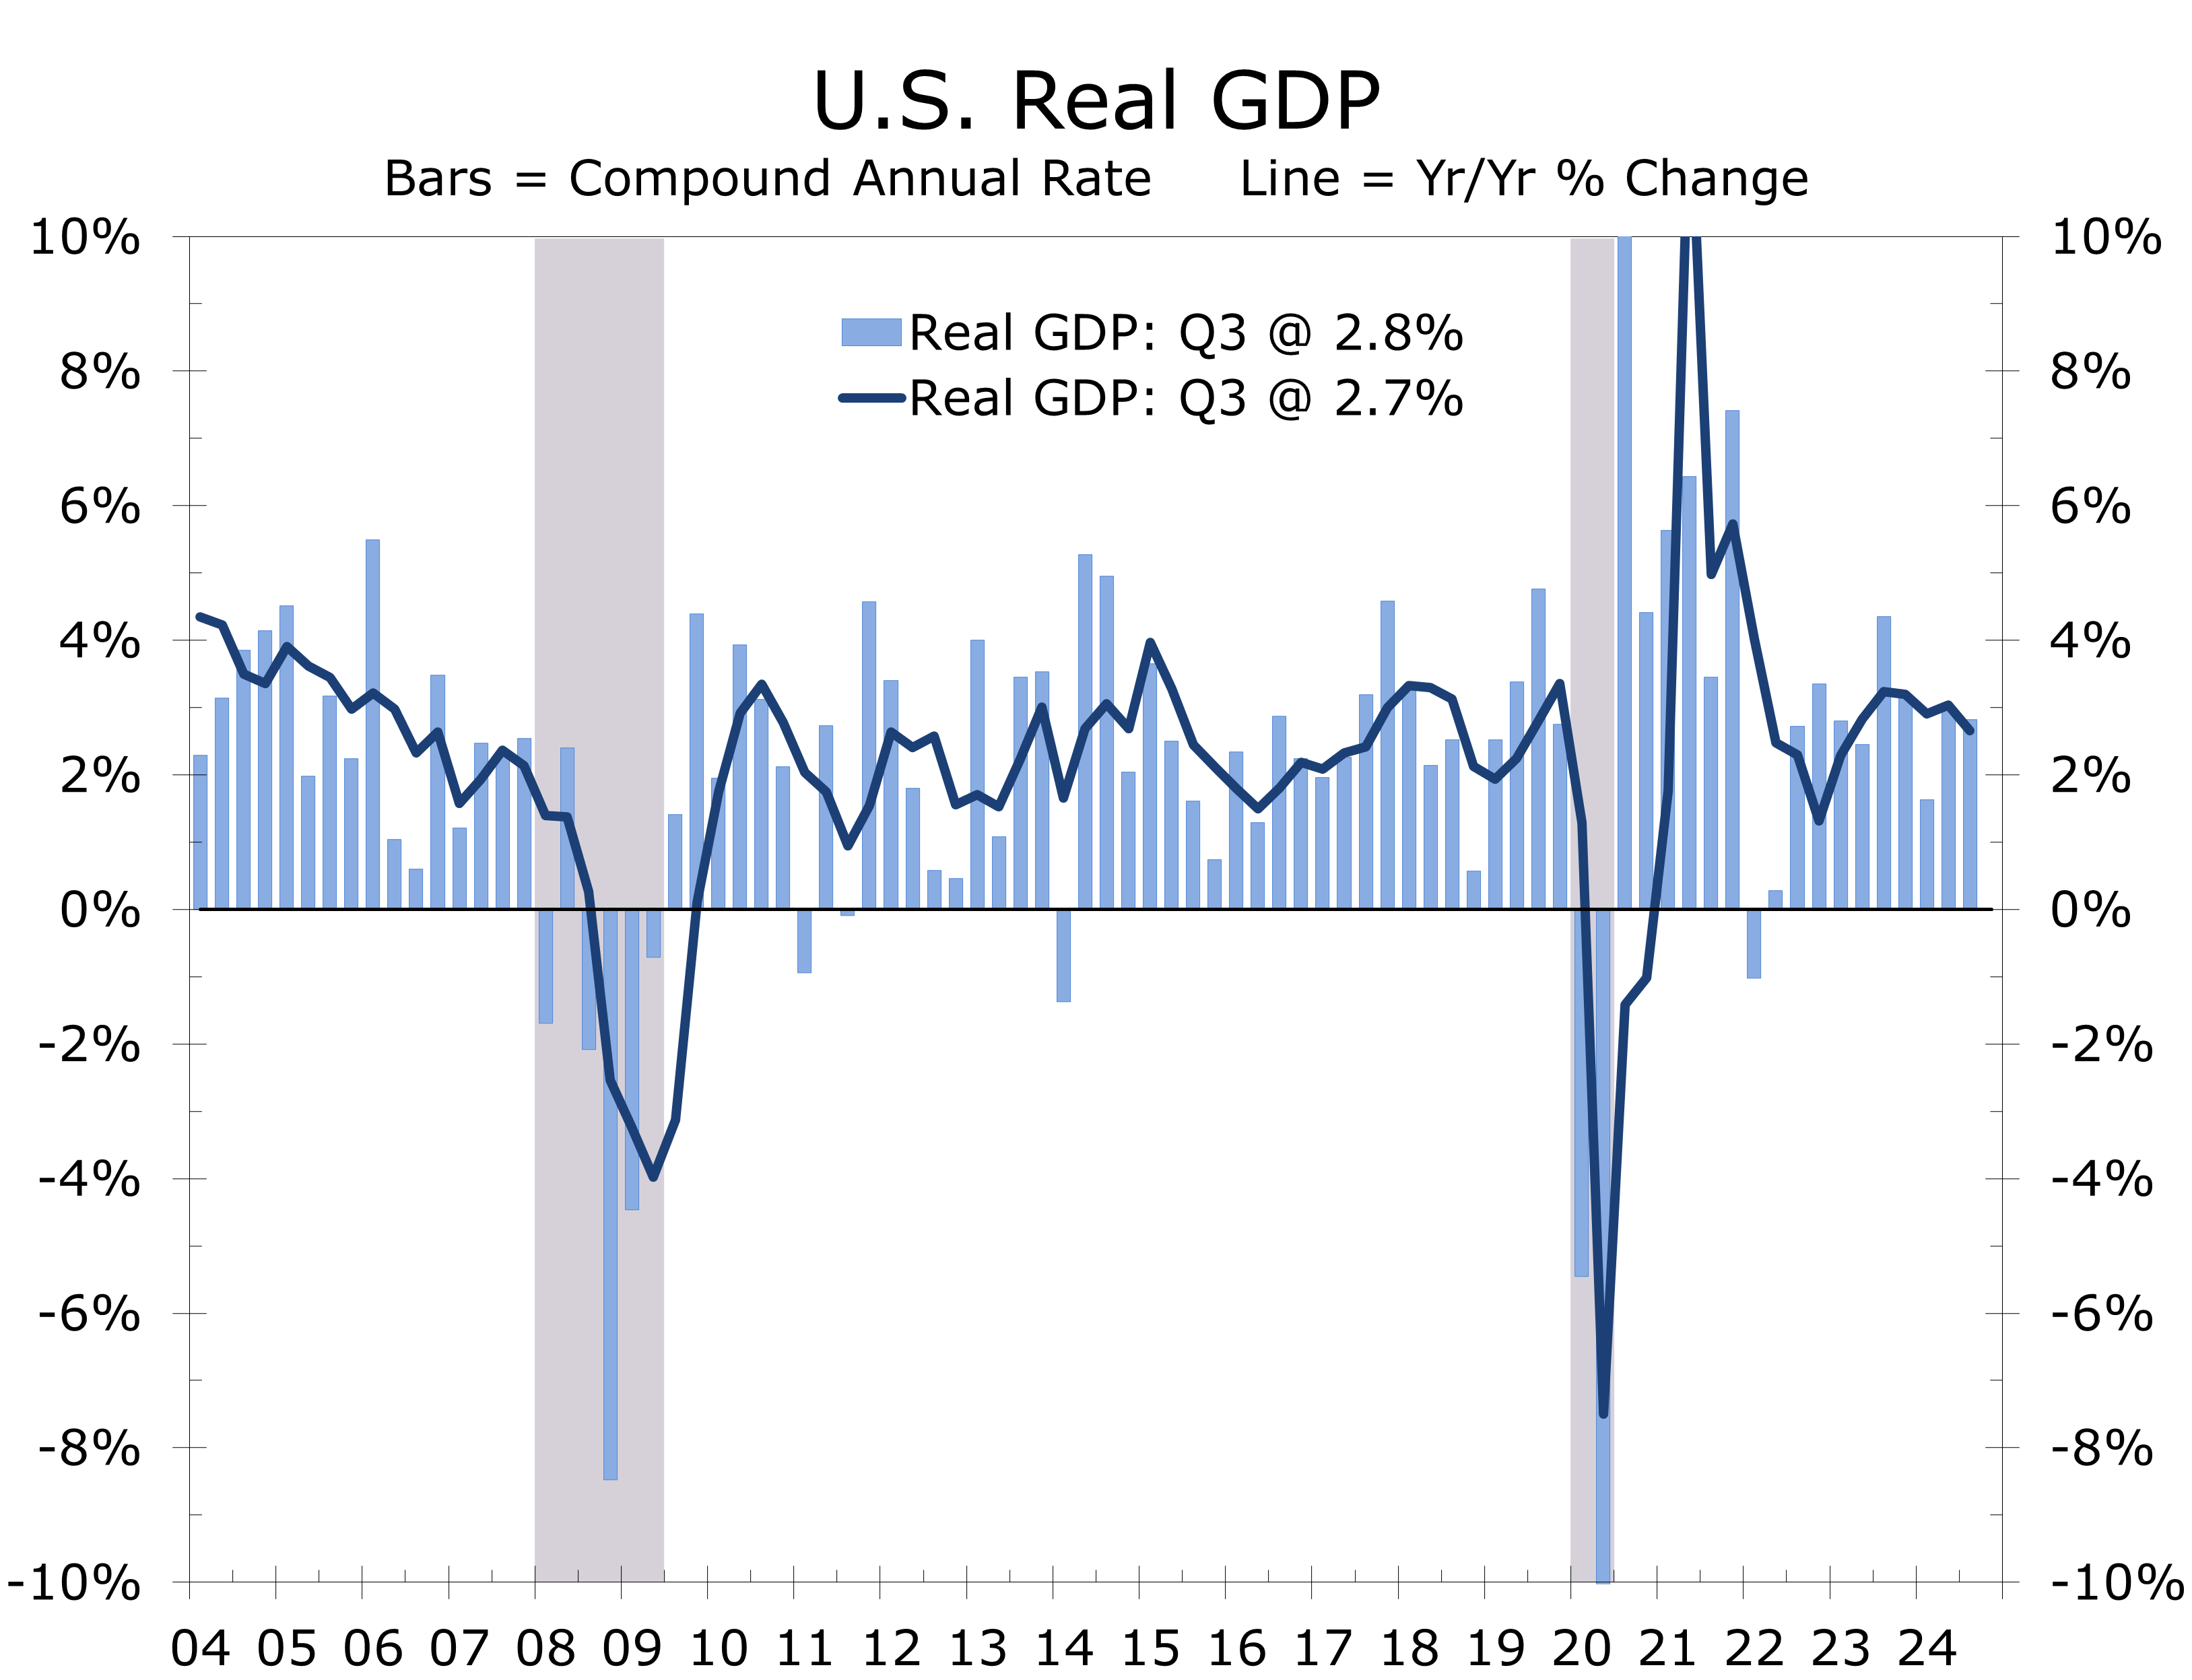
- Real GDP grew at a 2.8% annual rate in Q3, a slight deceleration from the 3.0% pace in the prior quarter. The underlying details were strong, while inflation came in slightly lower than market expectations.
- Real final sales to private domestic purchasers, which we call core GDP, grew at a 3.2% pace and has averaged a 3.1% pace for the past 7 quarters (or yearend 2022).
- Growth continues to be driven by a remarkably resilient consumer. Real personal consumption expenditures rose at a 3.7% pace in Q3 and have averaged a 2.9% pace since yearend 2022.
- Fixed investment grew at a solid 3.3% pace, driven by another surge in equipment spending. Structures investment declined, while intellectual property outlays posted another uncharacteristically modest gain. Residential investment fell at a 5.1% pace.
- The GDP data remain confoundingly positive. Since 2022, private final demand for goods and services has averaged over 3%, despite stagnant home and light vehicle sales. Growth is largely driven by a shift toward services and experiences.
The U.S. economy expanded at a solid 2.8% annualized rate in Q3, with real final sales to domestic purchasers hitting their highest mark since early 2023. This pace is hard to square with this past summer’s softer jobs number and calls for aggressive interest rates and reflects resilient consumer spending and business fixed investment.
Consumer spending remains the key underpin to the economy’s recent momentum, with spending supported by easing inflation and a resilient labor market. Moderating inflation, particularly for gasoline, is bolstering consumer purchasing power.
Consumer spending rose at a 3.7% pace in Q3. Goods purchases rose at an astounding 6.0% pace, the strongest pace since the first quarter of 2023. Spending for durable goods climbed at an 8.1% pace, while spending for nondurables rose at a 4.9% pace.
Falling gasoline prices helped drive real consumer spending higher this past summer.
The rise in goods purchases aligns with expectations, as core retail sales surged by 6.4% in Q3, pushing earlier GDP estimates higher. Key drivers included other nondurable goods, notably GLP-1 prescription drugs, and motor vehicles and parts, including maintenance and repairs. Services spending was led by strong gains in healthcare and continued growth in dining, hotels, and other experiential sectors, including sporting events, concerts and other live performances.
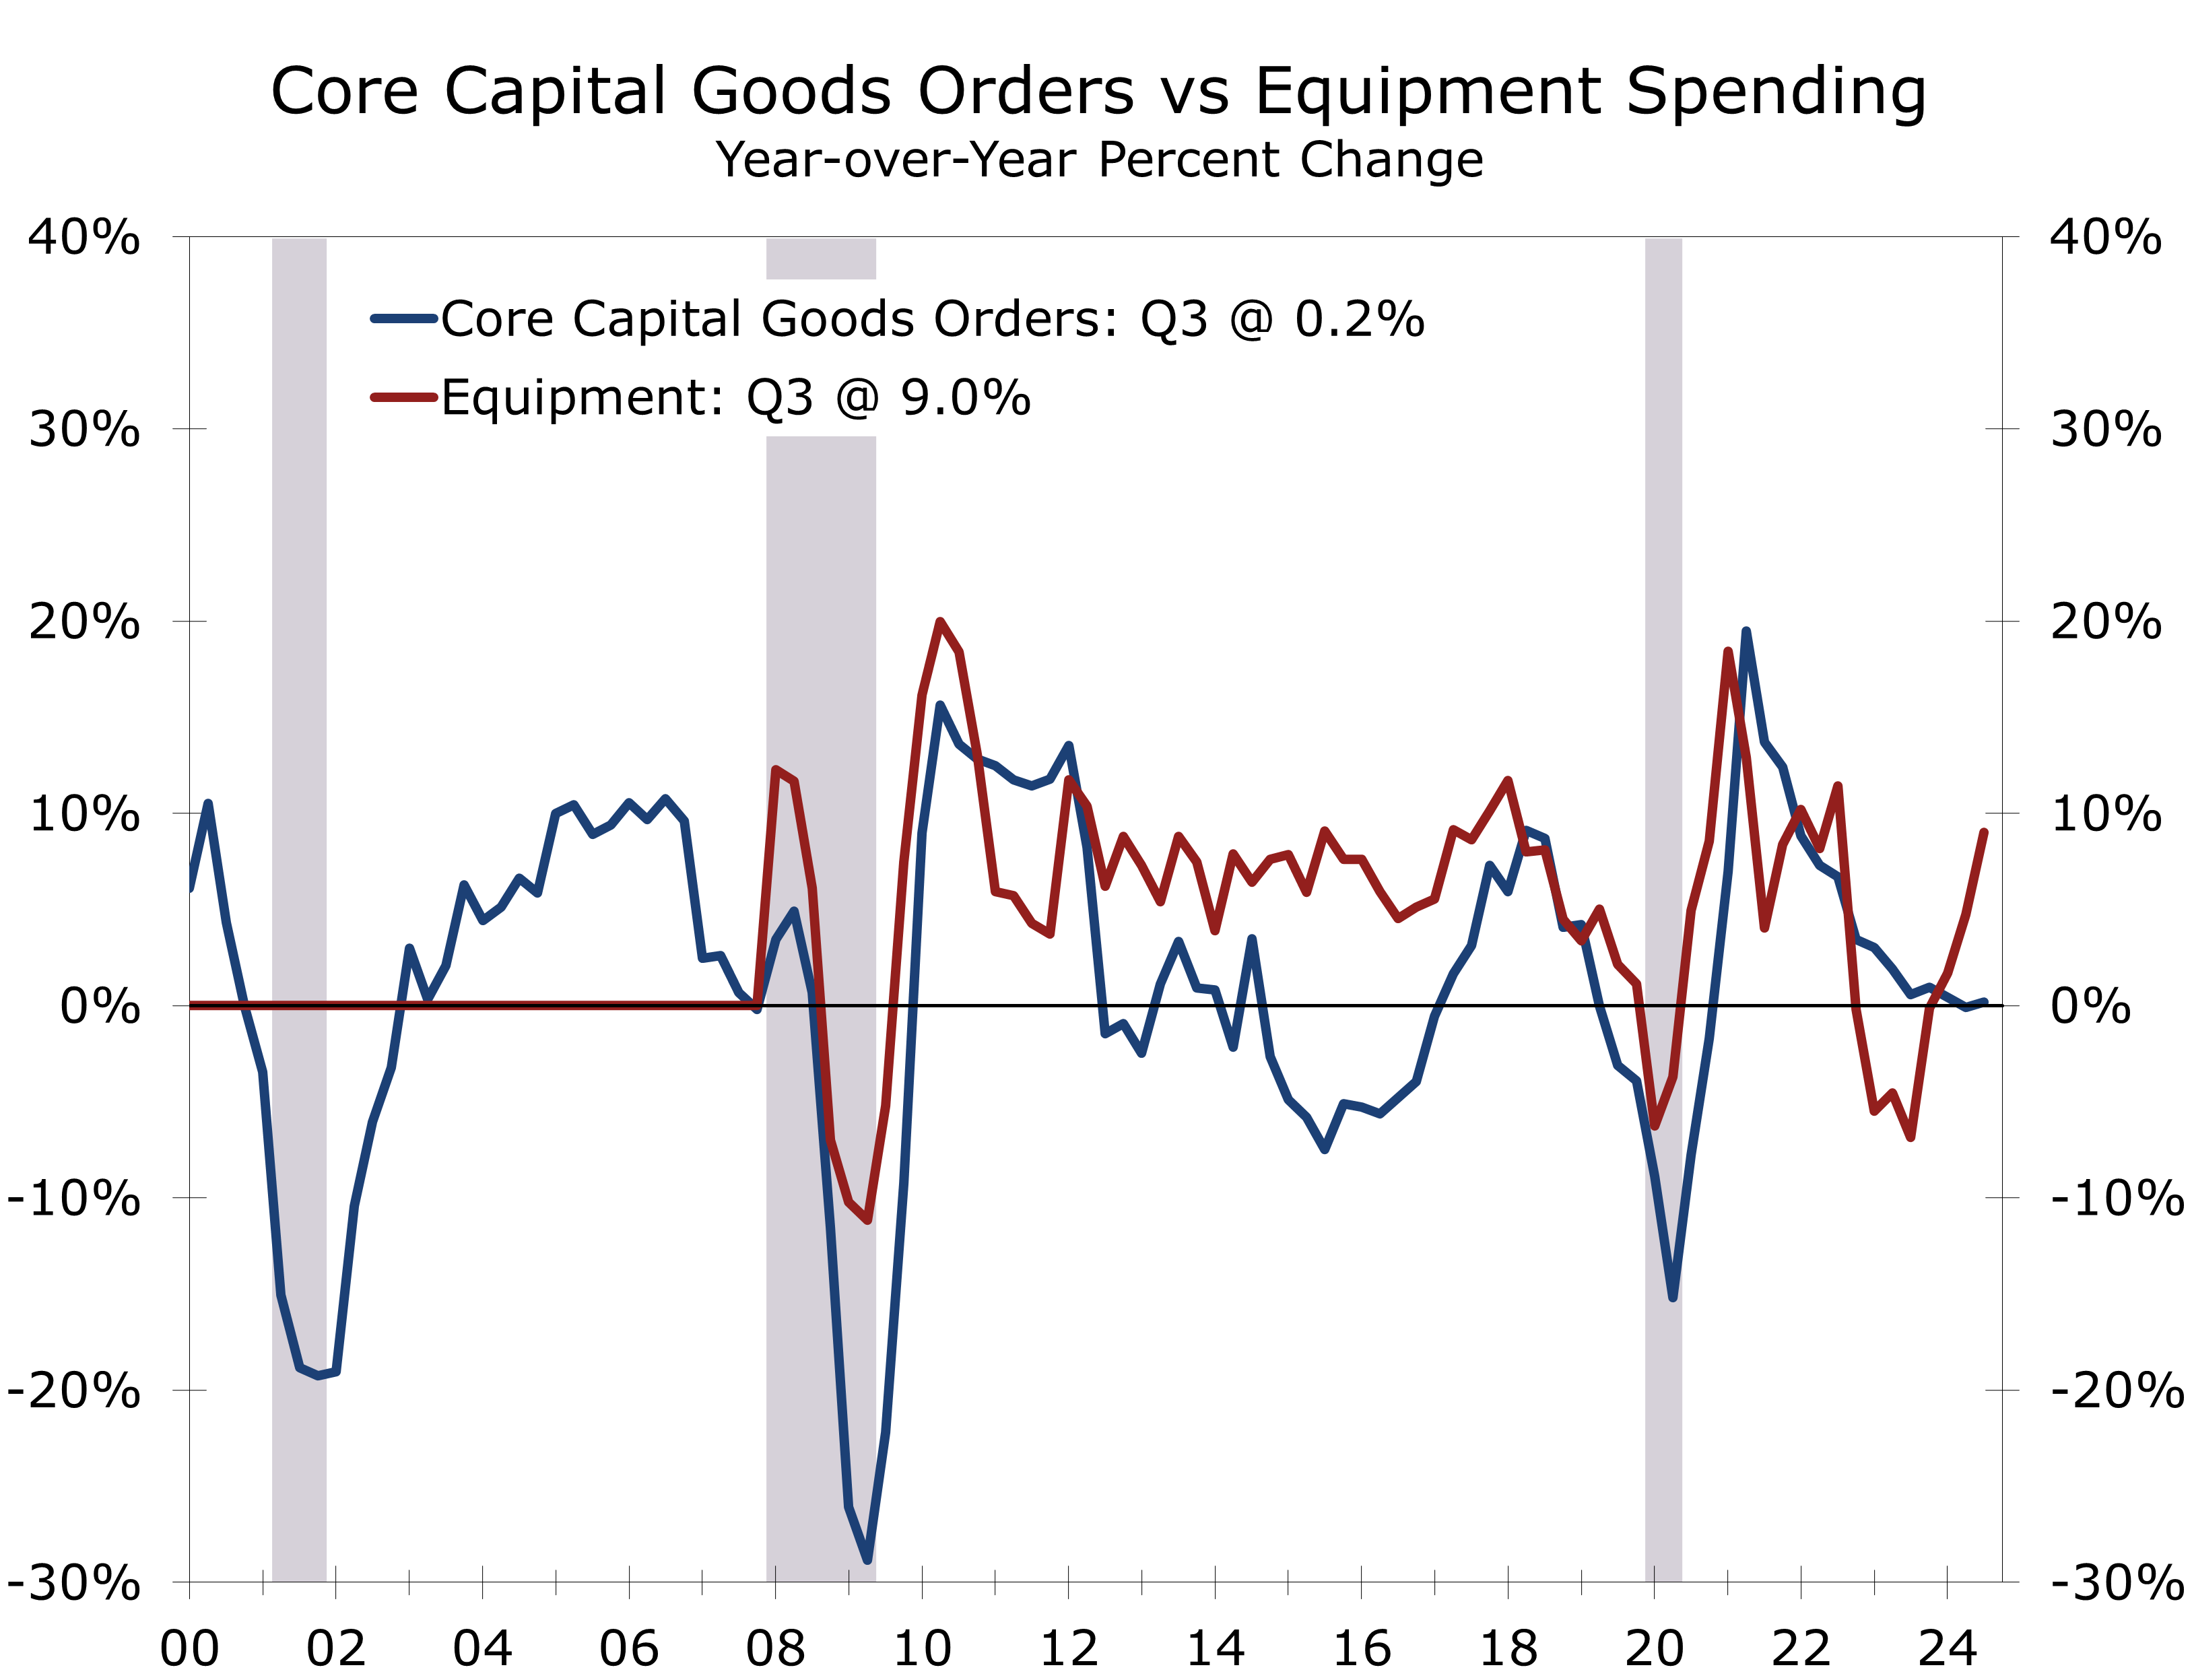
Business fixed investment rose at a solid 3.3% pace, driven by an 11.1% surge in equipment investment. This increase likely reflects a catch-up to the earlier spike in factory construction. Additionally, the East Coast port strike likely prompted firms to accelerate deliveries, which could result in a payback in Q4. The recent trend in orders supports this notion.
A surge in capital equipment spending continues to drive business fixed investment.
Outlays for structures fell at a 4.0% annual rate, reflecting a dwindling pipeline of incentive-driven projects. Hyundai’s massive EV assembly plant outside Savannah recently began production, and Taiwan Semiconductor’s plant in Arizona has also been completed. Additionally, oil and gas exploration expenditures, which contribute to structures investment, have also slowed.
Spending on intellectual property, which encompasses software and film production, remains weak, with investment growing at only a 0.6% annual rate, following a 0.7% increase in the previous quarter. This minimal growth coincides with a slowdown in hiring in key tech hubs like Silicon Valley, Austin, and the Research Triangle. Additionally, a slump in the entertainment industry is impacting hiring in major film centers in Southern California and Atlanta.
Government spending grew at a robust 5.0% pace in Q3, led by federal defense outlays, which surged at a 14.9% pace. State and local government spending rose at a healthy 2.3% pace, reflecting strong revenue growth and residual stimulus dollars.
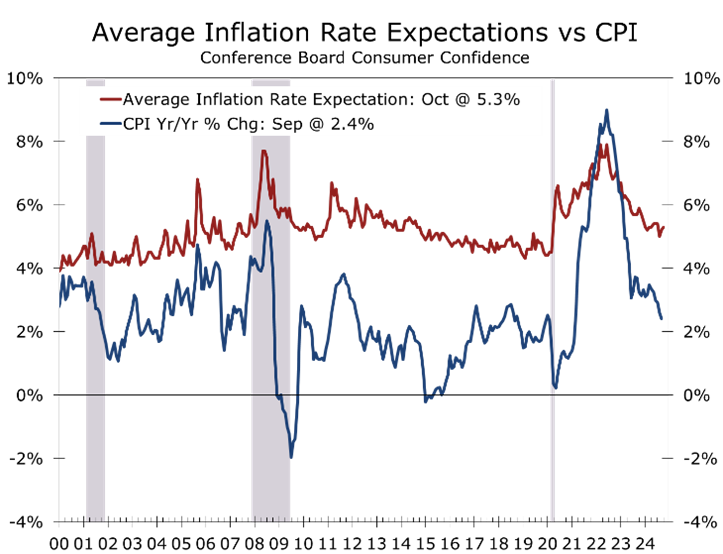
While economic growth was stronger than expected, inflation was slightly lighter. The GDP deflator rose at just a 1.8% annual rate, while the PCE deflator climbed at a rate of 1.5%, largely due to a decline in gasoline prices. Excluding food and energy prices, the core PCE deflator—the Fed’s preferred inflation gauge—rose at a 2.2% pace and is up just 2.3% over the past year.
Despite the recent improvement, consumers are still suffering from inflation fatigue. Overall prices are about 20% higher than they were before the pandemic, with grocery prices up 25% and rent rising by 30%. Wages have not kept pace with inflation, and the proportion of the population able to afford a new or existing home, as well as a new car or SUV, remains near an all-time low. This situation reflects consumers’ frustration with the economy and is why the Fed will likely tread carefully in reducing short-term rates. It also explains the restlessness among voters heading into the election.
Disclaimer: This publication has been prepared for informational purposes only and is not intended as a recommendation offer or solicitation with respect to the purchase or sale of any security or other financial product nor does it constitute investment advice.
October 30, 2024
Mark P. Vitner, Chief Economist
mark.vitner@piedmontcrescentcapital.com
(704) 458-4000