Consumer Spending Was Solid Ahead of the Iran War
- Retail sales rose 0.6% MoM in February 2026, a broad-based rebound following January’s upwardly revised –0.1% decline; the gain beat consensus estimates across all major categories.
- Core retail sales rose solidly. Sales excluding autos, gasoline, building materials, and restaurants rose +0.4% — the best reading since August 2025. Along with our estimate of services outlays, this points to a +0.6% nominal and +0.2% real increase in PCE for Februaryf.
- We have lowered our Q1 real GDP forecast by 0.1 percentage point to a 2.0% annual rate. Real PCE is tracking a 1.5% annualized gain in Q1, consistent with our previously published forecast. We expect growth to strengthen modestly in Q2 and to end the year with solid momentum.
- The U.S./Israel war with Iran will begin weighing on March data, as gasoline prices averaged approximately 75 cents per gallon higher than in February. The near-term buffer comes from income tax refunds, which are running +12.5% YoY — cushioning discretionary spending for another month or two.
- Import prices surged +1.3% in February, the largest monthly jump since March 2022, compressing real purchasing power — most acutely for lower- and middle-income households who face a disproportionate tariff burden.
- Our 2026 outlook remains essentially the same as was published in March. We see real personal consumption expenditures rising at just a 1.6% pace in the first half of 2026, but look for spending to rebound to a 2.1% pace in the second half, aided by larger tax refunds and lower energy prices.
| Data Note
Source and Methodology This report draws on the U.S. Census Bureau’s Advance Monthly Retail Trade Survey (MARTS) released April 1, 2026, covering February 2026 activity. The release was rescheduled from March 16 following a lapse in federal appropriations. All figures are seasonally adjusted and not adjusted for price changes unless stated. Oxford Economics/Haver Analytics commentary (April 1, 2026) provides the PCE nowcast and consumption outlook. YoY comparisons use prior advance estimates as the base. |
| +0.6%
Total retail & food services, MoM — February 2026 |
+0.4%
Control group (ex-auto, gasoline, building material, food services) — 6-month high |
| +1.5%
Real PCE, Q1 2026 annualized — consistent with prior forecast |
2.0%
Piedmont Crescent Capital Q1 real GDP forecast (annualized rate) |
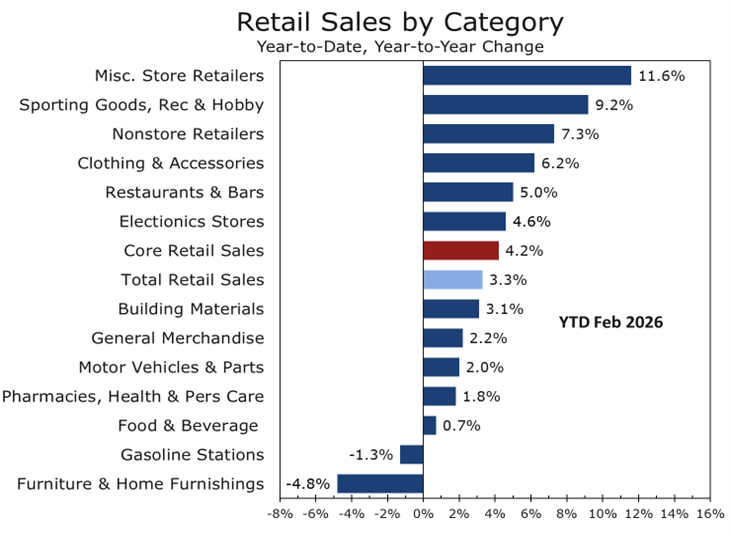
The February Rebound: Sales by Category
February’s +0.6% gain was the broadest monthly advance since mid-2025. The increase was broad-based and includes gains in categories where spending was likely depressed by weather in January — automobiles and restaurants and bars in particular. The only two categories to register outright declines were furniture, which continues to be weighed down by elevated mortgage rates and weak existing-home sales, and grocery stores, where deflation in some food categories is depressing the nominal total. Motor vehicles drove the headline increase, but the control group’s +0.4% print — which strips out autos, gas, building materials, and food services — confirms that the underlying demand signal is broad and genuine.
Full Category Breakdown — February 2026
| Category | MoM Change | YoY Change |
| Total Retail & Food Services | +0.6% | +3.2% |
| Control Group | +0.4% | +3.5% |
| Motor Vehicles & Parts Dealers | +1.5% | +2.8% |
| Food & Beverage Stores | –0.3% | +2.9% |
| General Merchandise Stores | +0.2% | +2.6% |
| Clothing & Accessories | +1.5% | +3.8% |
| Health & Personal Care | +1.7% | +4.5% |
| Nonstore Retailers (e-Commerce) | +0.8% | +10.9% |
| Food Services & Drinking Places | +0.5% | +4.2% |
| Gasoline Stations | +0.9% | –2.1% |
| Furniture & Home Furnishings | –1.0% | –0.4% |
| Electronics & Appliances | +0.3% | +1.8% |
| Building Materials & Garden | +0.8% | +2.3% |
Key Signal
Control Group at 6-Month High: PCE Pointing to +0.2% Real Gain in February
The control group — ex-auto, gasoline, building materials, and food service sales — rose +0.4% in February, its strongest reading since August 2025. Combined with our estimate of services outlays, this points to a +0.6% nominal and +0.2% real increase in PCE for February. For Q1 as a whole, real consumer spending is tracking an annualized rate of approximately 1.5%, consistent with our previously published forecast. This metric feeds directly into the BEA’s GDP consumption estimate and is the single most important data point in the retail report for near-term GDP tracking.
Forces Shaping the Consumer Outlook
The February retail print is constructive at face value. However, three forces are converging to pressure consumer spending through the spring and into summer: the U.S./Israel war with Iran and the attendant energy price shock, continuing tariff passthrough into consumer goods prices, and a bifurcation in real income growth that is concentrating spending gains at the upper end of the income distribution. Recent financial market volatility and disruptions around spring break travel may also sideline some discretionary spending by upper-income households in the near term.
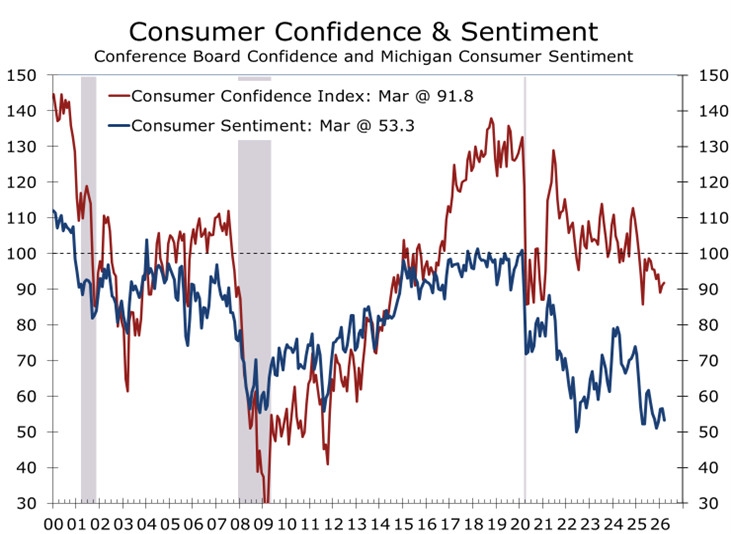
Consumer confidence data presents a mixed picture. The University of Michigan Consumer Sentiment Index has plummeted in recent months, while the Conference Board Consumer Confidence measure has shown more resilience. We suspect that concerns about rising gasoline prices and uncertainty about what the war’s implications for supply chains and inflation will weigh on actual spending this spring, even among households whose balance sheets remain relatively healthy.
The War with Iran: A More Immediate Risk to Consumer Spending
The U.S./Israel war with Iran introduces a risk that is more immediate in its consumer spending impact than tariff pressures. Gas prices averaged approximately 75 cents per gallon higher in March compared to February — a swift, regressive increase in household energy costs. Higher energy prices should become evident in the March retail sales data, with spending on durable goods and discretionary services bearing the brunt of the adjustment. We left our consumption forecast unchanged, however, as we had already assumed a substantial pullback in spending would take hold in March and persist through much of the second quarter.
The near-term impact is cushioned by a powerful, if unusual, buffer: income tax refunds. Refund issuance is running approximately +12.5% YoY through late March, a notable departure from the typical pattern in which the YoY increase peaks early in the filing season and then fades. The One Big Beautiful Budget Act is expected to generate a jump in refund issuance of approximately 20% for the full year. Crucially, the increase is occurring more gradually than usual, meaning a disproportionate share will accrue to upper-income households who tend to file later in the season.
| Risk Factor
War and Tariffs: Twin Pressures Compressing Real Spending Power Import prices jumped +1.3% in February 2026 — the largest monthly increase since March 2022 — even before the Iranian war’s energy price shock has fully registered. Gasoline prices will likely remain elevated through Memorial Day, weighing on consumer spending through at least mid-Q2. The Yale Budget Lab estimates current tariffs represent a 9.8–13.7 percentage point increase in the effective U.S. tariff rate, the highest since 1941, creating an effective cost burden of $600–$1,300 per household annually. Lower-income cohorts bear approximately three times the proportional tariff burden of top-decile earners, underscoring the regressive nature of the combined energy and trade policy shock. |
The Tax Refund Buffer: Buying Time, Not Immunity
The unusual pattern of tax refund issuance is central to understanding why consumer spending has held up despite sharply deteriorating sentiment and rising energy costs. In a typical year, the YoY increase in cumulative refund issuance peaks early in the filing season — when lower-income households, who tend to file first, receive their refunds — and then gradually fades. In 2026, the opposite is occurring: the YoY increase has been rising through late March, reaching approximately +12.5% compared to the same period in 2025.
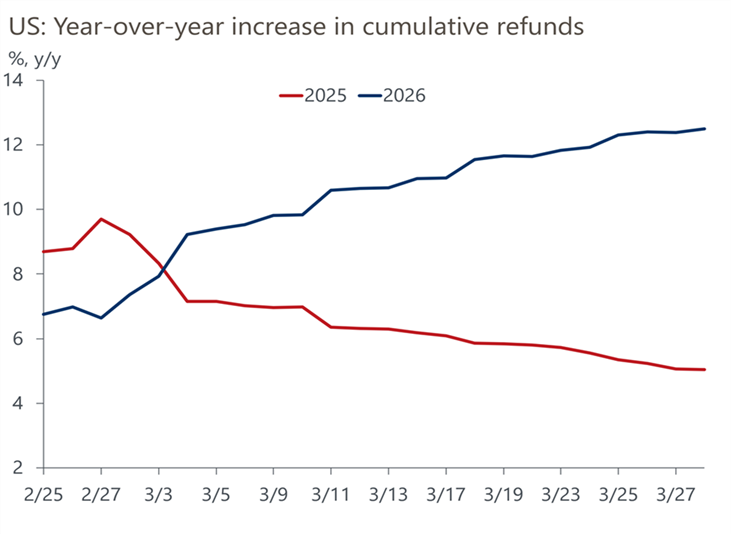
This pattern has significant distributional implications. A disproportionate share of the 2026 refund increase will accrue to upper-income households who file later in the season. The One Big Beautiful Budget Act created a structural increase in refund issuance estimated at approximately 20% for the full year. Higher-income filers receiving larger-than-normal refunds is providing support for spending in premium retail and warehouse-club formats even as lower-income cohorts face simultaneous tariff, energy price, and food inflation pressures. This dynamic reinforces the K-shaped character of the current consumer environment: aggregate spending metrics hold up reasonably well, while conditions for a large share of American households are materially more difficult.
The structural shift toward e-commerce continues to shape the distribution of retail gains. Nonstore retailers posted +10.9% YoY growth in the latest reading, maintaining substantial outperformance over brick-and-mortar formats. Q4 2025 e-commerce reached $316.1 billion seasonally adjusted — equivalent to 16.6% of total retail sales, up from 15.8% a year earlier. This channel shift has important implications for commercial real estate, logistics infrastructure, and labor demand across the retail sector.
| Structural Context
E-Commerce and Income Bifurcation Are Reshaping the Retail Landscape Full-year 2025 U.S. e-commerce totaled approximately $1.23 trillion, up +5.4% from 2024. NRF data indicate that the top 10% of earners now account for approximately 50% of all U.S. consumer spending. Clothing (+1.5% MoM) and health and personal care (+1.7% MoM) led the February gains, categories that skew toward higher-income consumers. Meanwhile, furniture (–1.0% MoM) and grocery stores (–0.3% MoM) — categories more broadly consumed across the income distribution — were the only segments to register outright declines. These divergences will likely widen as the energy price shock from the war with Iran takes hold in coming months. |
Conclusion: Consumer Resilience in a Crosscurrent Environment
The February 2026 Advance Retail Sales report underscores the fundamental resilience that has characterized U.S. consumer spending throughout this economic cycle. A broad-based +0.6% headline gain, a six-month high in the control group measure, and an Oxford Economics PCE nowcast pointing to +0.2% real consumer spending growth confirm that the January weakness was weather-driven rather than structural. The consumer entered the spring in solid shape.
Our assessment of Q1 GDP and the near-term outlook remains constructive. Real PCE is tracking a 1.5% annualized rate in Q1 2026, consistent with our previously published forecast, and underpins our Q1 real GDP forecast of 2.0% annualized. We expect growth to strengthen modestly in Q2 as the tax refund buffer continues to support upper-income spending, and we look for the economy to end 2026 with solid momentum as energy prices gradually recede and real incomes recover.
— Mark P. Vitner, Chief Economist, Piedmont Crescent Capital |
Three considerations shape our near-term outlook. First, the energy price shock from the war with Iran will be visible in the March retail data, and we expect it to restrain discretionary spending through at least Memorial Day. Second, the tax refund buffer — while real and meaningful — is a stock rather than a flow; once deployed, households will face the underlying pressures of elevated goods prices and rising energy costs without this cushion. Third, the coincidence of tariff passthrough and energy inflation creates a compounding price burden that falls most heavily on lower- and middle-income consumers, limiting the breadth of any spending recovery.
— Mark P. Vitner, Chief Economist, Piedmont Crescent Capital |
Key data releases to monitor: March retail sales (April 16) will provide the first direct measure of the war’s impact on consumer spending; the Q1 GDP advance estimate (April 30) will confirm whether the February control group strength flowed through to final demand; April CPI will indicate the velocity of energy and goods price passthrough; and the Federal Reserve’s May communications will clarify whether policymakers intend to ‘look through’ the war- and tariff-driven inflation or respond to it.
— Mark P. Vitner, Chief Economist | Piedmont Crescent Capital | April 1, 2026
Disclaimer: This publication has been prepared for informational purposes only and is not intended as a recommendation offer or solicitation with respect to the purchase or sale of any security or other financial product nor does it constitute investment advice.
April 1, 2026
Mark Vitner, Chief Economist
(704) 458-4000