Shelter Slows, Energy Drops, Tariffs Lift Core to Six-Month High
- Headline CPI rose 0.2% in July, down from 0.3% in June, and matching consensus expectations.
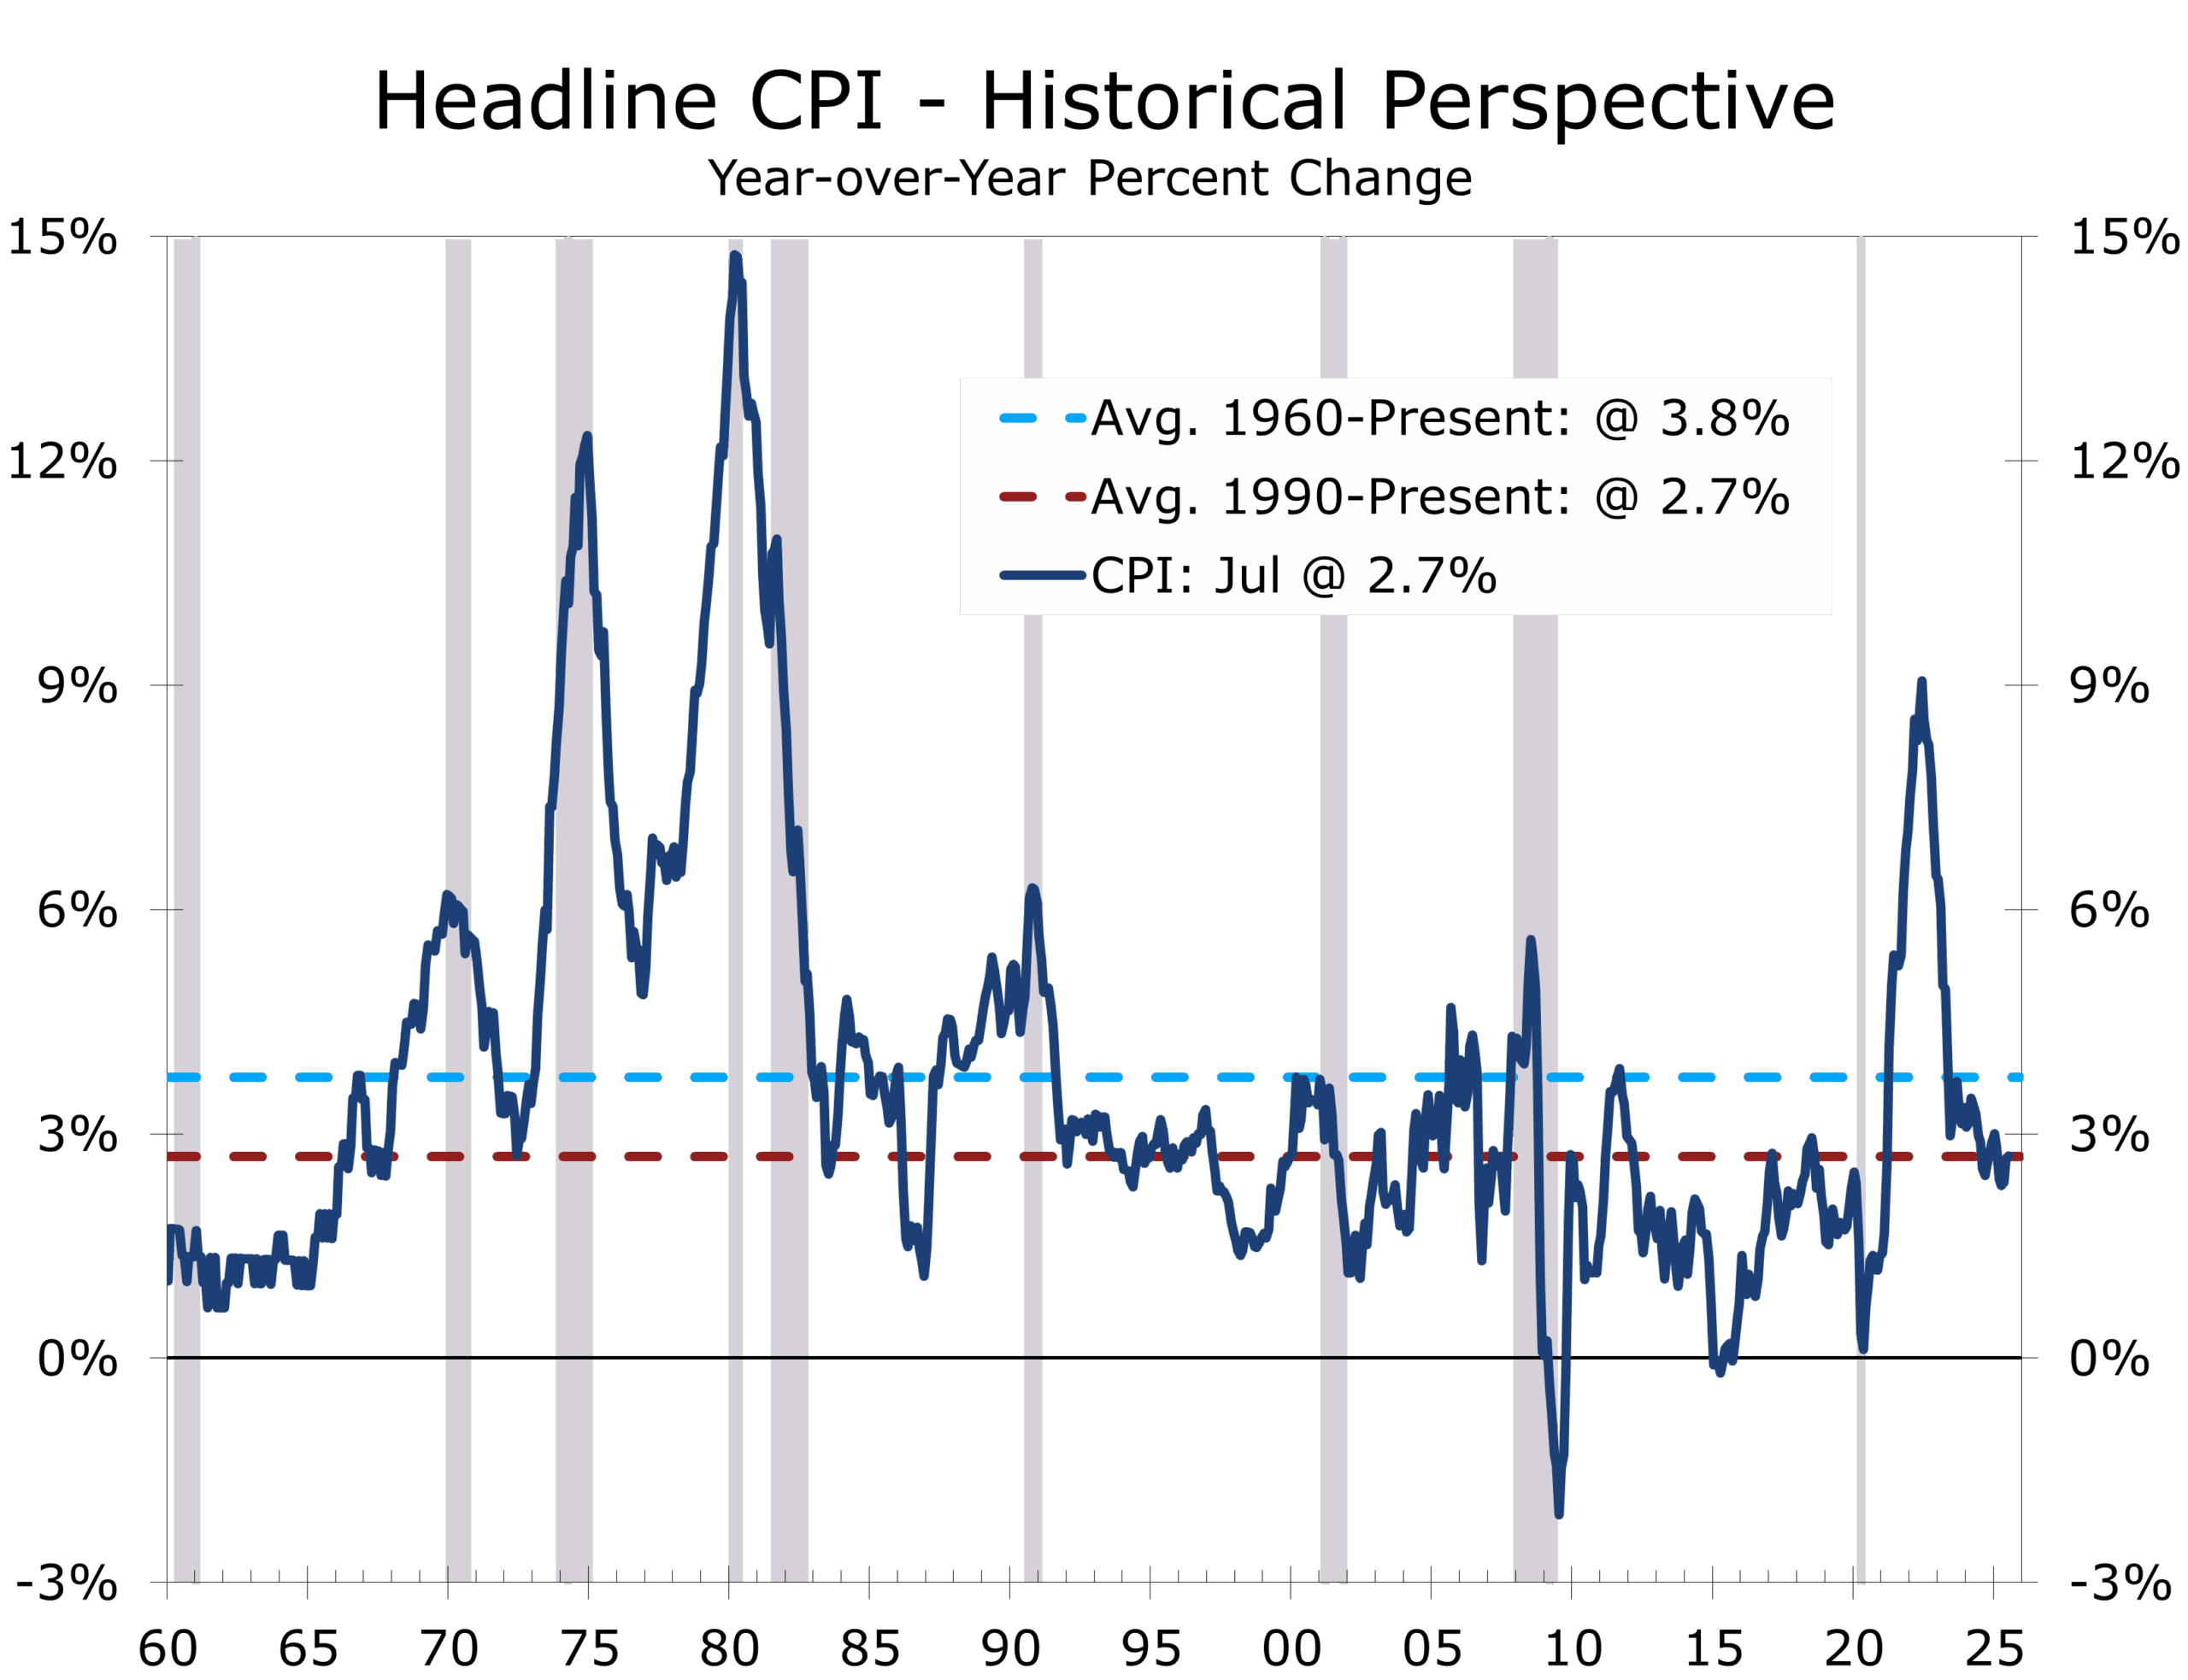
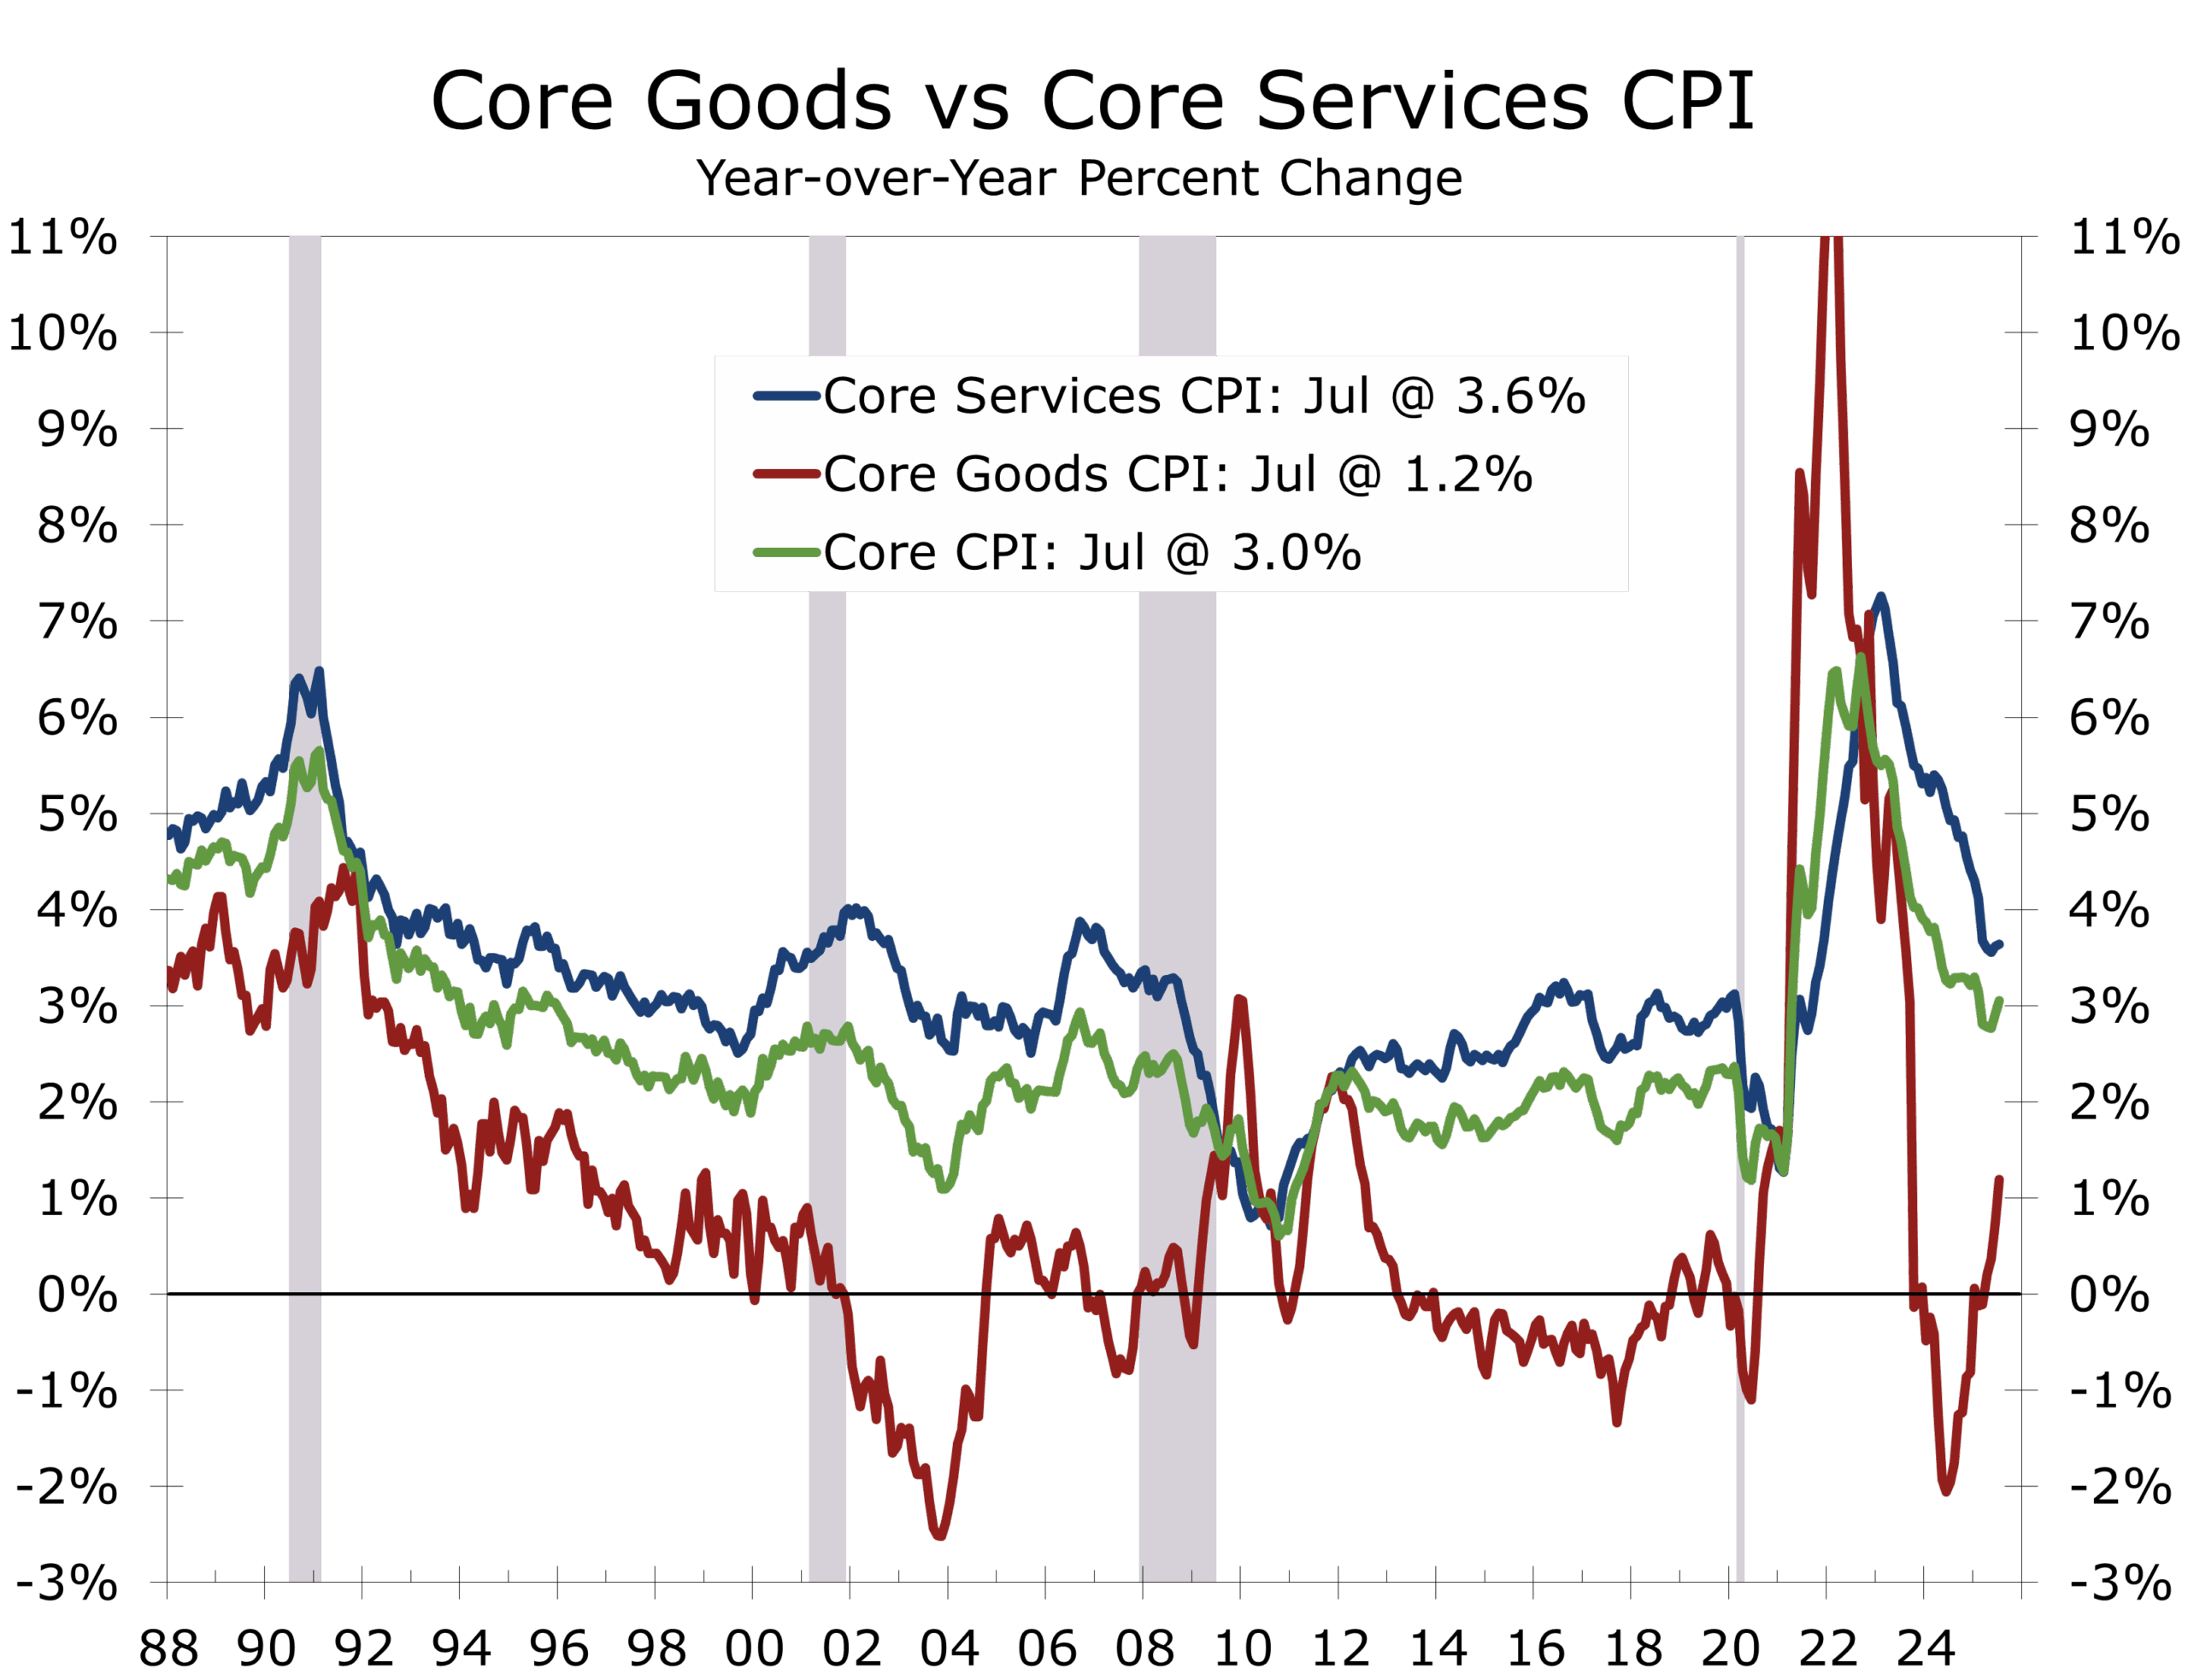
- Year-over-year headline inflation held at 2.7%; core CPI climbed to 3.1% from 2.9%, the largest monthly gain since January.
- Tariff-related price pressures emerged in select goods categories, offsetting declines in energy and lifting the core.
- Shelter moderated to a 0.2% monthly gain, while energy fell 1.1% as gasoline prices dropped 2.2%.
- Food prices were flat: grocery prices fell 0.1%, while dining out costs rose 0.3%.
- Strongest gains came in medical care (+0.7%) and airline fares (+4.0%), while lodging away from home fell 1.0%.
- Market expectations for a September Fed rate cut remain intact following weak July jobs data and steep downward payroll revisions.
- Data quality concerns are growing after budget cuts and partial suspensions in CPI data collection at the Bureau of Labor Statistics (BLS ).
Inflation Moderates Overall, but Core Ticks Higher
U.S. consumer prices increased moderately in July, with headline CPI rising 0.2%—slowing from June’s 0.3% gain—and holding steady at 2.7% year-over-year. The increase was in line with expectations, but the 0.3% rise in core CPI marked its strongest monthly advance since January, lifting the annual rate to 3.1% from 2.9%.
The uptick in core reflected firmer pricing for tariff-affected goods, even as broad inflation pressures remained contained. The three-month annualized pace for core CPI is running near 2.4%, consistent with a gradual convergence toward the Fed’s 2% target.
Tariffs Help Lift Inflation to a Six-Month High as Shelter and Energy Keep Headline CPI Cool.
Energy Drags, Shelter Cools Further
Energy prices fell 1.1% in July, led by a 2.2% decline in gasoline. Natural gas dropped 0.9% and electricity edged down 0.1%. On a year-over-year basis, the energy index is down 1.6%, with gasoline nearly 10% lower and fuel oil off 2.9%.
Shelter costs—which account for roughly 35% of the CPI and about 44% of the core—rose just 0.2%, the slowest monthly gain since early spring. Owners’ equivalent rent and primary rent each rose 0.3%, but lodging away from home fell 1.0%. With market-based rent measures still soft, further deceleration in shelter inflation is likely.
Food Prices Hold Steady
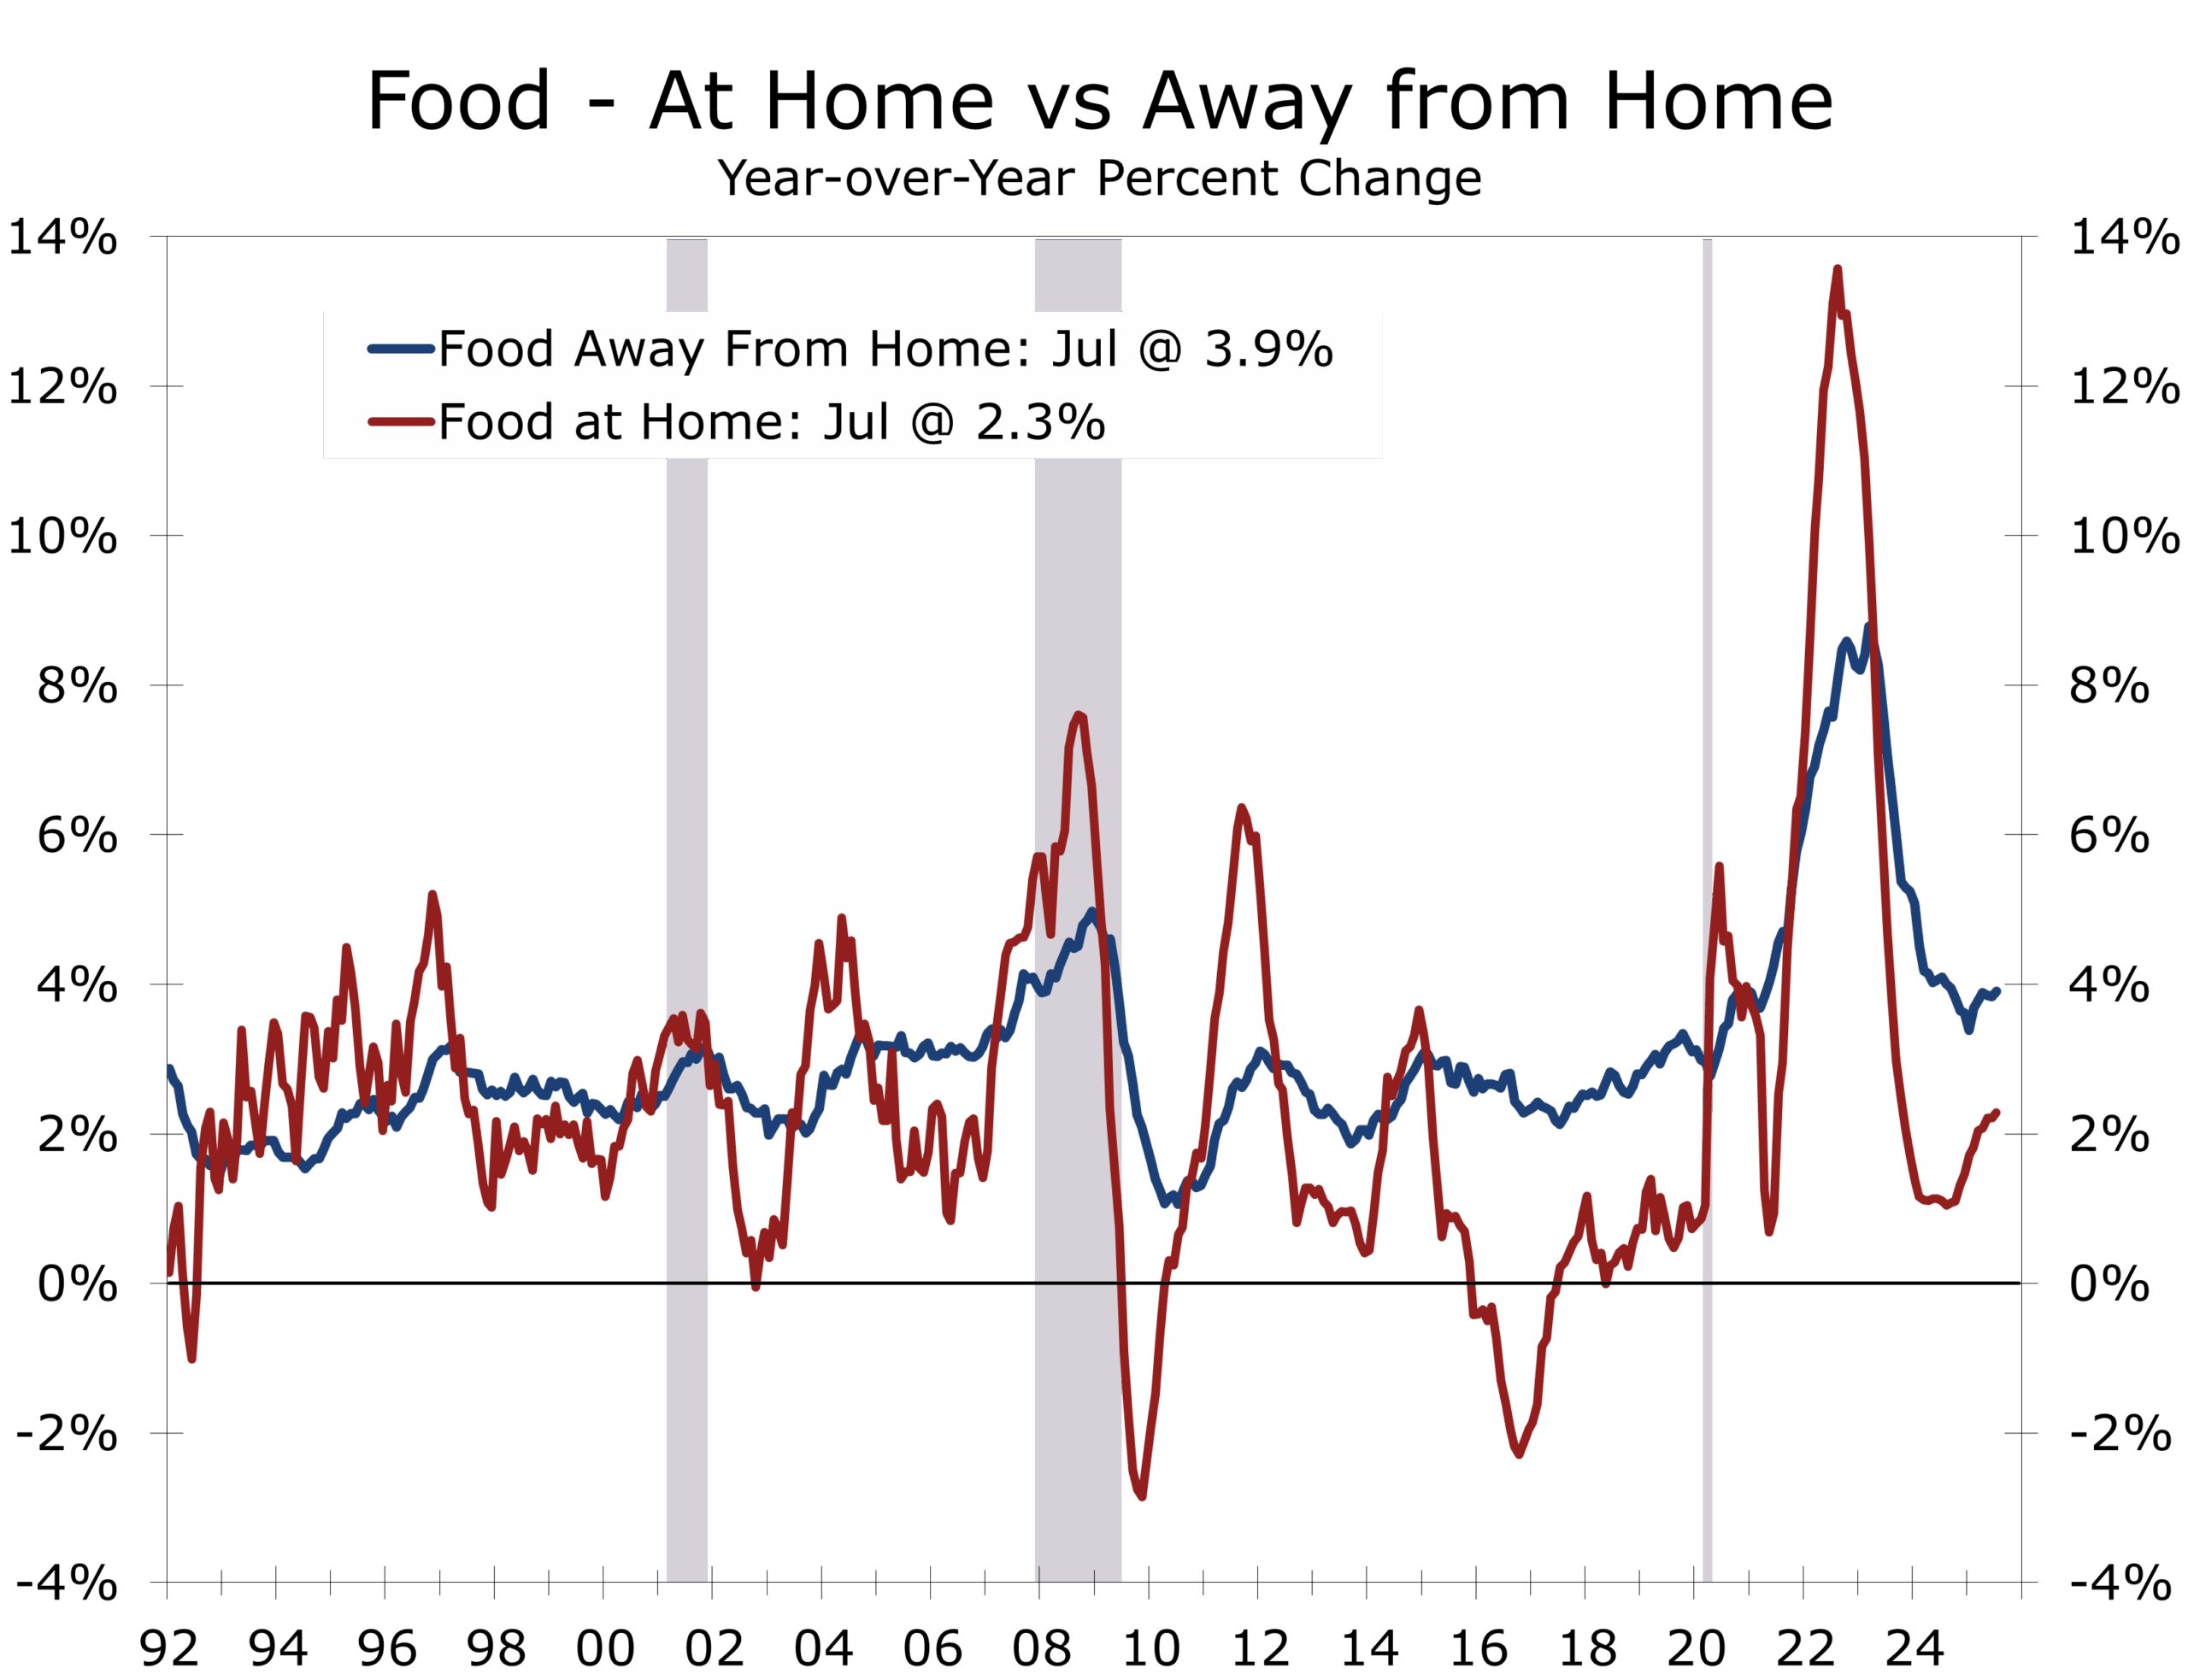
The food index was unchanged in July, ending a two-month streak of 0.3% gains. Grocery prices fell 0.1%, driven by declines in “other food at home” (-0.5%), nonalcoholic beverages (-0.5%), and cereals/bakery (-0.2%). Dairy rose 0.7%, and meats, poultry, fish, and eggs gained 0.2%, though egg prices fell sharply (-3.9%).
Food away from home rose 0.3%, with full-service meals up 0.5% and limited-service meals up just 0.1%. Over the past year, grocery prices are up 2.2% versus a 3.9% gain for restaurant prices. Many chains report tighter margins, as beef and labor costs remain elevated. Price increases are harder to pass through to middle- and lower-income households, as reflected in smaller gains at limited-service restaurants, including fast-food and quick-service outlets.
Flat food prices and limited tariff effects are slightly easing pressure on household budgets.
Tariff Effects: Targeted, Not Broad-Based
Tariff pass-through remains concentrated in a handful of import-heavy sectors, including furniture, linens and curtains, washing machines, and audio equipment. Broad-based effects remain absent. Apparel prices rose just 0.1% in July and have fallen 0.2% over the past year. Men’s apparel is down 0.3% year-over-year, while women’s and girls’ apparel are down 0.8%.
Footwear prices are firming—up 1.4% in July after a 0.7% gain in June—though still just 0.9% higher over the past year. Other core goods were mixed: used cars rose 0.5%, while new vehicles were flat, reflecting affordability concerns.
Core services showed more consistent strength: medical care rose 0.7%, including a 2.6% jump in dental services, and airline fares surged 4.0% after dipping in June. Recreation and household furnishings (including linens and curtains) each rose 0.4%, while communication prices fell 0.3%.
Real Earnings
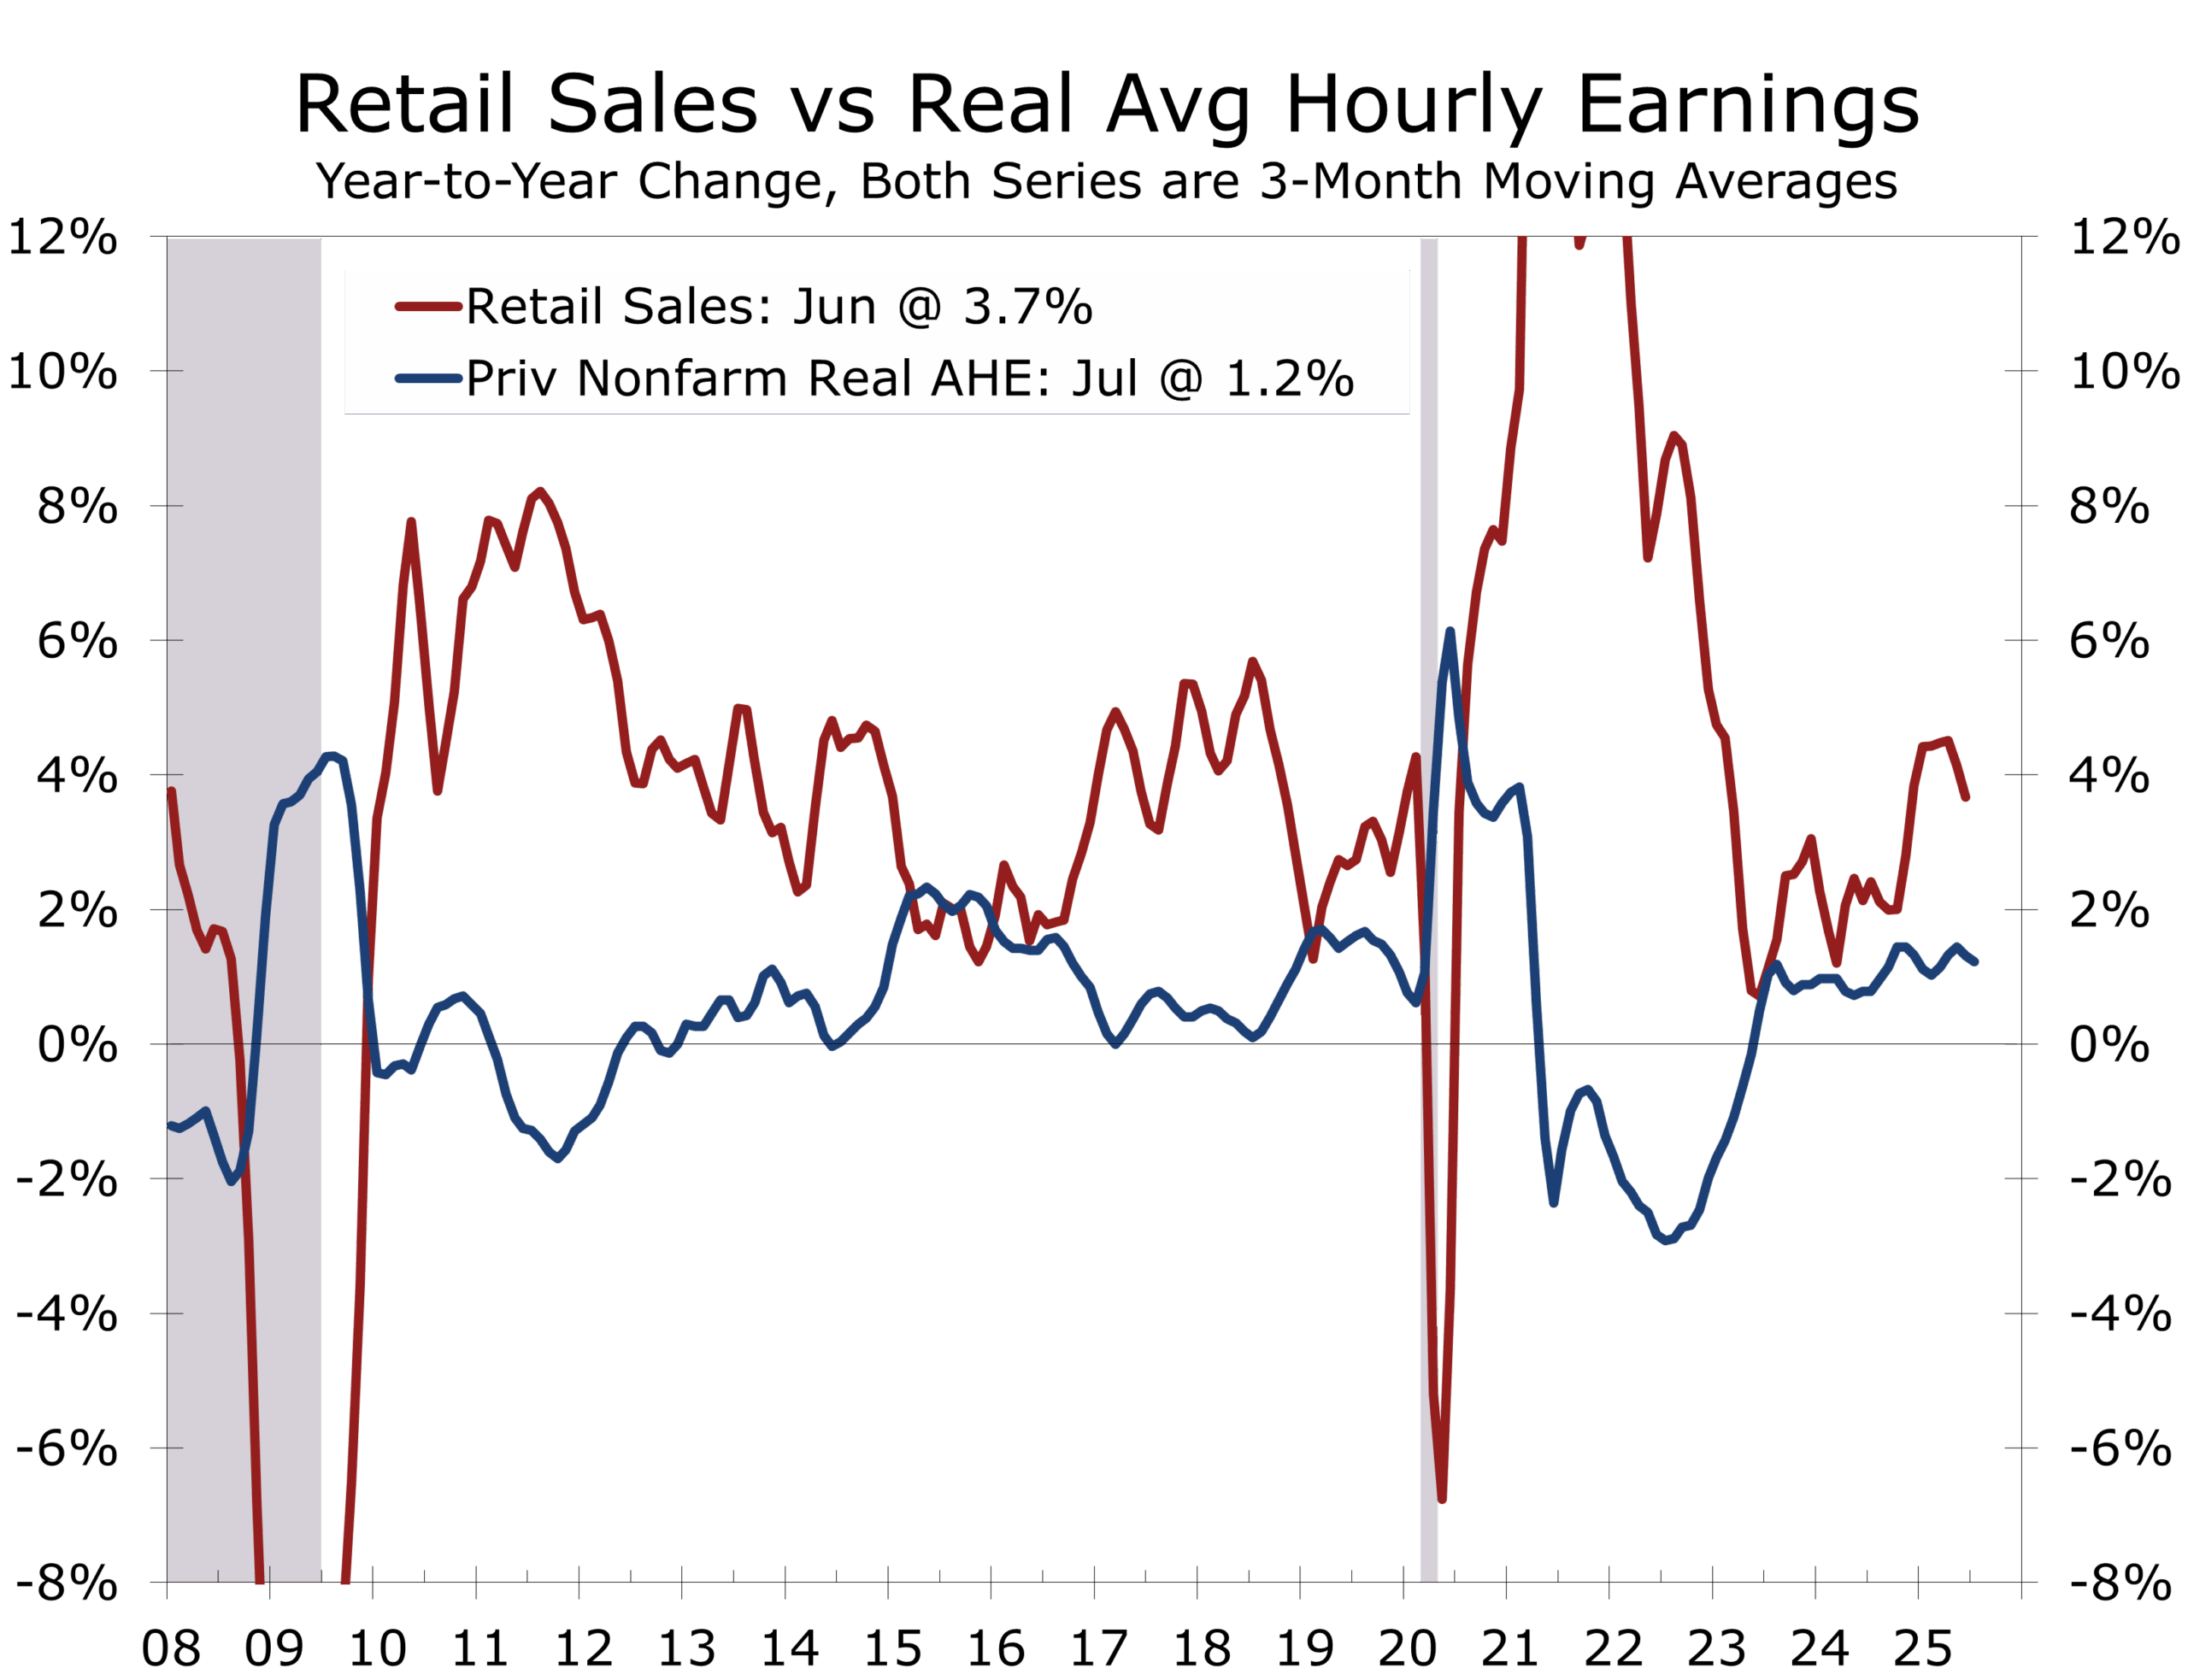
Real average hourly earnings for all employees rose 0.1% in July, reflecting a 0.3% nominal wage increase offset by the 0.2% rise in the CPI-U. Combined with a 0.3% increase in the average workweek, real average weekly earnings rose 0.4% for the month.
From July 2024 to July 2025, real average hourly earnings increased 1.2%, while real average weekly earnings rose 1.4%. Gains were similar for production and nonsupervisory workers, whose real hourly earnings rose 0.1% in July and 1.3% year-over-year.
July’s improvement marks a small but notable rebound from June’s flat real wage performance, suggesting moderating inflation is allowing nominal pay gains to translate into improved household purchasing power—at least in the near term. This is a modest positive for retailers, many of which have seen sales stagnate over the past year.
Policy Outlook: September Cut Still in Play
The July CPI report supports market expectations for a September Fed rate cut, particularly after July’s weak employment report and steep downward payroll revisions. The Fed has held its policy rate at 4.25%–4.50% since December, balancing slowing inflation with a softening labor market.
While headline inflation remains above target, cooling shelter inflation and the absence of broad-based price acceleration give the Fed room to ease without reigniting price pressures. A faster tariff pass-through remains the main upside risk and could slow the pace of easing.

Data Quality Concerns Cloud the Picture
July’s CPI release comes amid mounting concerns over statistical reliability following budget cuts and staffing reductions at the BLS. Earlier this month, President Donald Trump dismissed BLS Commissioner Erika McEntarfer after July’s weak job growth and unusually large downward payroll revisions. Accuracy issues in monthly employment data date back to the pandemic and involve larger-than-usual revisions and wide discrepancies with the more reliable QCEW series.
The BLS has suspended CPI data collection entirely in one city each in Nebraska, Utah, and New York, and reduced collection by roughly 15% in other areas. This affects both goods and housing surveys, forcing greater reliance on imputations to fill gaps. The share of “different cell” imputations—borrowing prices from broader geographic areas—jumped to 35% in June from 8% a year earlier. Economists do not believe these methods systematically bias CPI, but the potential for higher volatility warrants caution in interpreting month-to-month changes.
Disclaimer: This publication has been prepared for informational purposes only and is not intended as a recommendation offer or solicitation with respect to the purchase or sale of any security or other financial product nor does it constitute investment advice.
August 12, 2025
Mark Vitner, Chief Economist
(704) 458-4000