
| Key Concept | Findings |
|---|---|
| Headline CPI | +0.9% MoM in March 2026 — the largest monthly increase in nearly two years, lifting the year-over-year rate to 3.3%, up sharply from 2.4% in February. |
| Energy | Prices surged 10.9%, led by a 21.2% spike in gasoline — the largest single-month jump on record — and accounted for nearly three-quarters of the overall monthly increase. |
| Core CPI | +0.2% MoM (slightly less than expected), holding the annual rate at 2.6%. Core inflation remains stable and consistent with the Fed's disinflation trajectory. |
| Shelter | Rose 0.3%, with rent and owners' equivalent rent advancing at a similar pace. Year-over-year shelter inflation has declined to 3.0%, continuing its gradual cooldown. |
| Food | Flat for the month, with grocery prices declining modestly. Year-over-year food inflation stands at 2.7%, well below peak levels, though cumulative price levels remain approximately 30% above pre-pandemic levels. |
| Policy Signal | The March spike is energy-driven and unlikely to derail the broader disinflation trend. The Fed will focus on core inflation, not volatile headline readings. Rate cuts, if pursued, represent insurance, not stimulus. |
A Headline Surge Driven by Energy, Not Demand
March's CPI report carries a misleading headline. At +0.9% month-over-month — the largest monthly gain in nearly two years — it pushed the year-over-year rate to 3.3%, up sharply from 2.4% in February.
The composition tells a very different story.
Energy prices surged 10.9%, with gasoline alone jumping 21.2% — the largest single-month increase on record for that series and responsible for nearly three-quarters of the total CPI advance.
Strip out energy, and inflation remains well-behaved. The distinction matters. Energy functions as a tax on household budgets and a source of headline volatility, but it does not generate sustained inflation unless it propagates into wages and expectations. Provided the Fed does not accommodate the spike — and there is no indication it intends to — the broader inflation impact should prove modest. Higher gasoline prices simply crowd out spending elsewhere, reducing pricing power across the rest of the economy.

Core Inflation: Steady and Contained
Core CPI rose 0.2% in March, matching February's pace and extending the disinflation trend. At 2.6% year-over-year — roughly in line with the series' long-run average — core inflation is within striking distance of the Federal Reserve's 2% objective.
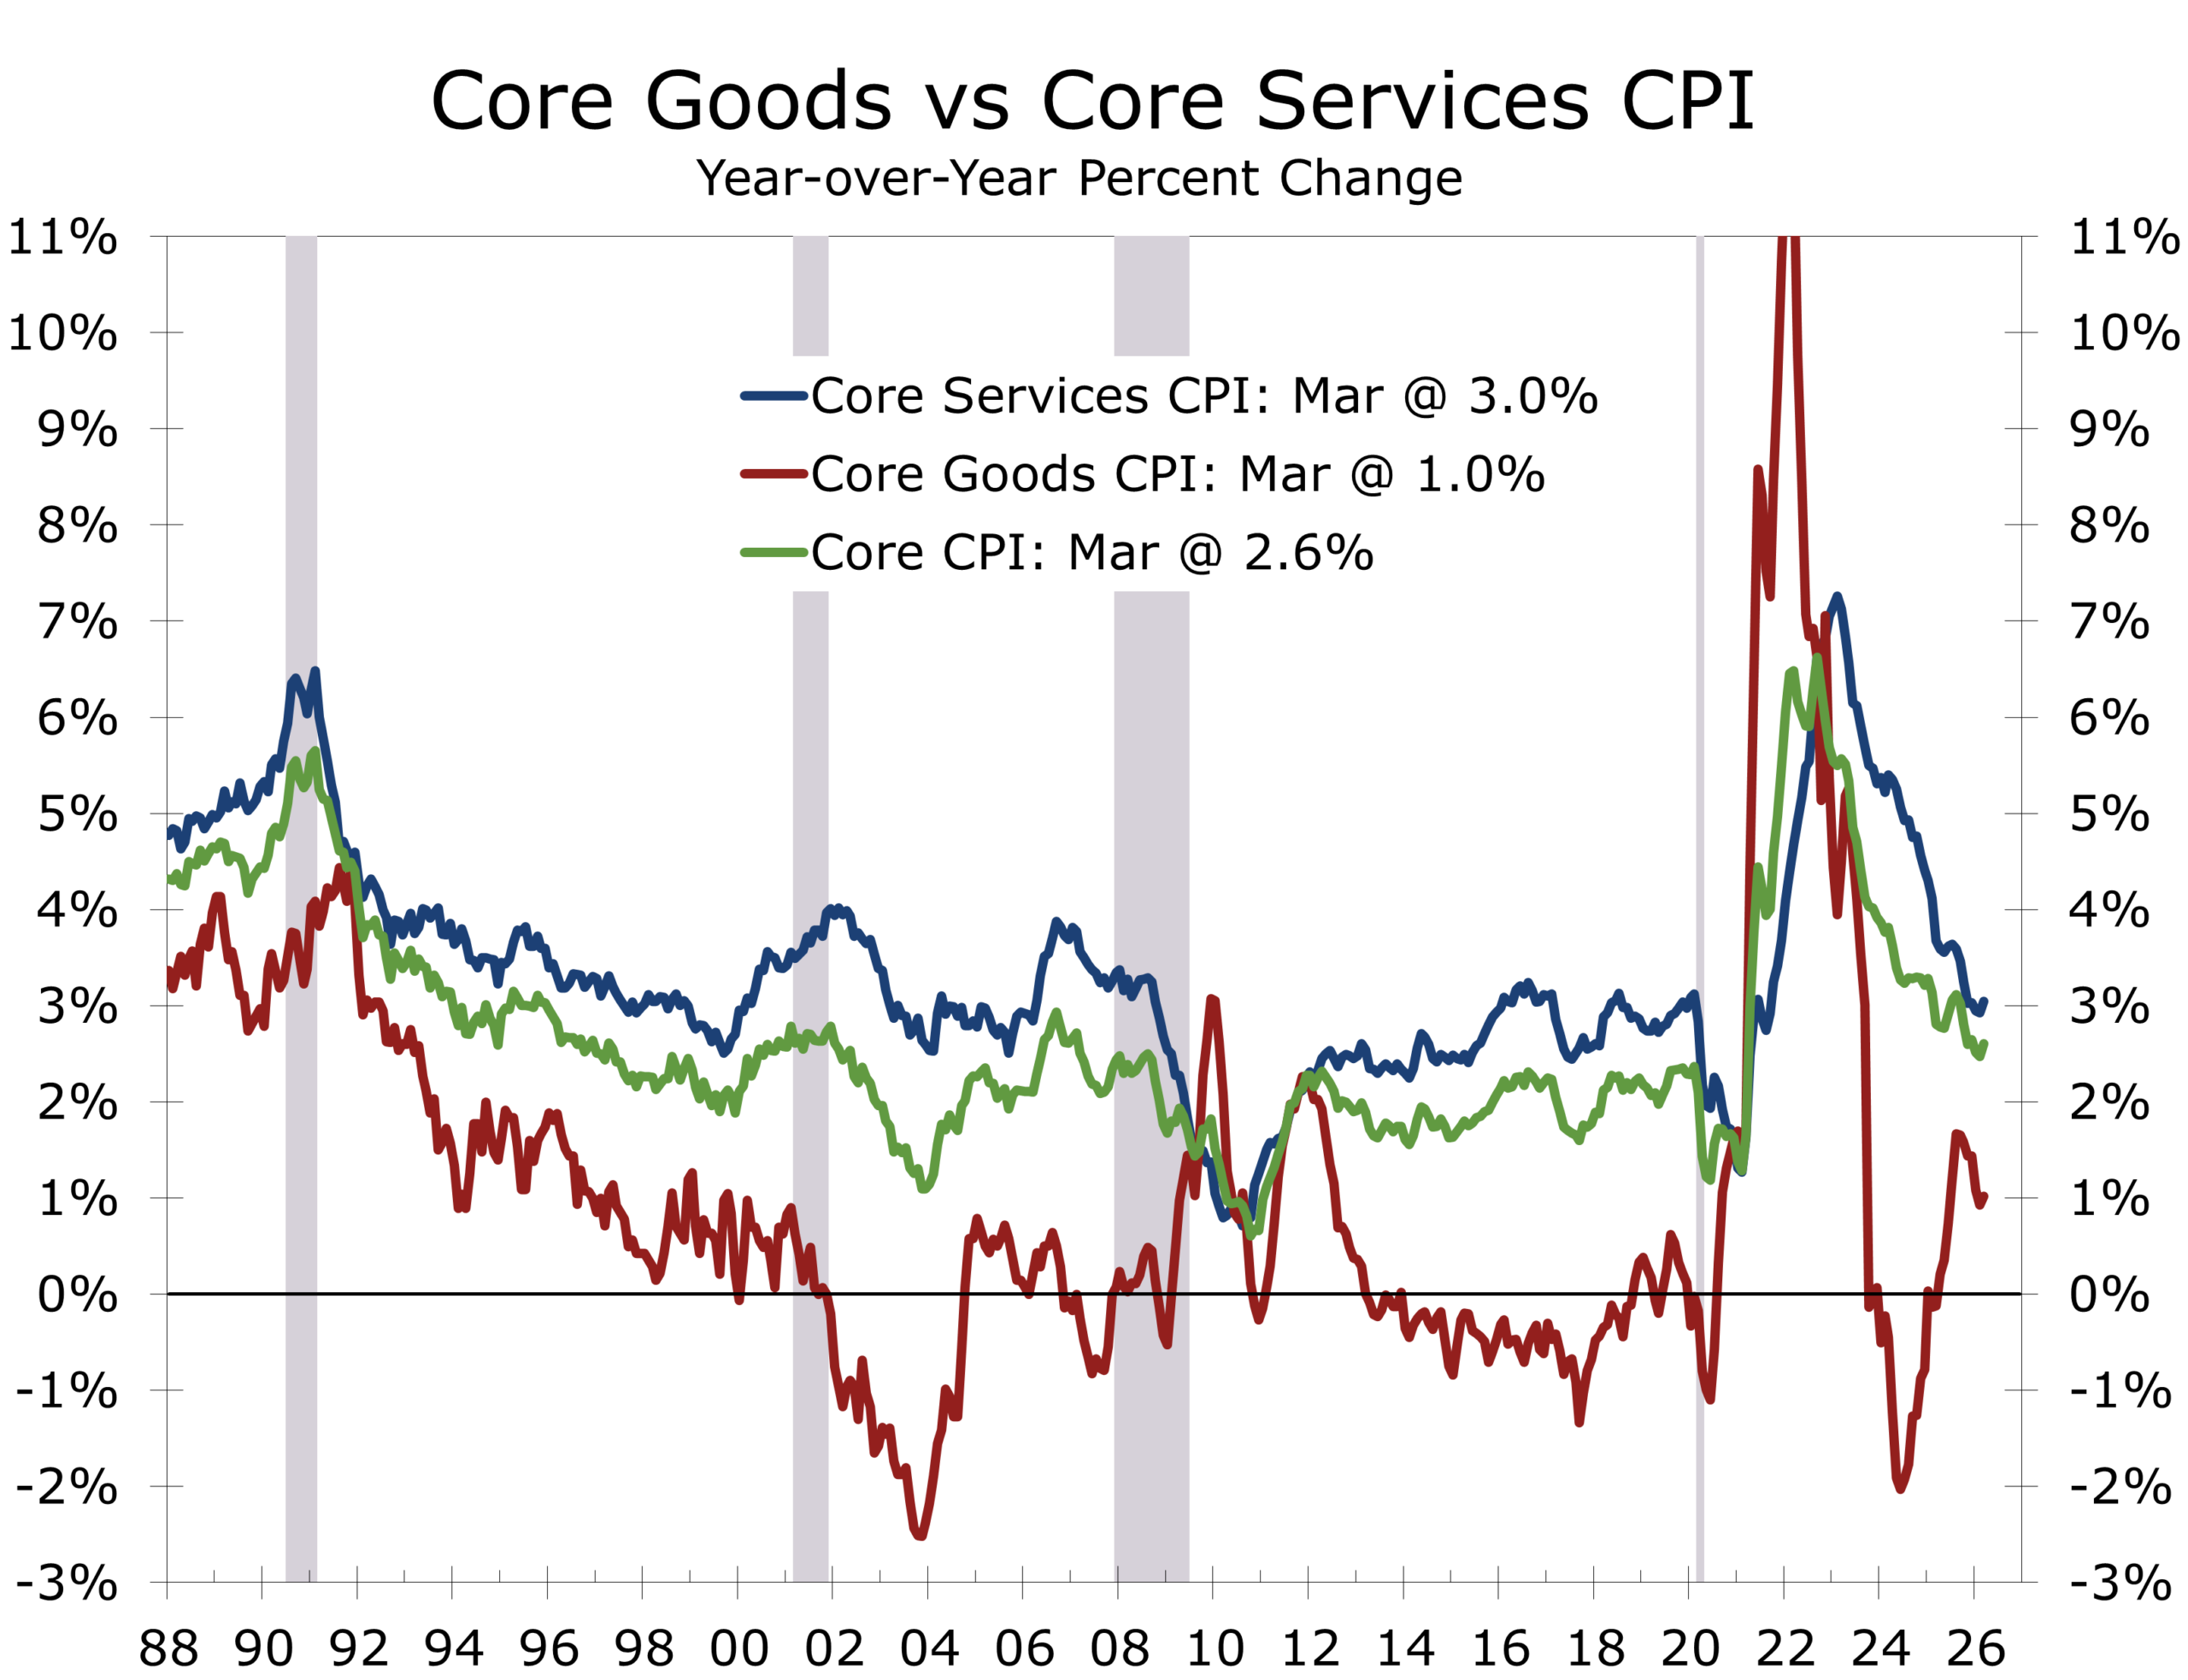
The composition is favorable on balance. Core goods prices continue to deflate — used vehicles fell 0.4% and are down more than 3% year-over-year — and supply chains remain stable. Squeezed household budgets and elevated uncertainty are prompting consumers to defer discretionary purchases, further dampening pricing power across non-energy categories.
Services inflation remains the stickiest element of core, but momentum is fading. Airline fares jumped 2.7%, and education costs edged higher, but medical care prices declined, providing a meaningful offset. The trend within services is one of gradual, uneven moderation.
Full CPI Component Breakdown — March 2026
Sources: U.S. Bureau of Labor Statistics, CPI-U, March 2026 release. All figures seasonally adjusted (MoM); YoY figures non-seasonally adjusted per BLS convention.
| Component | MoM Change | YoY Change |
|---|---|---|
| All Items (Headline) | +0.9% | +3.3% |
| Core CPI (ex-Food & Energy) | +0.2% | +2.6% |
| Energy | +10.9% | +12.5% |
| Gasoline | +21.2% | +15.8% |
| Electricity | +0.9% | +3.6% |
| Fuel Oil | +5.5% | +8.2% |
| Food (All) | 0.0% | +2.7% |
| Food at Home (Grocery) | −0.2% | +2.3% |
| Food Away from Home | +0.3% | +3.4% |
| Shelter | +0.3% | +3.0% |
| Rent of Primary Residence | +0.2% | +3.1% |
| Owners' Equivalent Rent | +0.2% | +3.0% |
| Services (ex-Energy) | +0.3% | +3.8% |
| Airline Fares | +2.7% | +1.4% |
| Medical Care Services | −0.2% | +2.1% |
| Goods (ex-Food & Energy) | −0.1% | −0.4% |
| Used Cars & Trucks | −0.4% | −3.2% |
| Apparel | +0.2% | +1.0% |
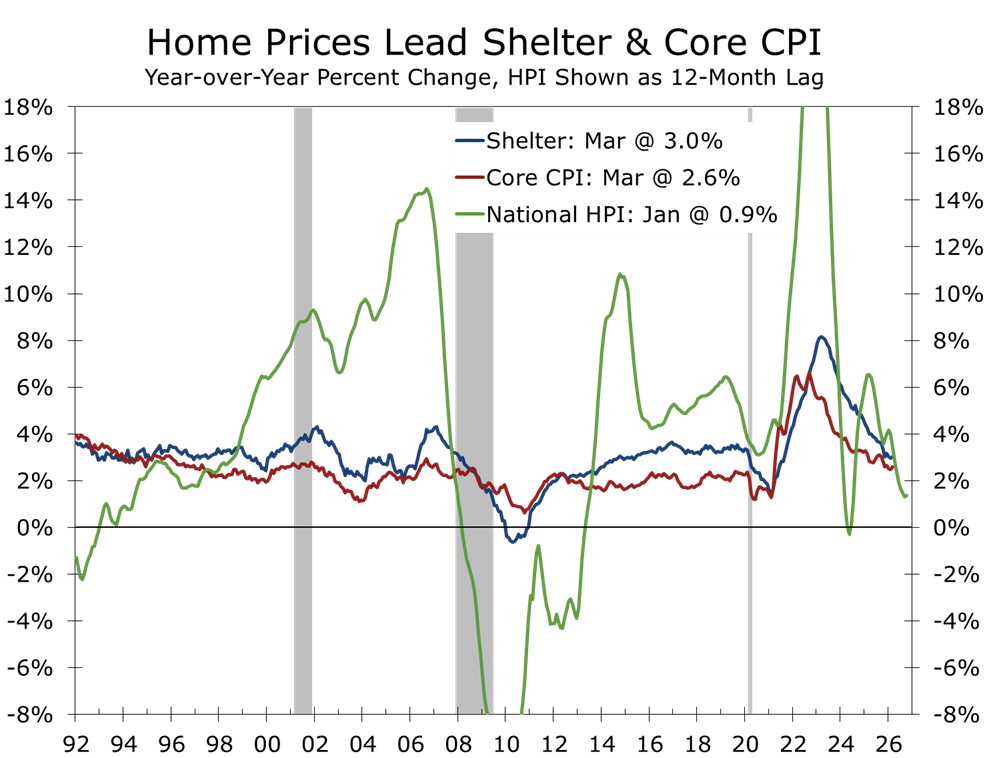
Shelter: Gradual Cooling Continues
Shelter rose 0.3% in March — rent and owners' equivalent rent each up approximately 0.2% — continuing the slow but durable deceleration from the 8%-plus peaks reached in 2023.
The underlying drivers remain intact. Market rents have softened across many regions, particularly in areas with elevated multifamily supply. Demand for rental apartments remains strong but has lost some momentum over the past year, reflecting the slowdown in job growth. Home price appreciation has slowed, and affordability constraints are limiting upward pressure on housing costs. Home prices feed into shelter costs with a long lag, so the recent improvement has more room to go.
Given shelter's outsized weight in CPI — roughly one-third of the overall index and 44% of the core CPI — this gradual cooling remains central to the broader disinflation narrative. While it may seem counterintuitive given long-running affordability challenges, the moderation in home price appreciation and rents will likely continue to be a potent force for disinflation over the next year to 18 months.
Food: Stable, With Relief at the Grocery Store
Food prices were unchanged in March, with grocery prices falling 0.2%. Declines were broad-based, including meats, cereals, and dairy products. Restaurant prices rose modestly, reflecting ongoing wage pressures in food services.
On a year-over-year basis, food inflation stands at 2.7%, well below peak levels. However, the cumulative burden remains significant: grocery prices are still roughly 30% higher than they were prior to the pandemic, continuing to shape consumer sentiment more broadly.
Energy: Volatility Returns
Energy prices rose sharply in March, reversing the disinflationary contribution seen earlier in the year. Gasoline surged 21.2% — the largest monthly jump on record for that series — fuel oil spiked, and electricity rose modestly.
On a year-over-year basis, energy inflation now stands at 12.5%, reintroducing meaningful volatility into the inflation outlook. The geopolitical backdrop — including the U.S./Israel war with Iran and its attendant supply disruptions — is the proximate driver.
Supply-driven energy shocks have historically proven transitory absent a sustained geopolitical disruption or a policy accommodation error. The U.S. economy is substantially less energy-intensive today than in the 1970s, and the Federal Reserve's commitment to price stability is considerably more credible. We do not expect the current energy spike to upend the longer-run disinflation trend, which remains clearly evident in core CPI and core services.
Inflation Is Narrowing, Not Reaccelerating
The March data reinforce a structural shift that has been building for over a year. The broad-based price pressure that defined the 2021–2022 inflation episode has given way to a far more concentrated pattern of price increases.
Energy is volatile. Goods prices are soft. Shelter is easing. Services remain the primary area of persistence, but even there, momentum is slowing as wage growth moderates and post-pandemic normalization runs its course.
Inflation is narrowing to fewer categories, and the categories still showing persistence are moderating. March should be read as a temporary deviation from a declining trend, not a reversal of it.
Policy Implications: Look Through the Noise
The operative question for the FOMC is whether to respond to the headline or the underlying trend. The data argue clearly for the latter. Core inflation is contained. Disinflation is proceeding. There is no evidence of a demand-driven resurgence.
Energy shocks do not ordinarily warrant a monetary policy response unless they trigger second-round effects in wages and inflation expectations. Neither dynamic is currently present. Five-year breakeven inflation rates have edged higher but remain well-anchored relative to 2022 levels, and wage growth is decelerating on trend.
The underlying economy remains two-speed. Structural investment in AI, defense, pharmaceuticals, and aerospace continues to support growth, while rate-sensitive sectors — housing, consumer durables, and small business formation — remain under pressure. Given the well-established lags in monetary policy transmission, the case for easing rests on cyclical support, not inflation containment.
Perspectives from Piedmont Crescent Capital
The following views represent our current assessment of the inflation landscape and its implications for monetary policy and portfolio positioning.
Bottom Line: Noisy but Not Alarming
March's CPI headline is louder than the signal it carries. The 0.9% monthly surge was driven almost entirely by the largest single-month gasoline price increase on record — a geopolitical supply shock, not a reflection of reaccelerating domestic demand.
Beneath the headline, the inflation landscape is constructive. Core CPI held at 2.6%. Shelter is decelerating. Food prices are flat. Goods deflation is broadening. The Federal Reserve's preferred inflation gauges have not materially deteriorated.
Energy is driving the noise, not the narrative. The disinflation trend remains intact. Policymakers and investors should resist the temptation to overreact to a print that should look considerably better in 60 to 90 days as the energy base effect fades.
Key Data Releases to Monitor
April 30 — Q1 Employment Cost Index
The single most important wage data point for the Fed's reaction function. Will clarify whether wage growth is decelerating on schedule.
April 30 — March PCE Deflator
Should rise less dramatically than the CPI — likely +0.6% to +0.7% — but will still register the energy shock. Core PCE should align with core CPI given moderation in medical care.
May 6–7 — Federal Reserve FOMC Meeting
Will clarify the Committee's intended posture: look through the energy spike (our base case), or lean gently against it. An outright policy response to energy-driven headline inflation would, in our view, be a policy error.
May 13 — April CPI
First test of whether energy prices are stabilizing or intensifying. The critical read for confirming the transitory thesis.
May 15 — April Retail Sales
Will show whether the energy shock has meaningfully curtailed discretionary spending.
(704) 458-4000
Full report — 8 pages, includes all charts & data tables