
Homebuilding Settles In for a Cold Winter
Starts rebounded 9.9% in October, but permits fell 7.4% on a broad base of declines and builder confidence dropped to 25, its lowest reading since April 2012. Mortgage rates have eased from their October peak, yet costs, labor shortages and hesitant buyers are keeping builders on the defensive.
Early Signal
- Starts rebounded in October, but the gain is less solid than it looks. Starts rose 9.9% to a seasonally adjusted annual rate of 1,309,000, from a September rate that was revised down to 1,191,000 from 1,221,000. The Census Bureau’s margin of error on the monthly change is ±16.8%, so the change is not statistically significant. Starts are 2.8% above a year ago, also not significant, and the three-month average of 1,260,000 is the lowest of any three-month period in the past year.
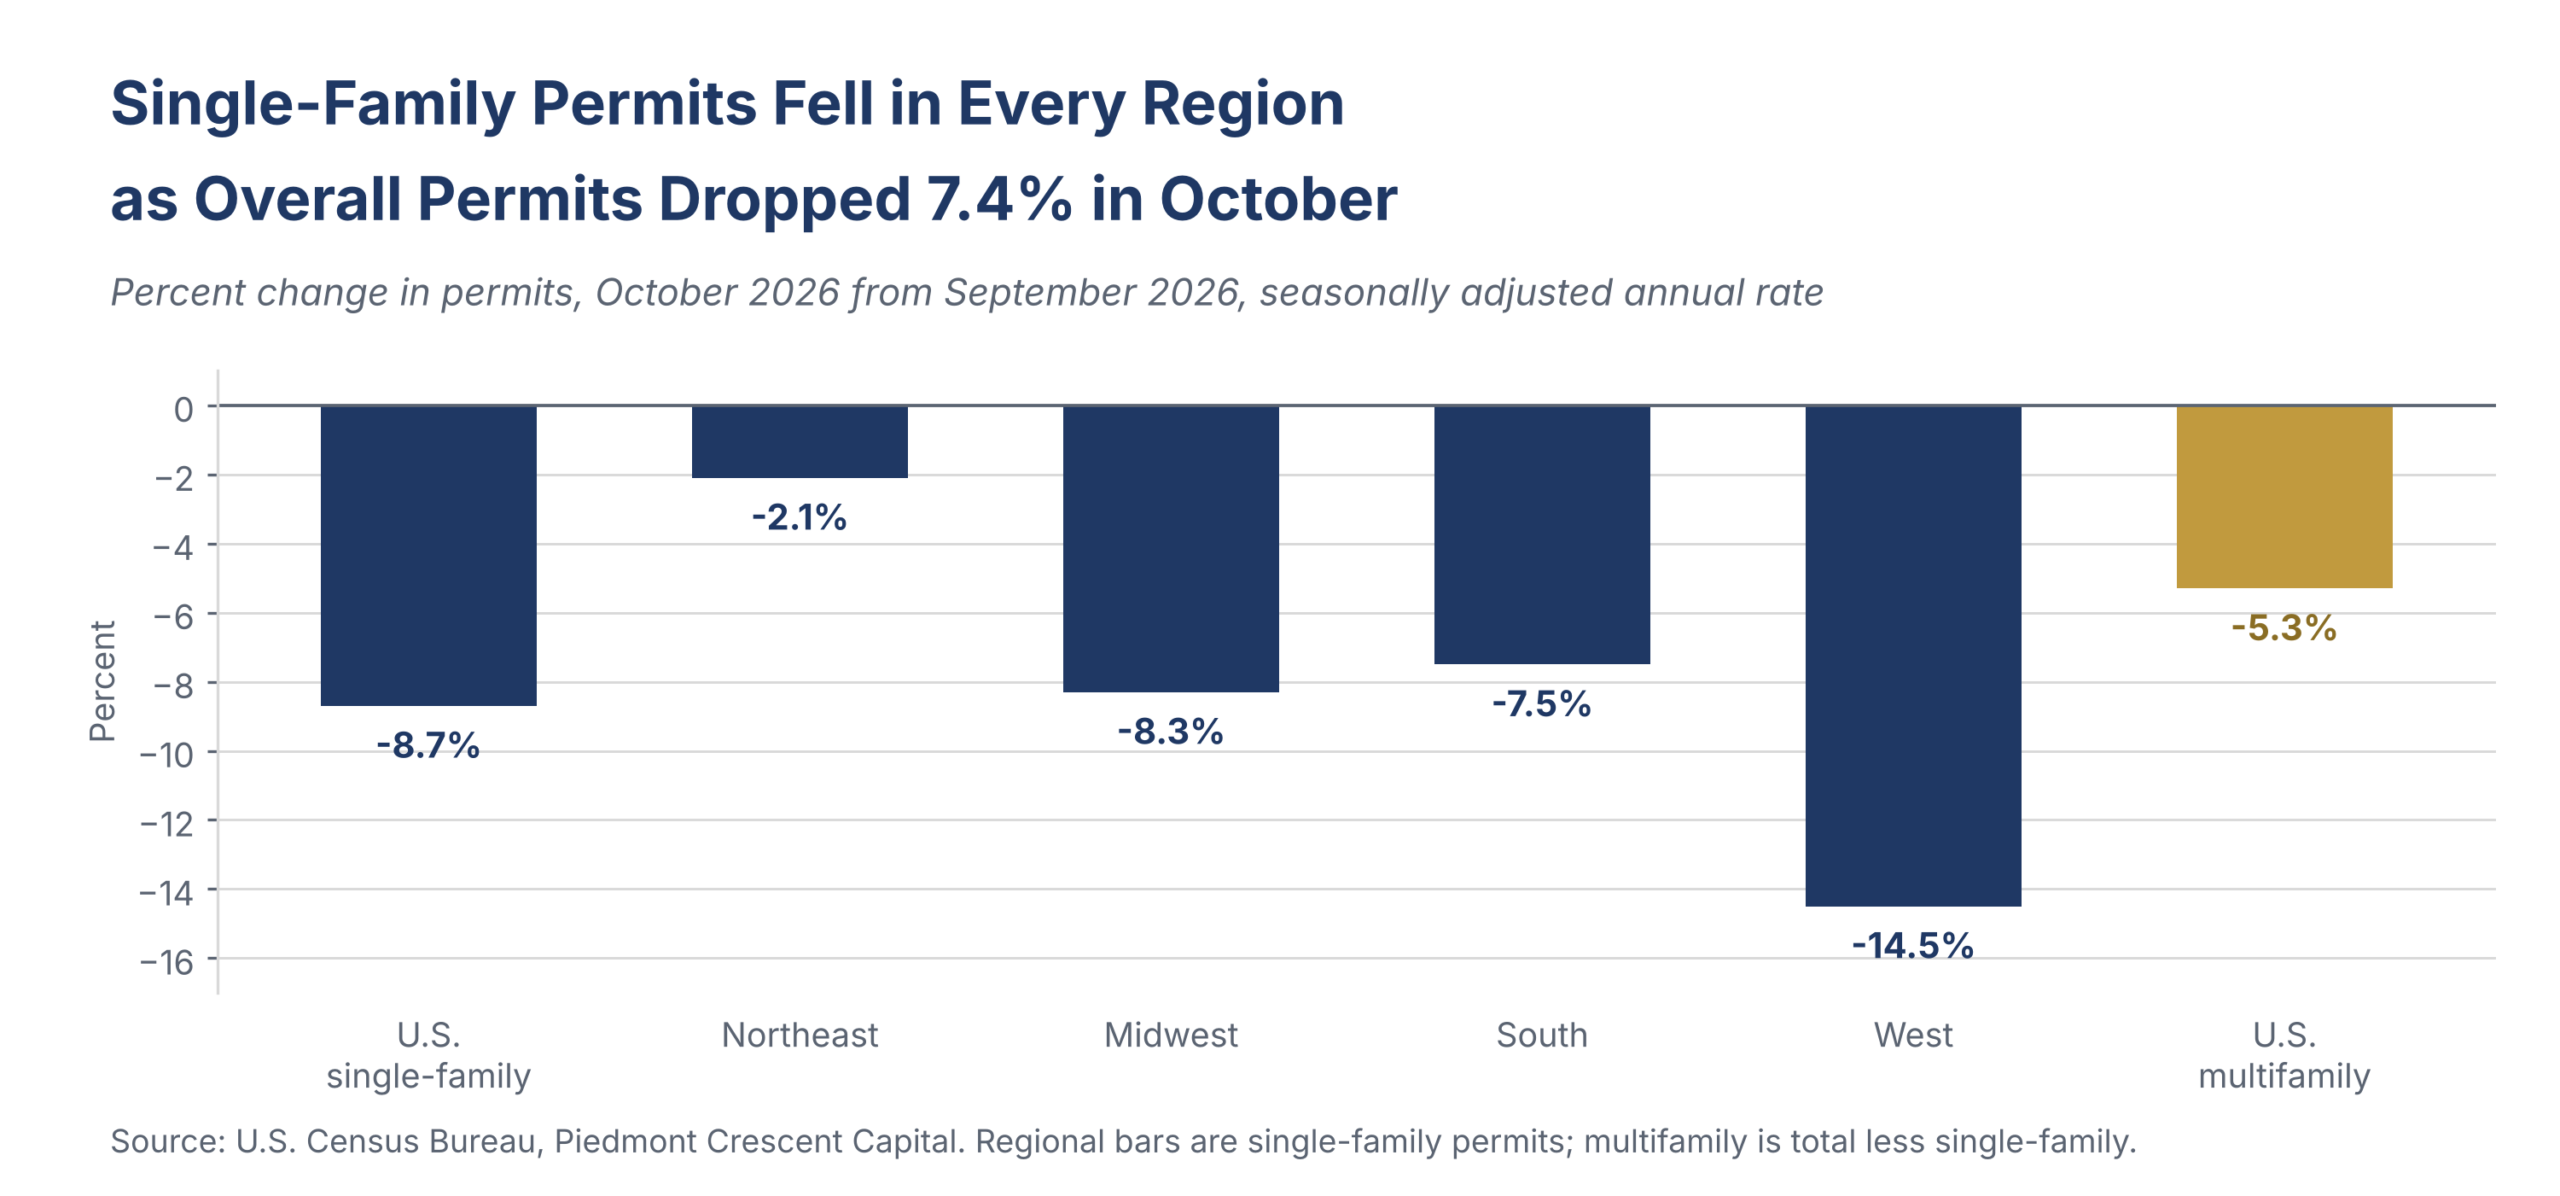
- Permits fell sharply and across the board. Permits dropped 7.4% in October to 1,295,000, the lowest reading in the past year, and are 8.7% below a year ago. Single-family permits fell 8.7% to 772,000, and multifamily permits fell 5.3% to 523,000. Total permits fell in three of the four regions, and single-family permits fell in all four, led by the West (-14.5%), the Midwest (-8.3%) and the South (-7.5%).
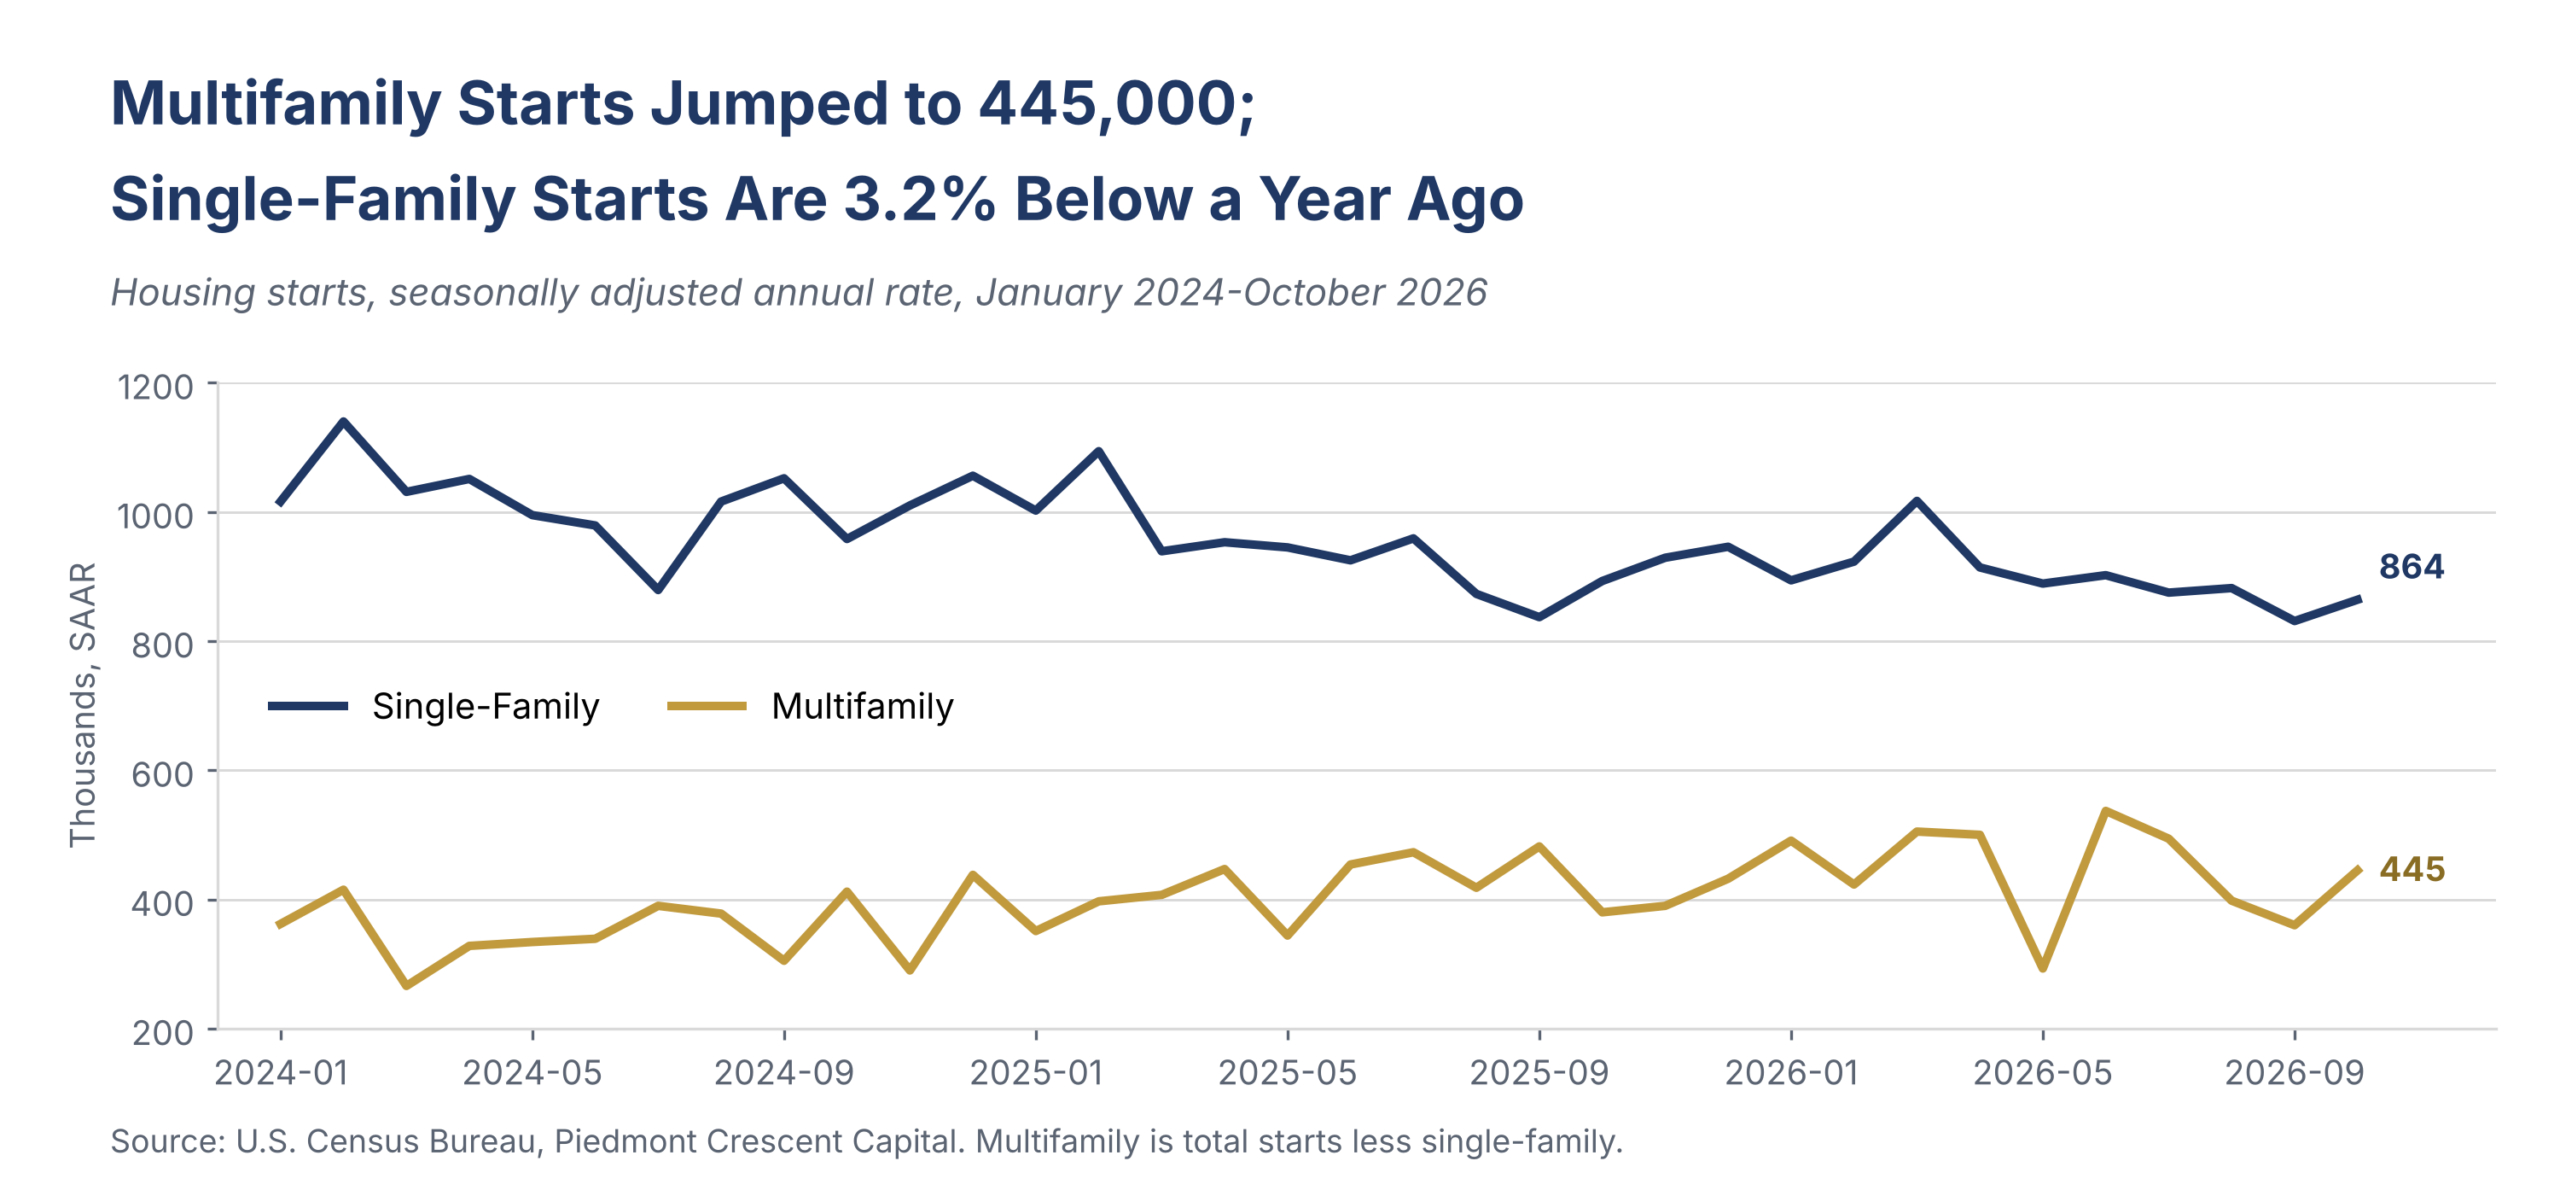
- Single-family starts are running well ahead of single-family permits, which argues for a pullback. Single-family starts rose 4.0% to 864,000 and are 3.2% below a year ago, with the year-to-date total 4.6% below last year’s pace. Single-family permits of 772,000 sit 92,000 units below starts, the widest gap this year apart from March, and permits lead starts.
- The jump in multifamily starts is not a reliable signal. Multifamily starts, which we calculate as total starts less single-family, rose to 445,000 from 360,000 and account for most of the October rebound, but we do not trust the jump. Few multifamily projects are moving forward outside a handful of markets, mostly in the South and the Carolinas, and at activity levels this low a small change in the non-seasonally-adjusted count becomes a large swing once it is seasonally adjusted. Census’s own five-units-or-more category rose 25.5% with a margin of error of ±50.6%, and multifamily permits fell 5.3% in the same report.
- Builder confidence fell four points to 25, the lowest since April 2012. The NAHB/Wells Fargo Housing Market Index, released November 17, fell in all three components: present sales fell six points to 28, six-month expectations fell two points to 30, and buyer traffic fell two points to 16, its lowest reading in 15 years outside the start of the pandemic. The index has been below the break-even level of 50 for 31 consecutive months.
- Builders are cutting prices and offering incentives at post-Covid highs. NAHB reports that 46% of builders cut prices in November, the highest share since the pandemic, with the average cut holding at 6% for an eighth straight month. Some 68% offered sales incentives, also a post-Covid high, and at least 60% of builders have used incentives for 20 consecutive months.
- Builder sentiment fell even as mortgage rates eased. Freddie Mac’s 30-year fixed rate averaged 7.11% in the week of November 12, its fourth straight weekly decline from 7.40% on October 15. NAHB’s chairman and chief economist cited labor shortages, higher fuel costs passed through by subcontractors, tariff-driven material costs and mortgage rates that are still above 7%.
- Completions rose in October but are still well below last year’s pace. Completions rose 6.5% to 1,272,000 and are 10.4% below a year ago. Year to date, completions are down 12.3%, with single-family completions down 10.7% and multifamily completions down 15.4%.
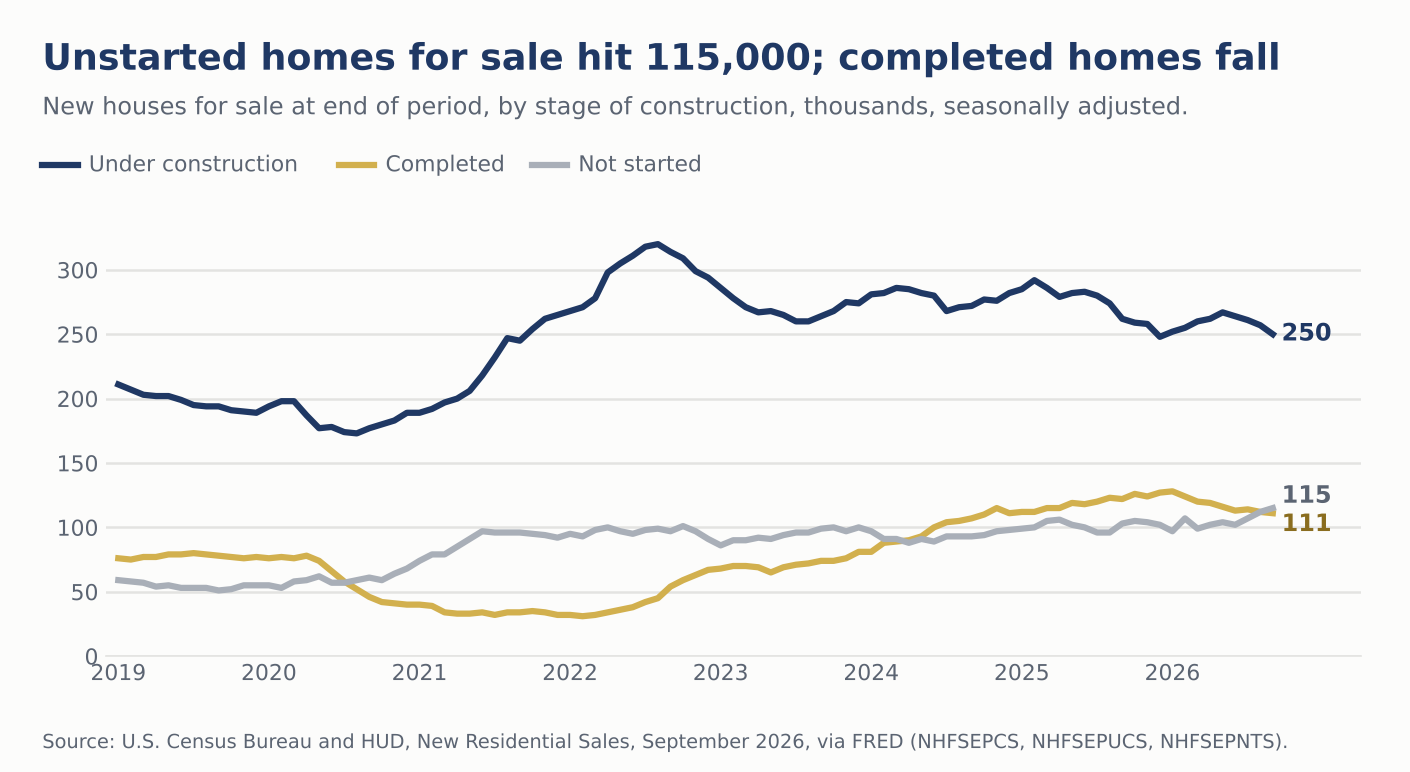
- New home sales held up in September, but they were signed before rates peaked. New home sales were 676,000 in September, 5.3% below a year ago, and months’ supply is 8.4. Homes for sale that have not been started rose to 115,000, the most since at least 2019, while completed homes for sale fell 9.0% from a year ago to 111,000. October’s sales report, due November 25, is the first that falls fully inside the higher-rate period.
The Rebound and the Mix
The October rebound looks less solid than the headline suggests. The 9.9% gain follows a September estimate that was revised down by 30,000 units, which flatters the monthly comparison, and the Census Bureau’s margin of error on the change, ±16.8%, is wider than the change itself. October’s 1,309,000 is only a little above August’s 1,280,000, and the three-month average of 1,260,000 is the lowest of any three-month period in the past year.
The composition tells a similar story. Single-family starts rose 4.0% to 864,000, but they are 3.2% below a year ago, and the first ten months of the year are running 4.6% below last year’s pace. Multifamily starts, which we calculate as total starts less single-family, rose to 445,000 from 360,000, and that jump accounts for most of the rebound. We would not read it as the start of a recovery. Our regular conversations with apartment developers tell us that few projects are moving forward outside a handful of markets, and most of those are in the South, particularly the Carolinas, where demand is strong but vacancy rates are high because new supply is outpacing demand. When activity is this thin, a small change in the non-seasonally-adjusted data can produce an outsized gain after seasonal adjustment. Census’s own figure for buildings with five or more units rose 25.5% in October with a margin of error of ±50.6%, and multifamily permits fell 5.3% in the same report, which points the other way. The year-to-date comparisons in this report use the non-seasonally-adjusted sum for January through October against the same ten months of 2025, and on that basis multifamily starts are 6.7% ahead of last year’s weak pace.
The rebound also came from the places where starts are least reliable. Total starts rose 48.4% in the Midwest and 10.5% in the South, while the Northeast fell 20.8% and the West slipped 2.6%, but regional starts swing too much from month to month to read on their own, and the Midwest figure carries a margin of error of nearly 50 percentage points. For geography we rely on permits.
Permits and the Regional Split
Permits are the part of this release that points to a cold winter. Total permits fell 7.4% in October to 1,295,000 and are 8.7% below a year ago. Single-family permits fell 8.7% to 772,000, multifamily permits fell 5.3% to 523,000, and single-family permits fell in every region, with the largest decline in the West (14.5%), followed by the Midwest (8.3%) and the South (7.5%). Total permits rose only in the Midwest (0.5%), on a gain in multifamily. Census notes that the permit figures in its Table 1 are not subject to sampling error, which is one reason we place more weight on them than on starts.
The gap between starts and permits adds to the concern. Single-family starts of 864,000 are 92,000 units above single-family permits of 772,000. In every month this year except March and October, the two were within about 35,000 units of each other, and single-family starts fell back in April after March’s gap. Permits lead starts, and a gap this wide argues for lower single-family starts in the coming months.
The table below shows single-family permits by region for October, the change from September and from a year earlier, and the change for the year to date.
| Region | Oct. SF permits (SAAR) | Change from Sept. | Change from Oct. 2025 | Year to date (NSA) |
|---|---|---|---|---|
| Northeast | 47,000 | -2.1% | -19.0% | -11.7% |
| Midwest | 111,000 | -8.3% | -9.8% | -0.5% |
| South | 466,000 | -7.5% | -9.7% | -3.0% |
| West | 148,000 | -14.5% | -21.7% | -7.6% |
| United States | 772,000 | -8.7% | -12.9% | -4.2% |
Source: U.S. Census Bureau, Piedmont Crescent Capital. October figures are seasonally adjusted annual rates. Year to date is the non-seasonally-adjusted sum for January through October 2026 compared with the same period of 2025.
The year-to-date comparison shows the same geography we found in earlier editions, with the Northeast (-11.7%) and West (-7.6%) contracting most, the South down 3.0% and the Midwest essentially flat. October’s drop was different in one respect, because it reached the Midwest and the South, the two relatively more affordable regions, which had been holding up. The Northeast’s permit base is small, at 47,000 units at an annual rate, so a change of a few thousand units moves its percentage change by a large amount.
Builder Sentiment
Builder confidence in the market for newly built single-family homes fell four points to 25 in November, according to the NAHB/Wells Fargo Housing Market Index released November 17. That is the lowest reading since April 2012, and it is the 31st consecutive month below the break-even level of 50.
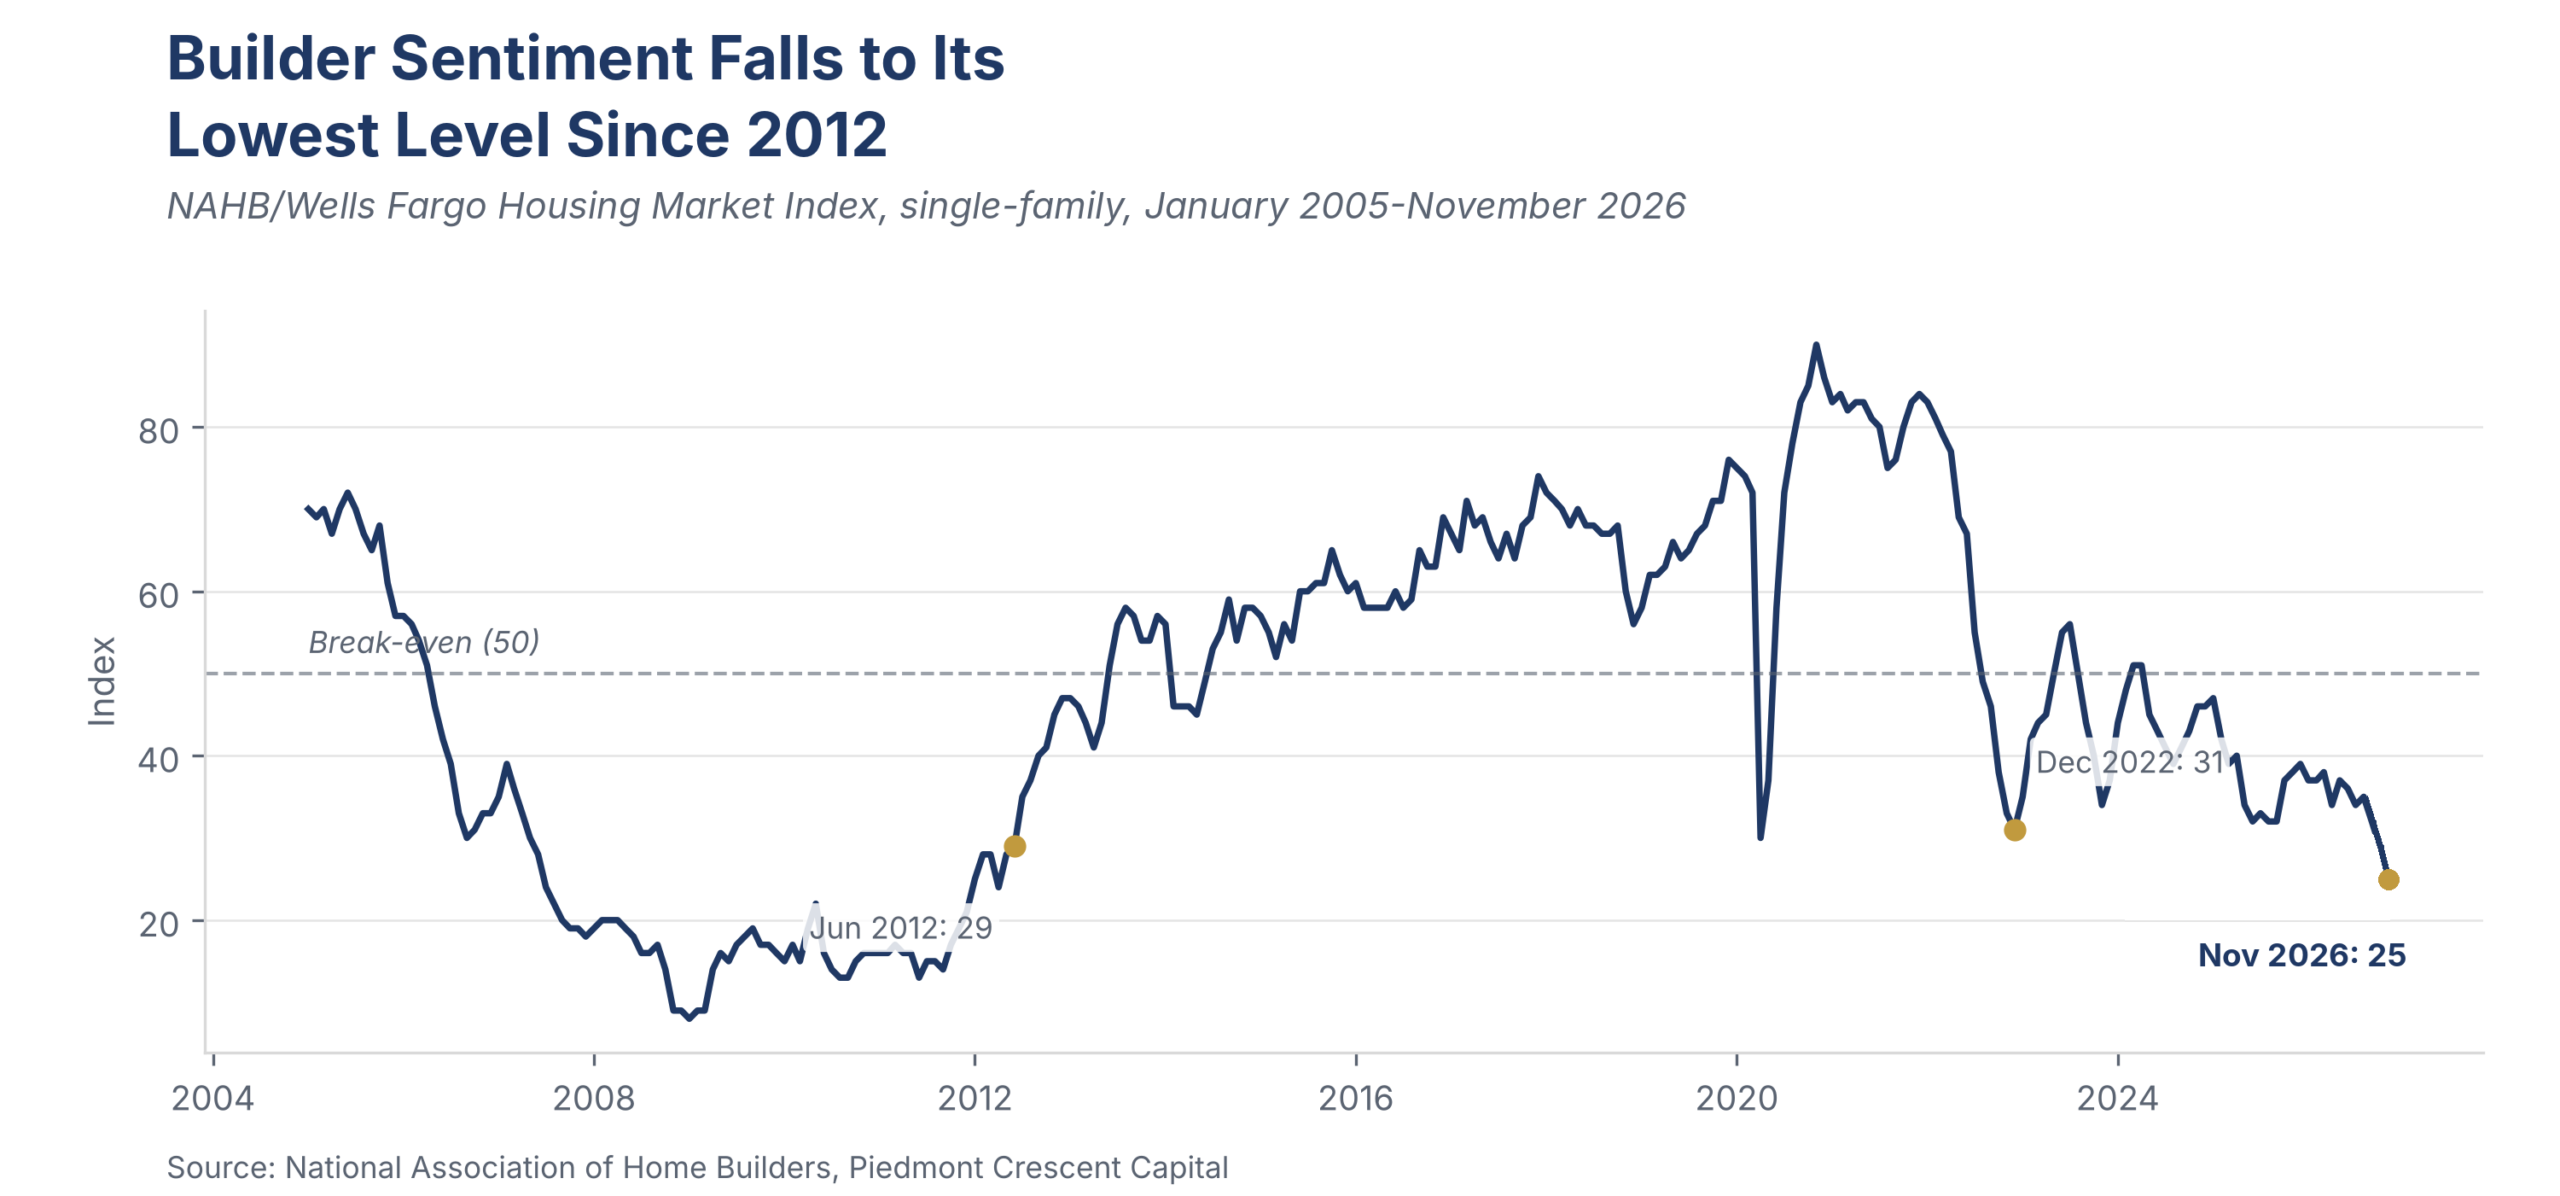
All three components fell. Present sales conditions dropped six points to 28, the six-month sales outlook fell two points to 30, and buyer traffic fell two points to 16, which NAHB describes as its lowest level in 15 years outside the start of the pandemic in 2020. In response, 46% of builders reduced prices in November, the highest share in the post-Covid period, and the average reduction held at 6% for an eighth straight month. Some 68% of builders offered sales incentives, also a post-Covid high, and incentives have now been used by at least 60% of builders for 20 consecutive months.
Builders cite more than mortgage rates. NAHB Chairman Bill Owens said stepped-up immigration enforcement is keeping legal workers off job sites, deepening labor shortages and driving up costs, and that higher fuel prices are prompting subcontractors to raise their rates sharply. NAHB Chief Economist Robert Dietz pointed to building material costs pushed higher by tariffs, a shortage of construction workers and regulation, and said mortgage rates above 7%, softer consumer confidence and an uncertain economic outlook are holding buyers back. Mortgage rates have eased over the past month, as discussed below, and sentiment fell anyway, which suggests that rates are only part of the story for builders.
On NAHB’s three-month-average basis, every region softened. The Northeast fell four points to 34, the Midwest five points to 35, the South three points to 27 and the West three points to 23. The Midwest is the strongest region and the West the weakest.
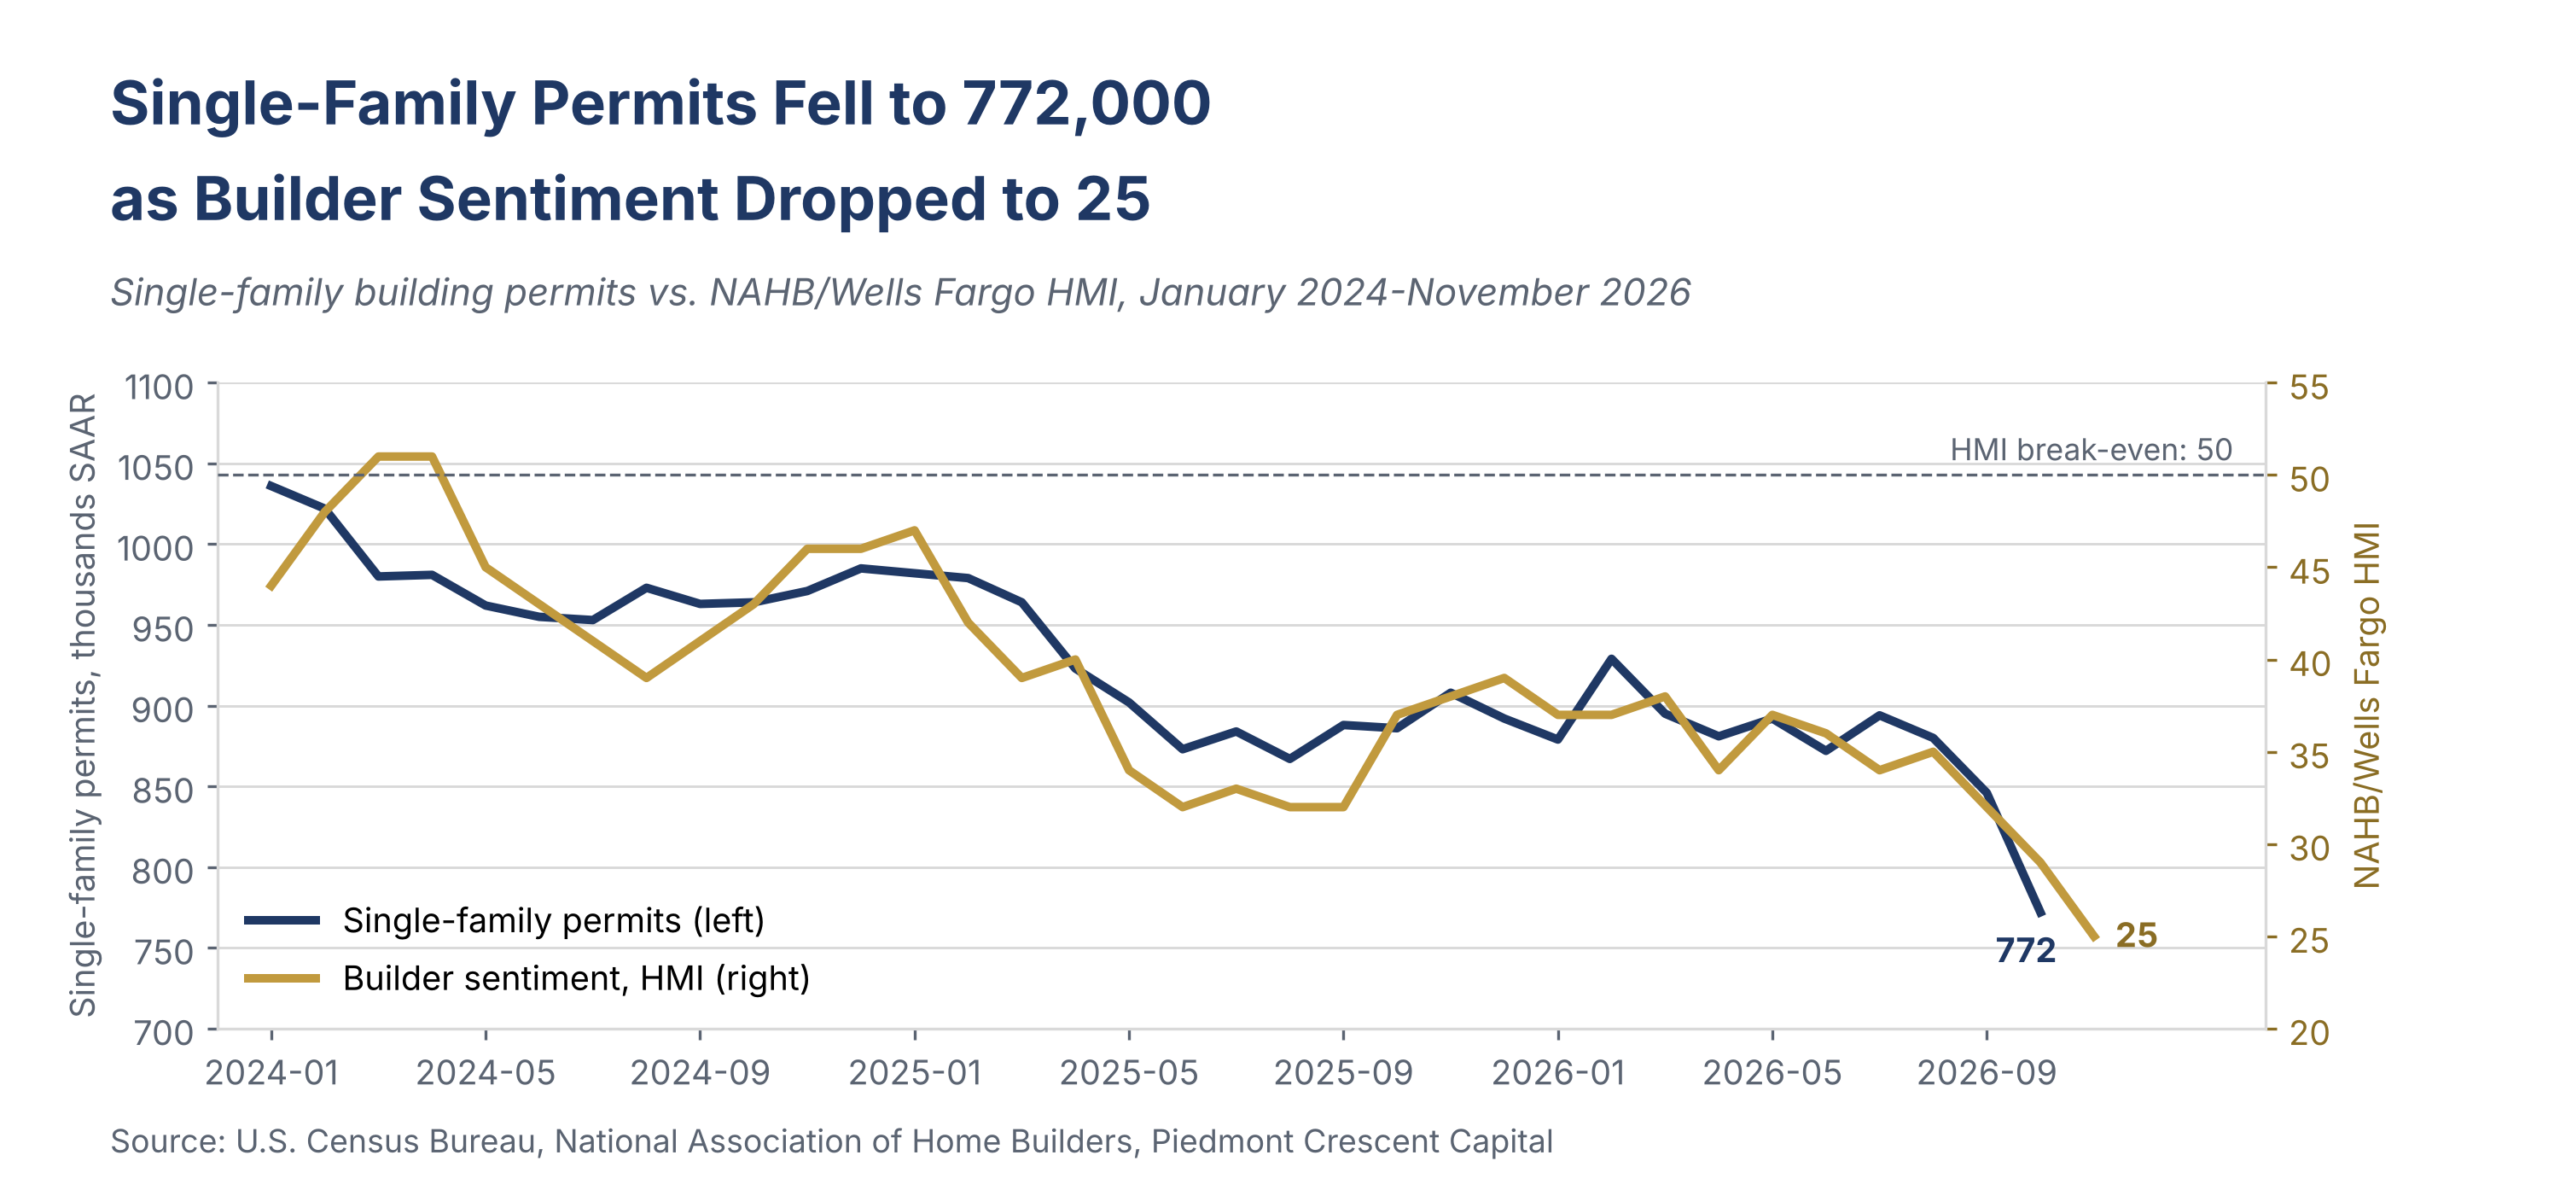
Exhibit 4 sets single-family permits against builder sentiment. The two have moved lower together since early 2024, with single-family permits averaging 979,000 in 2024, 912,000 in 2025 and 874,000 so far in 2026, while the index averaged about 45, 37 and 35. October’s permits of 772,000 are the lowest reading in the exhibit, as is the index at 25, and with permits that far below single-family starts of 864,000 we expect single-family starts to fall below 850,000.
New Home Sales and Inventory
New home sales were 676,000 in September, the latest data available, 0.6% below August’s revised 680,000 and 5.3% below a year ago. The Census Bureau cautions that neither change is statistically significant. Those sales were signed before the 30-year mortgage rate averaged 7.35% in October, so the October report, due November 25, is the first that falls fully inside the higher-rate period.
Inventory shows where builders are adjusting. Homes for sale fell 1.0% to 476,000 and months’ supply eased to 8.4 from 8.5, but the mix has shifted. Homes for sale that have not been started rose to 115,000, the highest in data going back to 2019, while completed homes for sale fell 9.0% from a year ago to 111,000 and homes under construction fell to 250,000. Builders are completing fewer speculative homes and adding to supply they have not yet begun, which is the part of supply they can still cut quickly. The drop in single-family permits suggests some are doing so.
The median new-home price was $400,400 in September, 3.9% below a year ago, though that change is not statistically significant. The average price fell 6.7% from a year ago, which is significant, as builders lean on price, smaller homes and incentives to move inventory.
Completions
Completions are the lagging end of the construction pipeline. They rose 6.5% in October to 1,272,000, a change that is not statistically significant, and are 10.4% below a year ago. For the first ten months of the year, completions are down 12.3%, with single-family completions down 10.7% and multifamily completions, calculated as total less single-family, down 15.4%.
Fewer completions mean fewer new homes added to an elevated inventory of unsold new construction, which helps clear the overhang. They also reflect a slower pace of commitments through 2025, and units under construction are now 3.0% below a year ago. With permits falling, the pipeline is likely to thin further into 2027.
Mortgage Rates and Demand
Mortgage rates have eased from their October peak but are still above 7%. Freddie Mac’s 30-year fixed rate averaged 7.11% in the week of November 12, its fourth straight weekly decline from 7.40% on October 15, compared with 6.24% a year ago. The Mortgage Bankers Association’s survey for the week ended November 6 shows buyers responding at the margin. Total applications rose 6.2%, purchase applications rose 8% and the average 30-year contract rate fell to 7.21% from 7.30%. Purchase applications were still 18% below a year ago, and refinancing was 57% below.
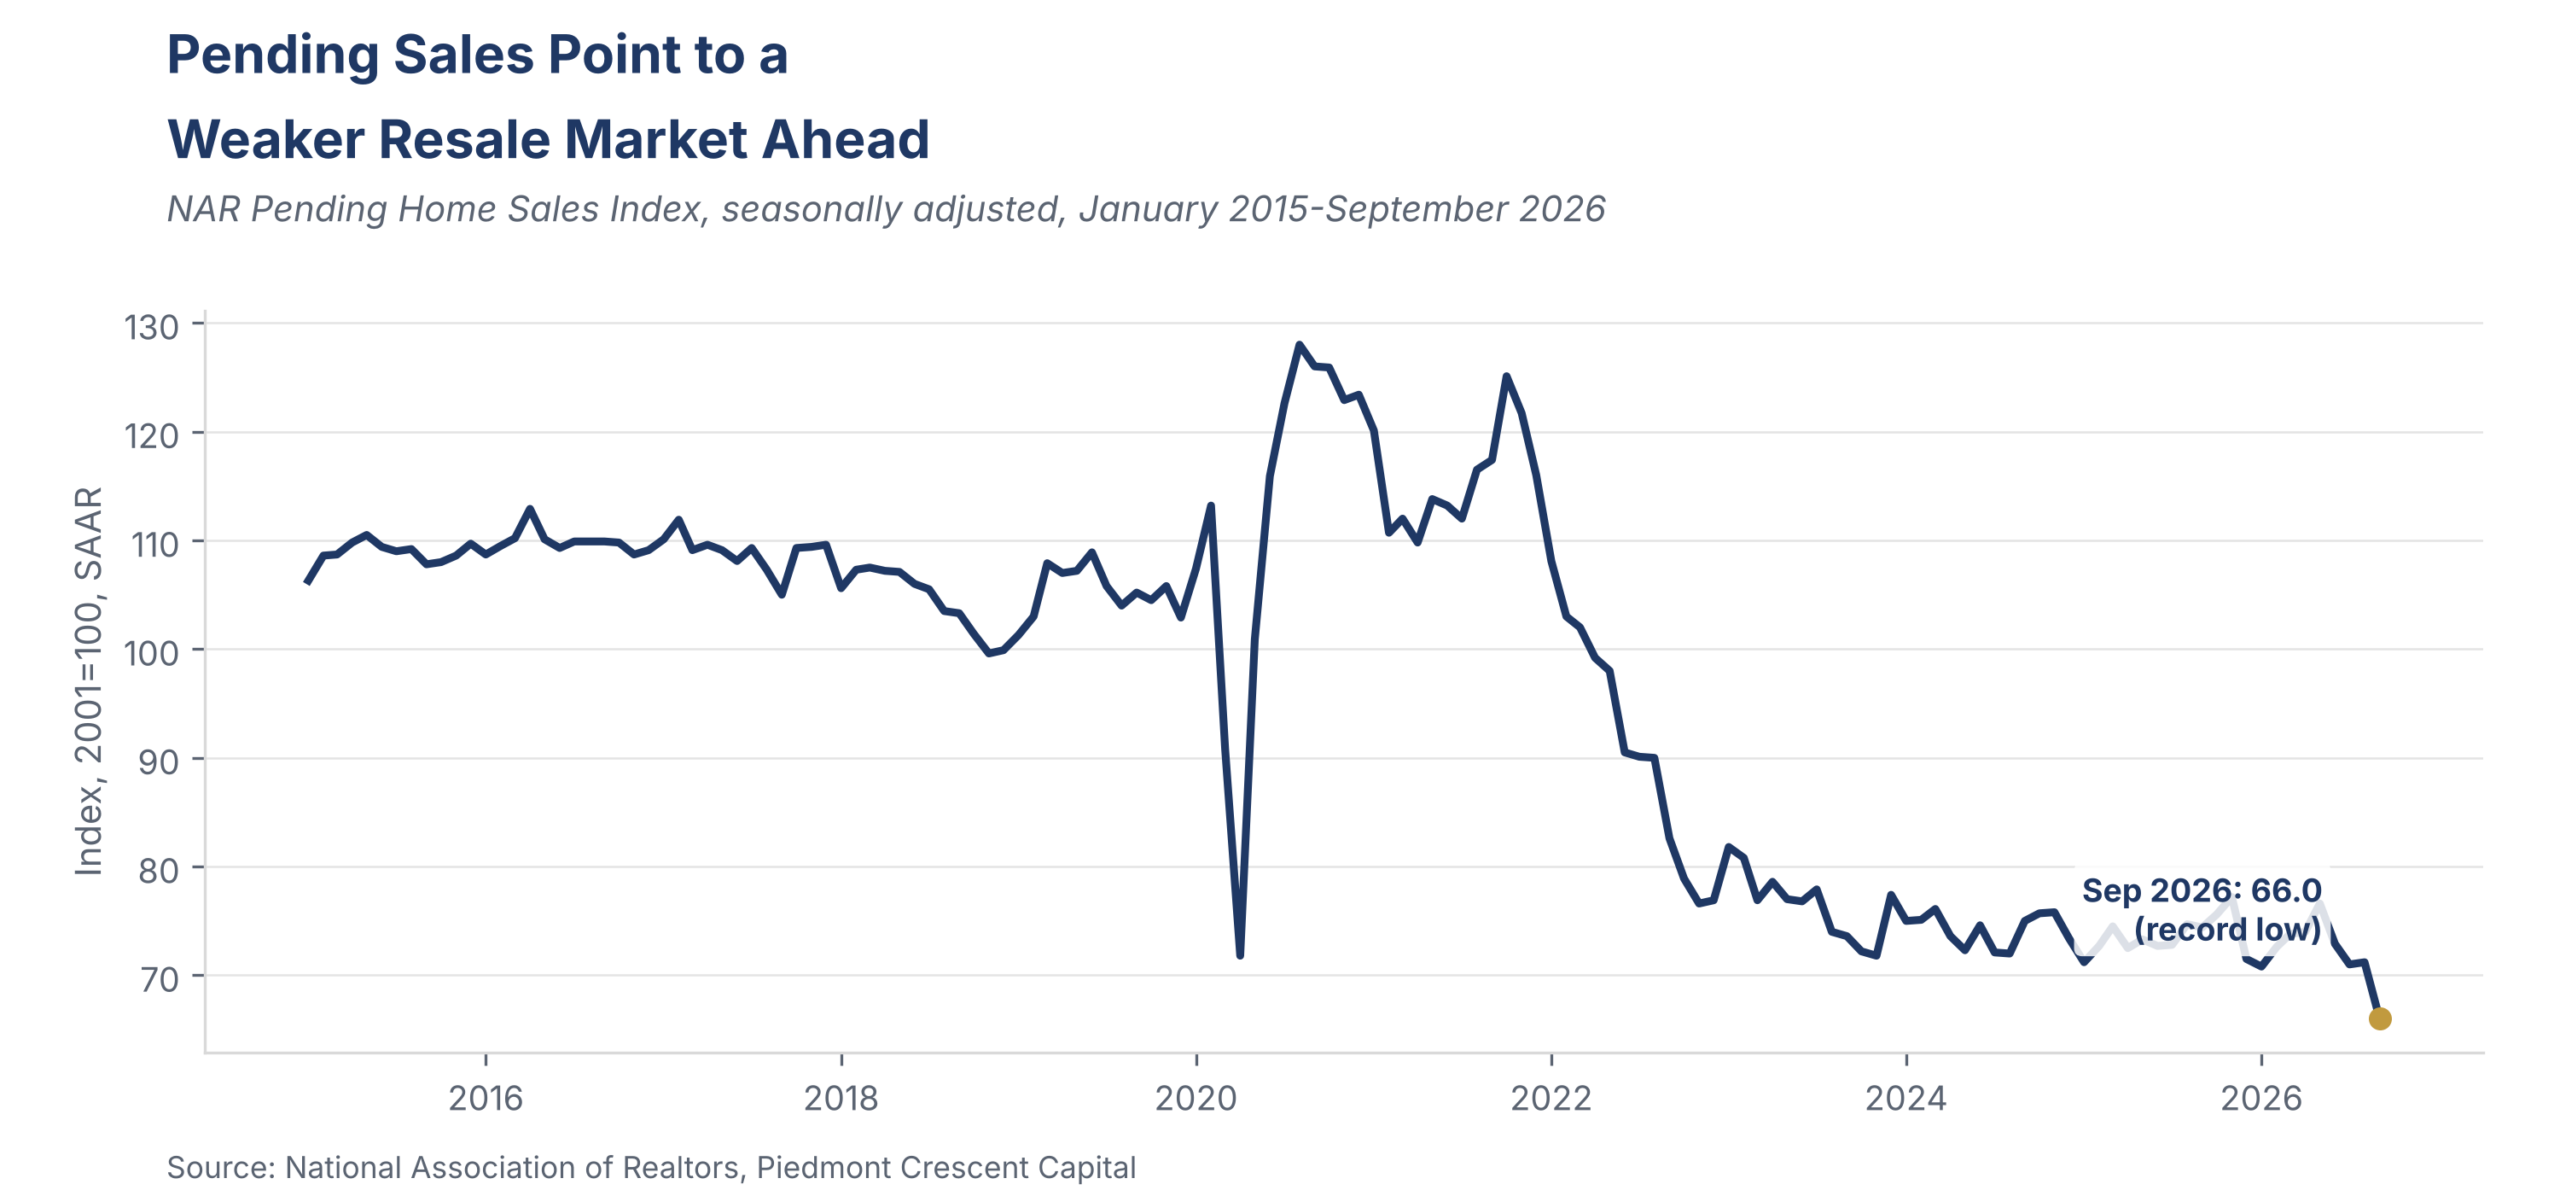
A single week of improvement at a rate above 7% is a small step, and builders’ own traffic reading of 16 shows little of it so far. Contracts for existing homes point to softer sales as well. NAR’s Pending Home Sales Index fell 7.3% in September to 66.0, the lowest on record and 11.3% below a year ago, and NAR’s own data show signed contracts typically turn into closed sales one to two months later, so existing-home sales, which compete directly with new construction for the same buyers, look set to stay soft into the winter.
The Structural Backdrop
A few structural themes run beneath the month-to-month swings in starts, sales and mortgage applications, and they are worth stating plainly because they do not change from one release to the next the way the headline numbers do.
The market is undersupplied. Household formation has outpaced new construction completions in most years since the 2008-2009 downturn, and various estimates, including from Freddie Mac and other housing economists, put the national shortfall at several million units. That shortage is a big part of why home prices have held up even as sales volumes have fallen to some of the lowest levels on record: homeowners without an urgent need to move are staying on the sidelines and not listing into a higher-rate environment, which keeps resale inventory tight and provides a measure of support for new construction and for prices generally.
This looks like a market working through a real affordability shock, not unwinding into a 2008-style correction. Few people understand, or are willing to acknowledge, what is behind that shock, which is the high, fixed, upfront regulatory cost of new residential development, including required infrastructure and compliance fees. Those costs are paid before new construction begins, and because they are fixed they do not shrink when demand softens. Higher interest rates make the problem worse from both sides, by making home purchases less affordable and new development unprofitable. Mortgage rates above 7% are a genuine headwind, but they have not triggered the kind of forced selling or broad price declines that defined the last downturn. Homeowner vacancy rates are low, mortgage delinquencies are well below their historical norms, and most outstanding mortgages still carry rates locked in well below where new buyers must borrow today, which keeps existing homeowners in place.
Builders are adapting, and a growing number are pulling back. The shift toward build-to-order and away from speculative completions, visible in the inventory data, is one example; smaller square footage and incentives in place of outright price cuts are others, and NAHB’s chairman noted that with fewer buyers in the market, more builders are scaling back construction. The market is absorbing a real rate shock without the broad-based price correction some forecasters expected when rates first moved above 7%, although activity is subdued.
The rebound in October starts is the weaker signal in this report. Permits fell 7.4% on a broad base of declines, single-family permits fell in all four regions, and builder confidence dropped to 25, its lowest reading since April 2012. We are holding our full-year total-starts forecast at 1,349,000 for 2026 and 1,368,000 for 2027 for now, but the risks to the coming months are to the downside.
We will watch the releases over the next few months to see whether starts take another step down. For now we are holding our forecast close to prior levels. Single-family is running below last year’s pace, and we put little weight on October’s multifamily jump. Single-family permits of 772,000 sit well below single-family starts of 864,000, and that gap argues for lower single-family starts in November and December. If single-family starts fall meaningfully below 800,000, or multifamily starts hold October’s gain through the winter, we would revisit both halves of the forecast together.
On rates, we still look for a Fed hike on December 9 and expect at least two more quarter-point increases, with the risk tilted toward a third if inflation does not cooperate, putting the terminal rate at 4.25%-4.50% or higher by the end of 2027. The 30-year fixed rate has eased to 7.11%, a bit below the 7.25% we carry for year-end.
Mark P. Vitner – Chief Economist, Piedmont Crescent Capital
mark.vitner@piedmontcrescentcapital.com · (704) 458-4000
Sources
U.S. Census Bureau, New Residential Construction, October 2026 (released November 18, 2026), national and regional tables for starts, permits, completions and units under construction, total and by structure size. U.S. Census Bureau, New Residential Sales, September 2026 (released October 27, 2026), national sales, inventory and price series. National Association of Home Builders/Wells Fargo Housing Market Index, November 2026 (released November 17, 2026), national headline, component and regional series. National Association of Realtors, Pending Home Sales Index, September 2026. Mortgage Bankers Association, Weekly Mortgage Applications Survey, week ended November 6, 2026. Freddie Mac Primary Mortgage Market Survey, 30-year fixed rate, week of November 12, 2026. PCC’s own economic and financial forecast.
Disclaimer: This report is provided for informational purposes only and does not constitute investment, legal or tax advice. The information and opinions contained herein are based on sources believed to be reliable but are not guaranteed as to accuracy or completeness. Opinions expressed are current as of the date of publication and are subject to change without notice. Piedmont Crescent Capital undertakes no obligation to update this report. Past performance is not indicative of future results.