
Retail Sales Report: October Starts the Holidays Well Above the Third-Quarter Pace
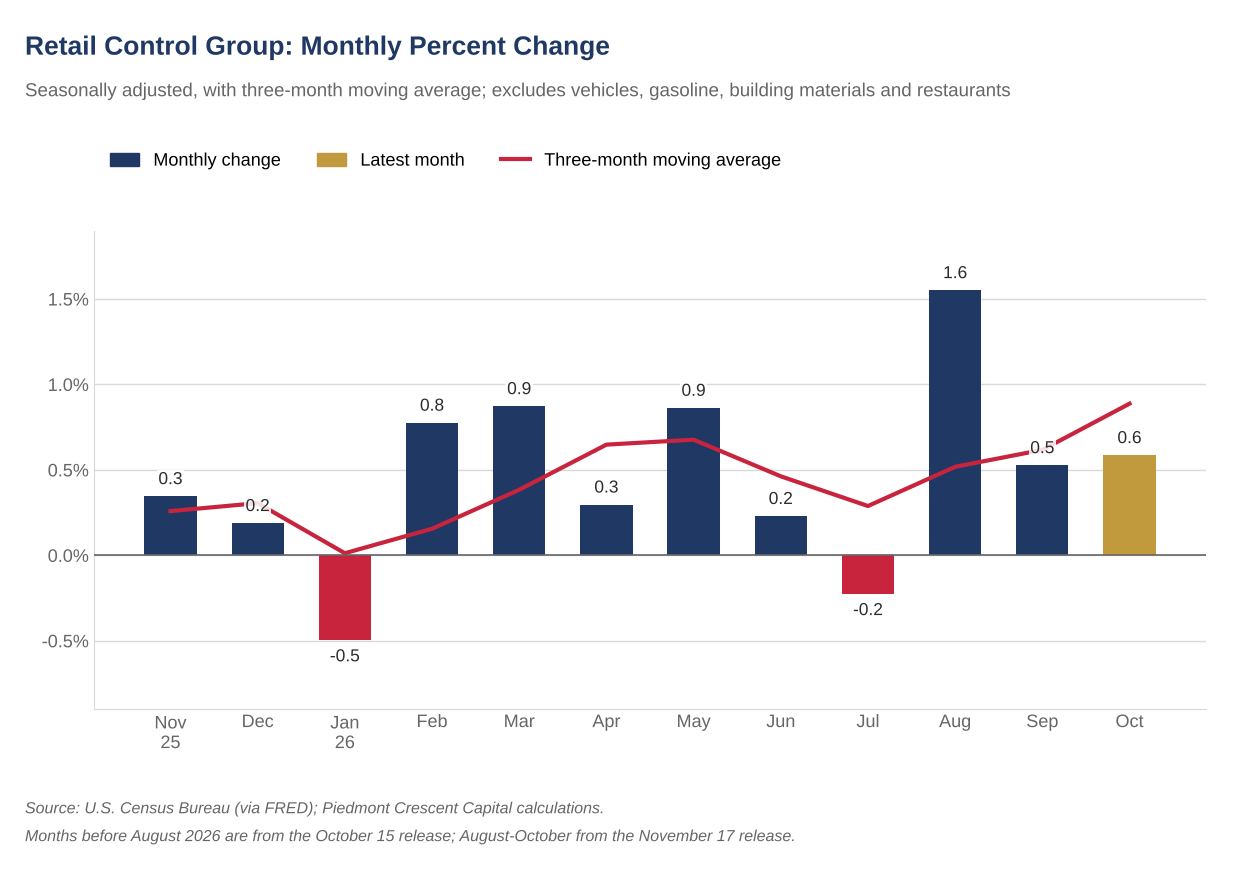
Retail and food services sales rose 0.2% in October, in line with expectations, but the control group rose 0.6% and now sits 1.5% above its third-quarter average, a 5.9% annualized pace. September’s pause was revised away, and the holiday season ahead will be heavily promotional.
Early Signals
- The headline matched expectations, and the third-quarter comparison is the better read. Retail and food services sales rose 0.2% in October to $748.2 billion after a 0.8% gain in September, and are up 6.8% over the past twelve months. All thirteen major categories Census tracks are higher than a year ago. October’s level is 1.2% above the July-September average of $739.0 billion, which works out to a 5.1% annualized pace over the third quarter if November and December simply hold there.
- The control group is the number that matters, and it is 1.5% above its third-quarter average. Core retail sales, which exclude motor vehicles, gasoline, building materials and food services, rose 0.6% in October against a consensus forecast of 0.4%. At $405.5 billion the control group is $5.8 billion above its third-quarter average, a 5.9% annualized pace in nominal terms. September was revised to a 0.5% gain from 0.1%, so the pause in the first estimate did not survive.
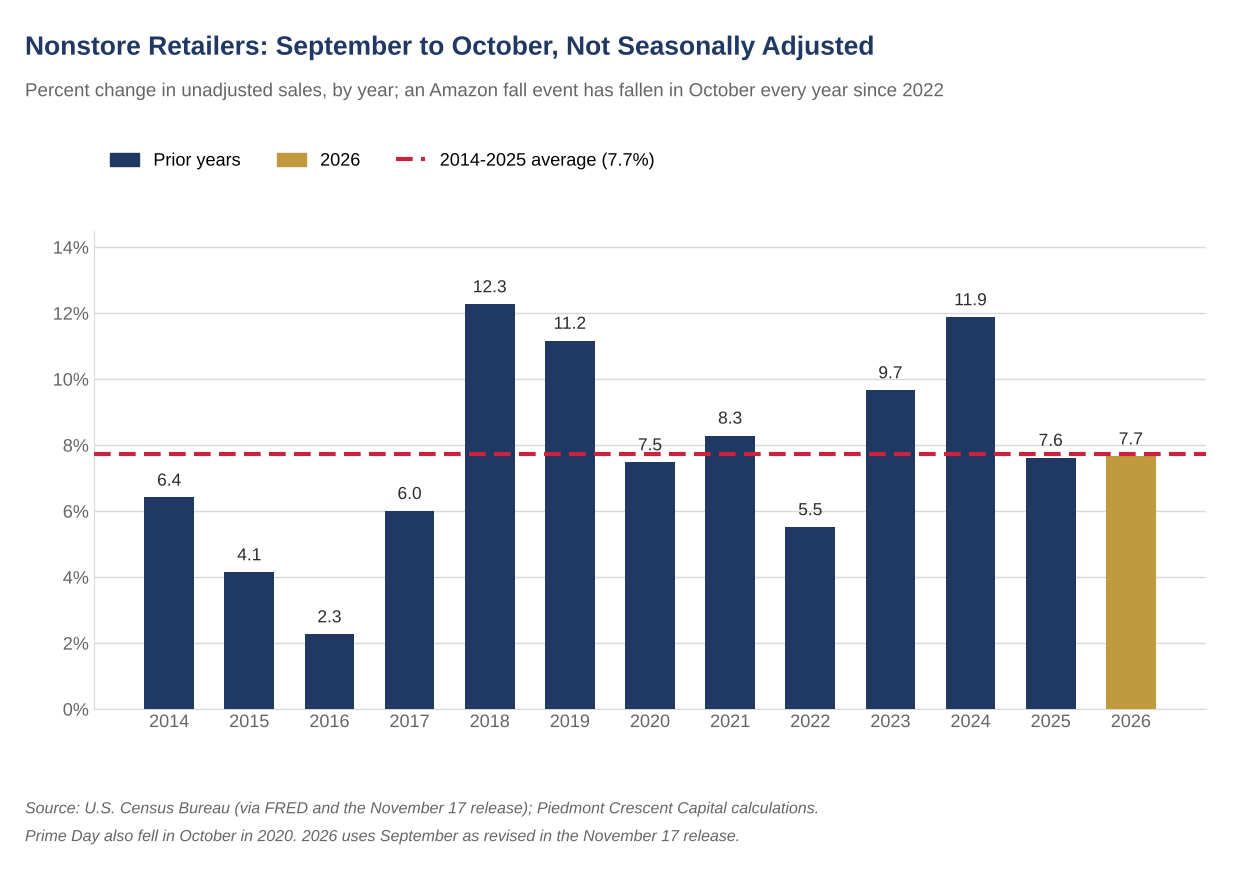
- Nothing moved on the calendar this month. Amazon’s second event, Prime Big Deal Days, ran October 6 and 7 as it has in October every year since 2022, so October’s gain in nonstore retailers carries no promotional shift of the kind that distorted June and July. Nonstore sales rose 1.2% seasonally adjusted and 7.7% before adjustment, in line with the 2014-2025 average for the month, and are 11.8% above a year ago.
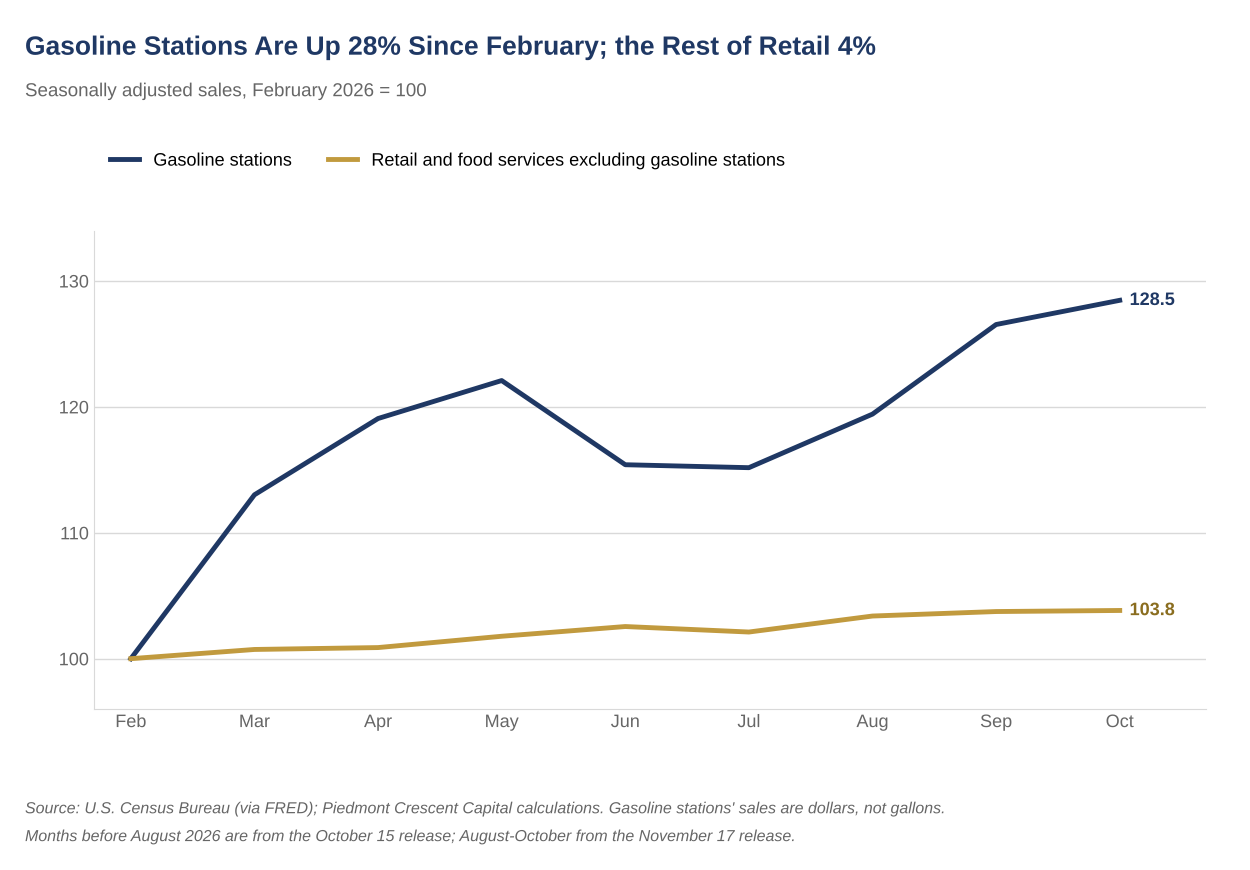
- Vehicles and gasoline, the two swing categories. Motor vehicle and parts dealers fell 1.6%, consistent with light-vehicle unit sales of 15.5 million at an annual rate, down from 16.0 million in September. Gasoline stations rose 1.5% and are up 30.3% from a year ago. The EIA price of regular gasoline slipped 1.0% to $4.31 a gallon before seasonal adjustment, while the CPI for gasoline rose 1.0% seasonally adjusted, so the dollar gain at the pump says little about gallons.
- Goods versus services, read through the restaurant line. Food services and drinking places rose 0.2% and are up 7.0% over the past twelve months, and restaurants held a 12.4% share of total sales. Restaurants and bars are the discretionary category households trim first, and they have not trimmed.
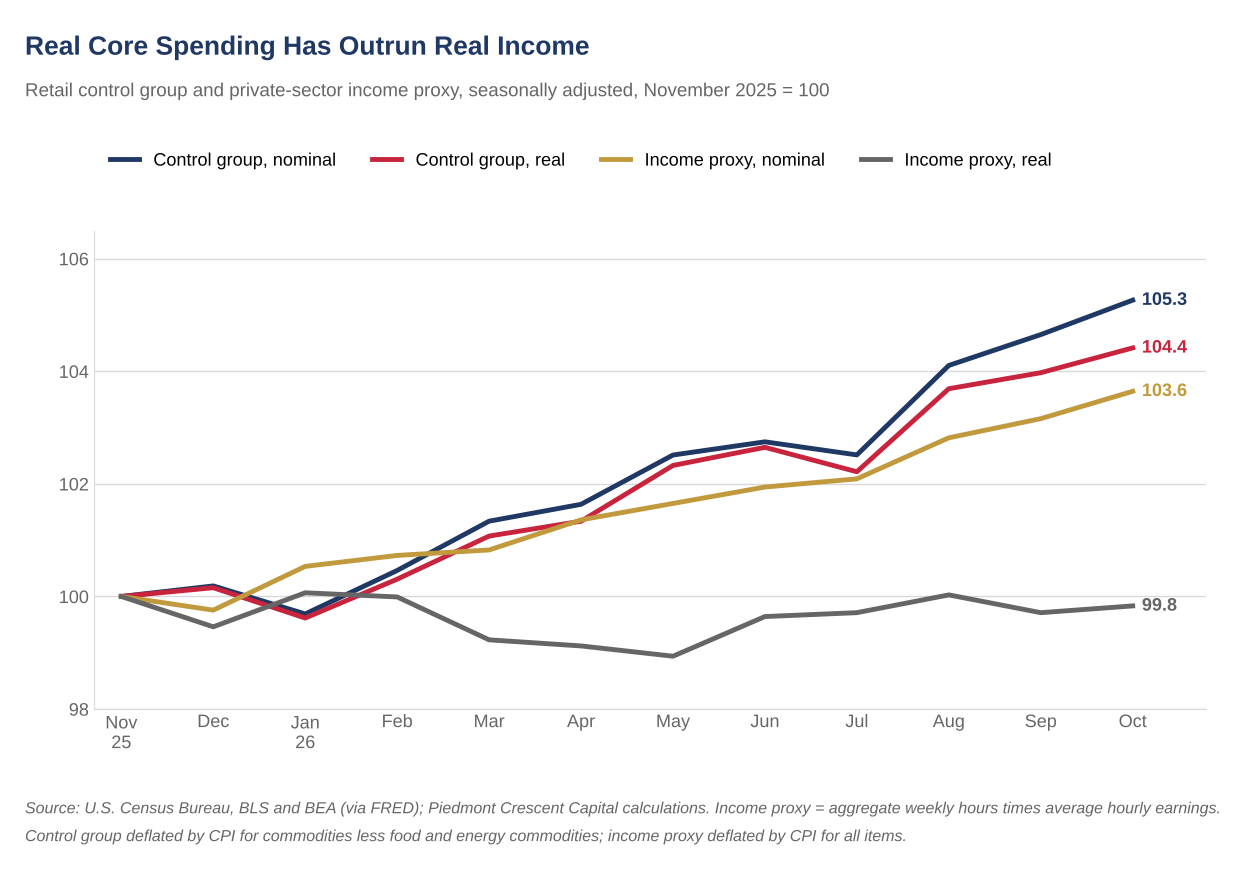
- Real core spending is up 4.4% since last November, and real income is down 0.2%. Deflating the control group by the CPI for commodities less food and energy commodities, which rose 0.2% in October, puts real core spending up 0.4% on the month and 1.1% above its third-quarter average, a 4.4% annualized pace. Our income proxy, aggregate weekly hours worked times average hourly earnings, rose 0.5% in October and is 0.9% above its third-quarter average, but the CPI for all items rose 0.4% and left real income unchanged against that average.
Key Takeaways
| Key Concept | Findings |
|---|---|
| Headline retail sales | Up 0.2% to $748.2 billion, in line with consensus, and up 6.8% over twelve months. Nonstore retailers added 0.21 percentage points and gasoline stations 0.14, while motor vehicle and parts dealers subtracted 0.30. All other categories together added 0.16. |
| Retail control group | Up 0.6% against a 0.4% consensus forecast. The GDP-relevant read. Up 5.6% over twelve months. |
| Versus the third-quarter average | The control group is 1.5% above its third-quarter average, a 5.9% annualized pace if November and December hold at October’s level. Total sales are 1.2% above (5.1% annualized) and total sales excluding gasoline stations 0.7% above. |
| Key growth areas | Nonstore retailers up 1.2%, 3.0% above their third-quarter average and 11.8% above a year ago. Health and personal care up 1.5% and 2.6% above the third-quarter average. Miscellaneous store retailers up 4.7%. Restaurants and bars up 0.2%, 1.3% above the third-quarter average, with their share of total sales steady at 12.4%. |
| Soft spots | Motor vehicle and parts dealers down 1.6%, consistent with light-vehicle unit sales of 15.5 million at an annual rate, down from 16.0 million in September. Furniture and home furnishings down 2.3% after a 3.6% gain in September. Clothing and sporting goods stores each down 0.7%. |
| Gasoline stations | Up 1.5% and up 30.3% over twelve months. The EIA price of regular gasoline fell from $4.36 to $4.31 a gallon before seasonal adjustment and the CPI for gasoline rose 1.0% seasonally adjusted, so most of the dollar change is price. |
| Nonstore calendar read | The unadjusted gain of 7.7% is in line with the 2014-2025 average for October, so the calendar adds little to the 1.2% seasonally adjusted gain. |
| Revisions | September’s control group gain was revised to 0.5% from 0.1% and August’s to 1.6% from 1.2%. Census puts the average absolute revision at two-tenths of a percentage point. |
| Real spending | Control group deflated by core-commodity CPI: up 0.4% on the month, 1.1% above its third-quarter average and a 4.4% annualized pace. Third-quarter real growth is now 4.7% annualized, revised up from 3.4%. Our real income proxy is flat against its third-quarter average. |
| Holiday outlook | NRF forecasts November-December sales up 4.2% to $1.013 trillion. Expect heavy promotions as affordability concerns follow shoppers into the season. Thanksgiving falls on November 26, which leaves 28 shopping days to Christmas Eve. Sluggish real income growth is a major reason retailers are cautious despite solid momentum. |
The Overview
October’s report was better than its headline. Sales rose 0.2%, all thirteen of the major categories Census tracks are higher than a year ago, and the control group, the part of retail sales that feeds GDP most directly, rose 0.6%. The Census Bureau notes that the October change is within its margin of error, so the more useful comparison is with the third quarter: October’s level is $9.2 billion, or 1.2%, above the July-September average, and the control group is $5.8 billion, or 1.5%, above its own third-quarter average (Exhibit 1).
Retail sales begin the holiday shopping season with solid momentum, with sales 1.2% above their third-quarter average.
Exhibit 1. The control group is 1.5% above its third-quarter average, a 5.9% annualized pace
| Measure | Q3 average ($ billions) | October ($ billions) | Above Q3 average | Annualized rate |
|---|---|---|---|---|
| Control group | 399.7 | 405.5 | 1.5% | 5.9% |
| Total retail and food services | 739.0 | 748.2 | 1.2% | 5.1% |
| Total excluding gasoline stations | 674.7 | 679.6 | 0.7% | 2.9% |
Seasonally adjusted. The annualized rate is the October level divided by the third-quarter average, raised to the fourth power, minus one, in nominal terms, and assumes November and December hold at October’s level.
The headline leans on online sales and gasoline. Nonstore retailers added 0.21 percentage points to the total and gasoline stations added 0.14, while motor vehicle and parts dealers subtracted 0.30 and all other categories together added 0.16. Contributions use September’s weights. Revisions mattered as much as the print: September’s control group gain was revised to 0.5% from 0.1% and August’s to 1.6% from 1.2%, which raised third-quarter real core spending to a 4.7% annualized pace from the 3.4% we reported in the September issue.
The pause in preliminary control group sales for September was revised away.
Where the Month’s Noise Came From
Motor vehicles and gasoline together run over a quarter of the headline and moved in opposite directions in October. Motor vehicle and parts dealers, 18.6% of total sales, fell 1.6% and subtracted 0.30 percentage points. Gasoline stations, 9.1% of total sales, rose 1.5% and added 0.14 percentage points. Excluding both, sales rose 0.5%.
The average retail price of regular gasoline slipped from $4.36 a gallon in September to $4.31 in October, a change of 1.0% before seasonal adjustment, while the CPI for gasoline rose 1.0% seasonally adjusted, a little below gasoline stations’ 1.5% sales gain. When the price moves and the volume does not, gasoline stations’ sales track the price. The pump price is 40.8% above a year ago against a 30.3% gain in sales at gasoline stations, which appears to mean fewer gallons are being sold. Higher fuel bills take money from other categories, and the control group’s 0.6% gain suggests households have so far absorbed them.
The Control Group: What Actually Feeds GDP
The control group, total retail and food services less motor vehicles and parts, gasoline stations, building materials and garden equipment, and food services, rose 0.6% in October to $405.5 billion. The level is 1.5% above its third-quarter average of $399.7 billion, a 5.9% annualized pace over the third quarter on the same assumption, and it is up 5.6% from a year ago. The three-month pace of 8.4% annualized runs higher because the May-July base includes a soft July. BEA uses the control group as the primary monthly input to goods consumption.
Online and health and personal care channels led. Nonstore retailers rose 1.2% and are 3.0% above their third-quarter average. Amazon’s Prime Big Deal Days ran October 6 and 7, and Adobe measured $9.86 billion of online spending over the two days, up 8.5%. Health and personal care stores rose 1.5% and are 2.6% above their third-quarter average, and miscellaneous store retailers rose 4.7% after falling 3.0% in September, a volatile line that we treat with caution.
Vehicles and big-ticket home goods pulled back. Furniture and home furnishings stores fell 2.3% and gave back most of September’s 3.6% gain, and building materials and garden stores, the category that holds the home improvement chains, rose 0.5% and are flat against their third-quarter average. Spending on the home tracks existing home sales, housing turnover and home prices, and turnover has been weak this year. Home Depot reported on Tuesday that third-quarter comparable sales rose 2.2%, but transactions fell 0.5% and customers favored smaller projects over large renovations. Clothing and sporting goods stores each fell 0.7%, which leaves them 0.3% and 0.4% below their third-quarter averages. All thirteen major categories remain above year-ago levels.
The Promotional Calendar
Retail sales are shaped every summer and fall by a handful of manufactured shopping events whose dates move. October carries the second Amazon event, Prime Big Deal Days, which ran October 6 and 7 this year and has fallen in October every year since 2022, and retailers began their holiday promotions before Halloween. No event crossed a month boundary in October, unlike June and July, when Prime Day moved to late June.
The evidence is in the not-seasonally-adjusted data. Nonstore retailers rose 7.7% in October before seasonal adjustment, against an average gain of 7.7% in the same month from 2014 through 2025. Census’s seasonal factors expected about 6.3%; after adjustment the category rose 1.2%. The unadjusted gain sits on the historical average and the adjusted gain does not depend on a calendar shift.
The recurring calendar. July: back-to-school promotions begin in the last week; Amazon Prime Day fell in July every year from 2015 through 2025 except 2020 (October) and 2021 (June), and moved to late June in 2026. August: back-to-school peak, most state sales tax holidays. September: the back-to-school tail and Labor Day. October: the second Prime event, “Prime Big Deal Days,” since 2022. November: Black Friday and Cyber Monday, whose split between November and December turns on the Thanksgiving date. December: the number of shopping days between Thanksgiving and Christmas, which has ranged from 26 to 32. Easter moves between March and April. Census adjusts for trading days and for the moving holidays Easter, Labor Day and Thanksgiving, but publishes no promotional-event regressor.
A Seasonal Read on October
October is normally when retailers begin the holiday ramp, and unadjusted nonstore sales have risen from September in every year since 2014, by as little as 2.3% and as much as 12.3%. This October fit the pattern. Nonstore retailers rose 7.7% in the raw September-to-October data and 1.2% after seasonal adjustment, and Exhibit 4 shows the unadjusted change for every year since 2014.
October, specifically. October is the first month in which holiday promotions register in the data. Back-to-school buying is finished and the second Amazon event has passed. The CNBC/NRF Retail Monitor, which showed October sales excluding autos and gasoline up 3.57% from a year ago, credited a strong Halloween season and early holiday promotions for pulling demand forward, and NRF’s survey finds 43% of shoppers plan to start before November. October therefore tells us how much demand shoppers moved forward and less about the underlying consumer, and a strong October raises the risk of payback in November.
Goods, Services and the Restaurant Line
Food services and drinking places, the only services line in this report and worth about an eighth of the total, rose 0.2% in October, are up 7.0% over the past year and sit 1.3% above their third-quarter average. Restaurants and bars are usually the first discretionary line households cut, and sales there are still rising.
The income side is where this report and the broader spending data could still diverge. The October personal income and outlays report, due from BEA on November 25, will show whether income growth is keeping pace with spending. The personal saving rate was 3.8% in September, and real average hourly earnings were unchanged in October after a 0.7% decline over the twelve months through September. BLS could not publish an October twelve-month comparison because the October 2025 CPI was never collected.
From Nominal to Real
This report is nominal, and October’s price backdrop makes the distinction matter little for goods. The CPI for commodities less food and energy commodities rose 0.2% in October, which trims the control group’s 0.6% gain to roughly 0.4% in real terms. Since last November the nominal control group has risen 5.3% and the real control group 4.4%. The real control group is 1.1% above its third-quarter average, a 4.4% annualized pace, and no twelve-month real figure is available for October because the CPI was not collected in October 2025.
Our income proxy is up 4.5% from a year ago and flat in real terms against its third-quarter average. We build the proxy for private-sector workers by multiplying aggregate weekly hours worked by average hourly earnings. In October hours rose 0.1% and hourly earnings rose 0.4%, which lifted the proxy 0.5% to a level 0.9% above its third-quarter average, a 3.8% annualized pace. The CPI for all items rose 0.4% in October and is 0.9% above its third-quarter average, so the real proxy rose 0.1% on the month and sits unchanged from its third-quarter average. Through September the real proxy is up 0.6% over twelve months.
The deflators matter for the comparison with spending. Since last November the nominal proxy is up 3.6% against 5.3% for the control group. The all-items CPI is up 3.8% over the same period and the CPI for core commodities 0.8%, which is why real income is down 0.2% while real core spending is up 4.4%. Deflating the control group by the all-items CPI as well, real core spending is up 1.4% since last November and 0.5% above its third-quarter average, still well ahead of flat real income.
The proxy is up 5.5% since June 2025, against 5.4% for BEA wages and salaries. BEA’s wages and salaries series, which includes government workers, runs through September. Over the twelve months through September the proxy is up 4.4% against 4.1%. Month-to-month changes are only loosely related, and the proxy ran faster than BEA in the third quarter, at a 4.1% annualized pace against 3.1%, so October’s 0.5% is likely a little generous. Neither series includes benefits, proprietors’ income, interest or transfers. BEA’s real personal income excluding transfers was up 0.5% over the twelve months through September.
Real core spending is up 4.4% since last November, while real income, by our measure, is down 0.2%.
The Holiday Season Ahead
NRF forecasts the fastest holiday growth since 2021. The National Retail Federation expects sales in November and December to rise 4.2% over 2025 to $1.013 trillion, an acceleration from last year’s 3.1% gain to $972 billion, and notes that the pace would be the fastest since 2021. NRF excludes automobile dealers, gasoline stations and restaurants, and expects nearly half of the growth to come from real spending. Last year’s gain fell short of NRF’s forecast range of 3.7% to 4.2%, which argues for some caution, though Census data for October show sales outside autos and gasoline running 5.9% above a year ago.
Sluggish real income growth is a major reason retailers are nervous about the holidays, despite solid momentum. Our income proxy is unchanged in real terms against its third-quarter average and down 0.2% since last November, while real core spending is up 4.4% over the same period. Spending that runs ahead of income has to be financed from saving or borrowing, and the personal saving rate was only 3.8% in September, so the cushion is thin. That helps explain why retailers are leaning on promotions, why 56% of shoppers in NRF’s survey say economic conditions will influence their spending, and why PwC expects average gift spending to dip 2%.
This will be a heavily promotional season. Affordability concerns are following shoppers into the holidays. In NRF’s survey, 56% of holiday shoppers said economic conditions will influence their spending, 64% plan to wait for Thanksgiving weekend to do most of their shopping, little changed from 63% a year ago, and 43% plan to start before November, half of them to spread out their spending. NRF expects retailers to work hard to keep prices low through promotions and discounts, and higher food and gasoline prices should weigh most on moderate- and lower-income households while higher-income households do the heavy lifting. Adobe expects discounts of up to 30% off listed prices during Cyber Week, and PwC’s June survey found average gift spending expected to dip 2% to $708.
Thanksgiving falls on November 26, which keeps the traditional window compact. The holiday sits in the later half of its November 22-28 range and leaves 28 shopping days between Black Friday and Christmas Eve, against a range of 26 to 32. That is one more day than last year’s 27, so the calendar does not drag on year-over-year comparisons, but the window is short enough that retailers have started promotions in October. Adobe expects online sales of $275.1 billion for November and December, up 6.7%, with Cyber Week bringing $47.5 billion and Cyber Monday falling on November 30. Census adjusts for Thanksgiving and the timing should not distort the seasonally adjusted November report, though promotions may pull some spending into October and early November.
What This Means for Fourth-Quarter Consumer Spending
October starts the fourth quarter with real core spending 1.1% above its third-quarter average, a 4.4% annualized pace on the same assumption (Exhibit 6). That compares with 4.7% in the third quarter, revised up from 3.4%, and 7.3% in the second. If the control group were flat in November and December, fourth-quarter nominal spending would still rise at a 5.9% annualized rate over the third quarter, and monthly gains of 0.3% would lift it to 7.2%. Retail sales are about a quarter of consumer spending, and services, which are most of it, are not in this release. Our forecast for 2026 real consumer spending is 2.3%.
We would weaken this read if the control group gained less than 0.3% in the November report, because that would suggest early promotions pulled spending out of the months ahead.
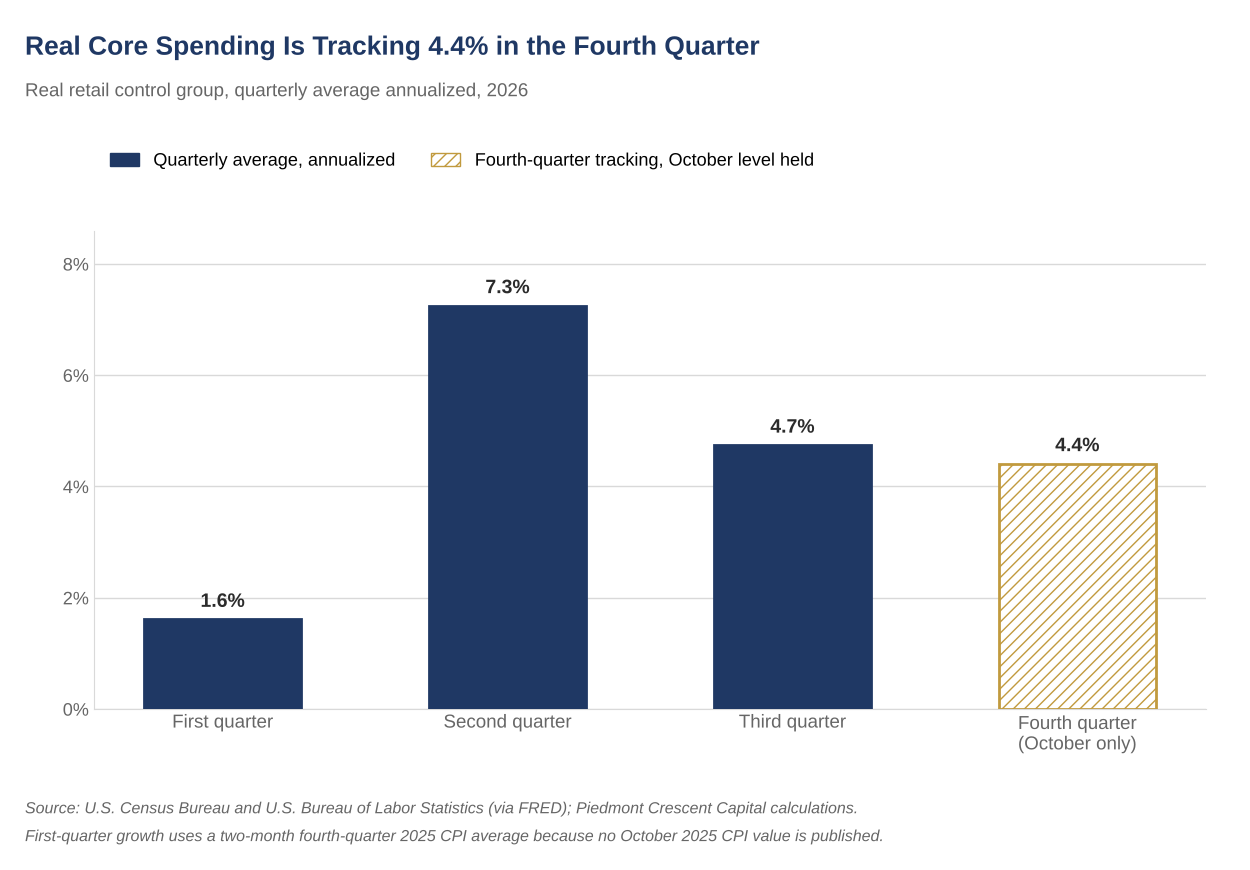
The October retail sales report supports the house view that spending is holding up better than real incomes warrant. The control group rose 0.6% and was revised higher for both August and September, which puts real core spending on a 4.4% annualized pace for the fourth quarter so far, while our real income proxy is unchanged against its third-quarter average.
The mechanism is the K-shaped expansion we have described in prior issues. Higher-income households are doing the heavy lifting, as NRF expects for the holidays, while gasoline stations’ sales are up 30.3% from a year ago and food prices weigh on everyone else.
We expect the Federal Reserve to raise rates a quarter point on December 9 and again in March, ceteris paribus, with a third increase possible if inflation does not ease. The acceleration in core inflation tells us the Fed has more work to do, and spending of this strength supports the December call because households are absorbing higher pump prices without pulling back.
Bottom Line
October’s retail sales report gave the control group a firm start to the fourth quarter. Sales rose 0.2%, but the control group rose 0.6%, August and September were revised higher, and the control group enters the fourth quarter 1.5% above its third-quarter average, a 5.9% annualized pace in nominal terms and 4.4% in real terms. Gasoline supplied part of the headline gain and vehicles took part of it back, and sluggish real income growth is a major reason retailers remain nervous about the holidays despite this momentum. The report gives the Federal Reserve nothing that argues against a quarter-point increase on December 9.
What We Are Watching
November retail sales, Census Bureau, December 16. We will watch the control group for a gain of at least 0.3%. A smaller gain would suggest that early promotions pulled spending out of November.
Personal income and outlays, BEA, November 25. A personal saving rate below September’s 3.8% would suggest households are financing this spending from savings, and a rate above it would suggest the income behind the spending is holding up.
The weekly EIA retail gasoline price. A decline from $4.31 a gallon in October to below $4.00 would ease the pressure on lower-income budgets and trim gasoline stations’ sales, while a rise above $4.50 would press further on the categories households can trim first.
Mark P. Vitner – Chief Economist, Piedmont Crescent Capital
mark.vitner@piedmontcrescentcapital.com · (704) 458-4000
Appendix: Retail Sales Detail
| Category | Oct. m/m | vs. Q3 avg. | 12-mo |
|---|---|---|---|
| Retail and food services, total | 0.2% | 1.2% | 6.8% |
| Retail trade | 0.2% | 1.2% | 6.8% |
| Control group | 0.6% | 1.5% | 5.6% |
| Motor vehicle and parts dealers | -1.6% | -1.5% | 1.3% |
| Furniture and home furnishings | -2.3% | 0.1% | 2.5% |
| Electronics and appliances | 0.0% | 0.8% | 7.7% |
| Building materials and garden | 0.5% | 0.0% | 5.6% |
| Food and beverage stores | -0.2% | 0.3% | 0.9% |
| Health and personal care | 1.5% | 2.6% | 1.0% |
| Gasoline stations | 1.5% | 6.7% | 30.3% |
| Clothing and accessories | -0.7% | -0.3% | 3.1% |
| Sporting goods, hobby, book and music | -0.7% | -0.4% | 7.1% |
| General merchandise | 0.1% | 0.3% | 3.5% |
| Miscellaneous store retailers | 4.7% | 3.7% | 13.3% |
| Nonstore retailers | 1.2% | 3.0% | 11.8% |
| Food services and drinking places | 0.2% | 1.3% | 7.0% |
Computation notes: The control group is total retail and food services less motor vehicle and parts dealers, gasoline stations, building material and garden equipment dealers, and food services and drinking places, all seasonally adjusted; Census does not publish it directly. The third-quarter average uses the November 17 release for August and September and the October 15 release for July, and series history before August reflects the October 15 vintage. Contributions use September’s level as the base. The annualized fourth-quarter pace is the October level divided by the third-quarter average, raised to the fourth power, minus one, in nominal terms, and assumes November and December hold at October’s level. The three-month annualized rate compares the August-October average with the May-July average. Real series deflate the control group by the CPI for commodities less food and energy commodities; no October 2025 CPI was collected, so first-quarter real growth uses a two-month fourth-quarter 2025 average. The income proxy is the BLS index of aggregate weekly payrolls for all private employees, which equals aggregate weekly hours times average hourly earnings, and it is deflated by the seasonally adjusted CPI for all items. We tested it against BEA wages and salaries for June 2025 through September 2026. The advance report is a subsample of about 4,800 firms, replaced about a month later by the full Monthly Retail Trade Survey sample of about 13,000; Census puts the average absolute revision at two-tenths of a percentage point. Consensus forecasts of 0.2% for headline sales and 0.4% for the control group come from published previews and are not a single survey. Series history in the exhibits reflects Census’s benchmark revision of September 28, 2026.
Sources: U.S. Census Bureau, Advance Monthly Sales for Retail and Food Services, October 2026 (November 17, 2026) and September 2026 (October 15, 2026); FRED; U.S. Bureau of Labor Statistics, Employment Situation, Consumer Price Index and Real Earnings, October 2026; U.S. Bureau of Economic Analysis, Personal Income and Outlays, September 2026; U.S. Energy Information Administration, retail gasoline prices; The Home Depot, third-quarter fiscal 2026 results (November 17, 2026); National Retail Federation, 2026 holiday forecast (October 15, 2026), holiday survey (October 20, 2026) and CNBC/NRF Retail Monitor (November 11, 2026); Adobe Digital Insights, 2026 holiday forecast (September 28, 2026) and Prime Big Deal Days results (October 8, 2026); PwC Holiday Outlook 2026; Amazon, Prime Big Deal Days 2026; Piedmont Crescent Capital. Next release: Census advance retail sales for November, December 16, 2026.
Disclaimer: This report is provided for informational purposes only and does not constitute investment, legal, tax or accounting advice. Information is believed to be reliable but is not guaranteed. Opinions are those of the author as of the date of publication and are subject to change without notice.