
The Price of Capital Comes Due
Alphabet had its worst day since its 2004 IPO, Intel its worst since 1974, and the Nasdaq its worst month since March 2025, in a week when the economy grew 3.4%. Investors that paid for AI spending on faith are now asking what it earns, with the 10-year Treasury near 5%.
This issue covers the Fed’s October 28 hold, the advance third-quarter GDP estimate, September income and inflation, this week’s central bank decisions and Friday’s technology selloff. Friday levels for yields, oil and gold are afternoon quotes, labeled as such.
MARKET DASHBOARD
(as of Friday, October 30, unless noted)
| Rates, Credit & Data | Equities & Commodities | ||
|---|---|---|---|
| Fed funds target range | 3.75%-4.00% (held Oct. 28, 10-2 vote) | S&P 500 | 7,578.97 (-1.83% Fri.) |
| 2-yr Treasury | 4.57% (Fri. 2:31 p.m. quote) | Dow Jones | 51,785.82 (-1.06% Fri.) |
| 10-yr Treasury | 4.92% (Fri. quote; 5.04% intraday Wed.) | Nasdaq Composite | 25,442.31 (-2.84% Fri.) |
| 30-yr Treasury | 5.30% (Fri. quote) | Russell 2000 | 2,801.16 (-2.03% Fri.) |
| 2s-10s spread | 35 bp (Fri. quotes) | VIX | about 21.4 (+24% Fri.) |
| Dec. 9 hike odds (futures) | about 85% (Oct. 28) | Brent crude (January) | about $113.4 (+2.4% Fri.) |
| Real GDP, Q3 advance | +3.4% annual rate (Q2: 2.2%) | WTI crude (Dec) | about $104.1 (+2.1% Fri.) |
| PCE prices (Sept., y/y) | 3.6% (core 3.1%) | Gold (spot) | $3,878 (-3.6% Fri.) |
| Real disposable income (Sept.) | -0.3% m/m (saving rate 3.8%) | Bitcoin | about $77,000 (-3% Fri.) |
| ECI wages (Q3, y/y) | 3.1% (lowest since Q1 2021) | EUR/USD; USD/JPY | 1.1167; 157.46 (Fri. quotes) |
| Conf. Board confidence (Oct.) | 91.7 (from 84.2) | UMich sentiment (Oct., final) | 48.0 (from 48.1) |
Note: Equity closes are from TheStreet for Friday, October 30. Treasury yields, oil, gold and currencies are Friday afternoon wire quotes, not official closes; the Treasury’s daily par yield curve for Friday posts on the next business day. The funds-rate and futures figures are from the October 28 meeting. The spread is our calculation from the Friday quotes.
SUMMARY
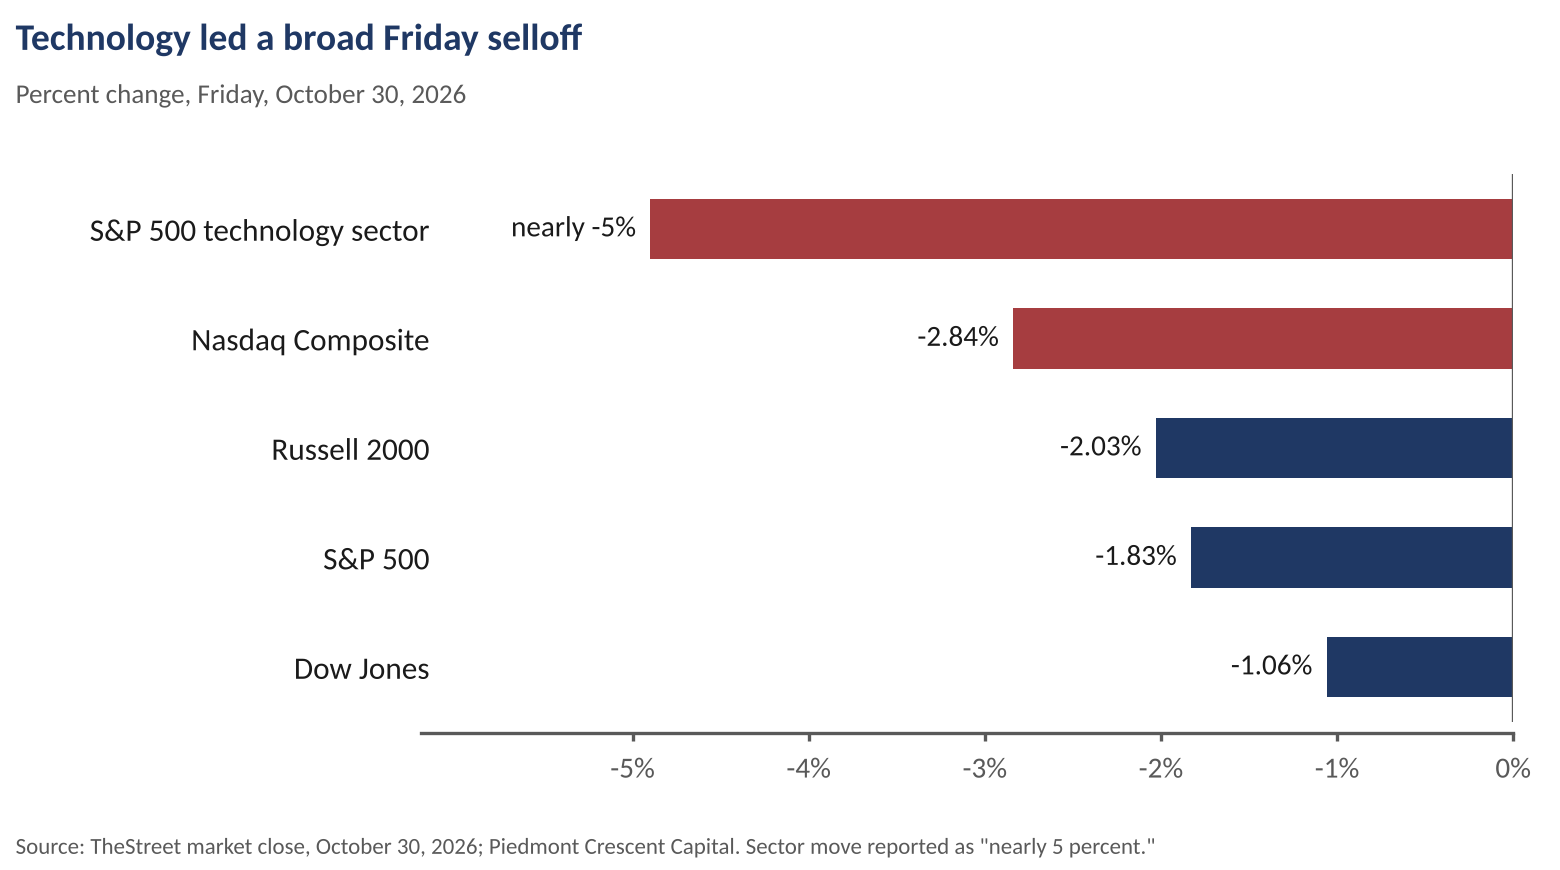
Wall Street ended a hard week and a hard month on Friday. The S&P 500 fell 1.83% to 7,578.97, the Nasdaq Composite fell 2.84% and the S&P 500 technology sector dropped nearly 5%, leaving the Nasdaq 100 roughly 10% below its peak, a technical correction. The trigger was earnings. Alphabet fell 12.6% on Thursday, its worst day since it went public in 2004, after search growth slowed and free cash flow turned negative. Intel then lost about 29% on Friday, its worst day since 1974, and Reddit lost about a quarter of its value on a warning that AI is cannibalizing parts of its business. Treasuries rallied, with the 10-year near 4.92% on Friday against 5.04% intraday on Wednesday, and gold fell 3.6% as the selling reached assets that had been working. Bitcoin dropped about 3% after a $6.3 billion hack of the Binance exchange.
The economy underlying Friday’s selloff was not weak. Real GDP grew at a 3.4% annual rate in the third quarter, up from 2.2% in the second, and real final sales to private domestic purchasers rose 4.9%, led by information-processing equipment and inventories. Households told a different story. September’s PCE price index rose 0.5% and is up 3.6% from a year ago, with core at 3.1%, while real disposable income fell 0.3% and the saving rate stood at 3.8%. The Employment Cost Index showed wages and salaries up just 3.1%, the slowest since early 2021 and well behind inflation. The Fed held the funds rate at 3.75%-4.00% on a 10-2 vote, with Governor Lisa Cook and Cleveland Fed President Beth Hammack dissenting in favor of a quarter-point hike. The statement upgraded economic activity to “strong,” and futures put the odds of a December 9 hike at about 85%.
The world did its part to keep nerves frayed. Brent’s January contract settled at $113.43 on Friday, with the expiring December contract at $117.64, and WTI settled at $104.12, both finishing a fourth straight monthly gain, after tankers were hit by mines and explosives in the Strait of Hormuz in a war now in its ninth month. President Trump has said the war will end soon and that the U.S. would not strike Iran before Tuesday’s midterm elections, and the Pentagon is reportedly preparing options for afterward, while Qatari mediators are back in Tehran. Over the weekend Trump said only “one or two” targets remain, and Secretary of State Rubio said no decision has been made. The Bank of Canada raised its policy rate a quarter point to 2.50%, the ECB held its deposit rate at 2.50% with euro-area inflation at 3.8%. Christine Lagarde announced she will resign as head of the ECB effective February 7, 2027. The Bank of Japan held at 1.25% while keeping a December hike open. Israel’s election left the governing coalition with 53 of 120 seats and the opposition with 67, but 19 of those belong to Arab parties the Jewish opposition has said it will not work with, so neither bloc has a clear majority.
THE WEEK’S KEY INSIGHT
Friday’s selloff is the price of capital arriving at the companies that use the most of it
The pattern in this week’s earnings was consistent, and it was not about demand. Google Cloud revenue rose 103% to $30.7 billion and its operating margin reached 36.2%. Amazon Web Services grew 39%, and Microsoft’s Azure grew 48%. Nevertheless, Alphabet lost $482 billion of market value in a day. Search and other revenue grew 12%, against 15% expected and 17% in the second quarter, capital spending was $51.4 billion, more than double a year earlier, and free cash flow was negative $9.1 billion. Amazon plans about $220 billion of cash capital spending this year, and its trailing 12-month free cash flow was an outflow of $42.4 billion, against an inflow of $14.8 billion a year ago. Revenue is growing at the rate AI bulls promised. What is being repriced is the return on the money spent to get it (Exhibits 1 and 2).
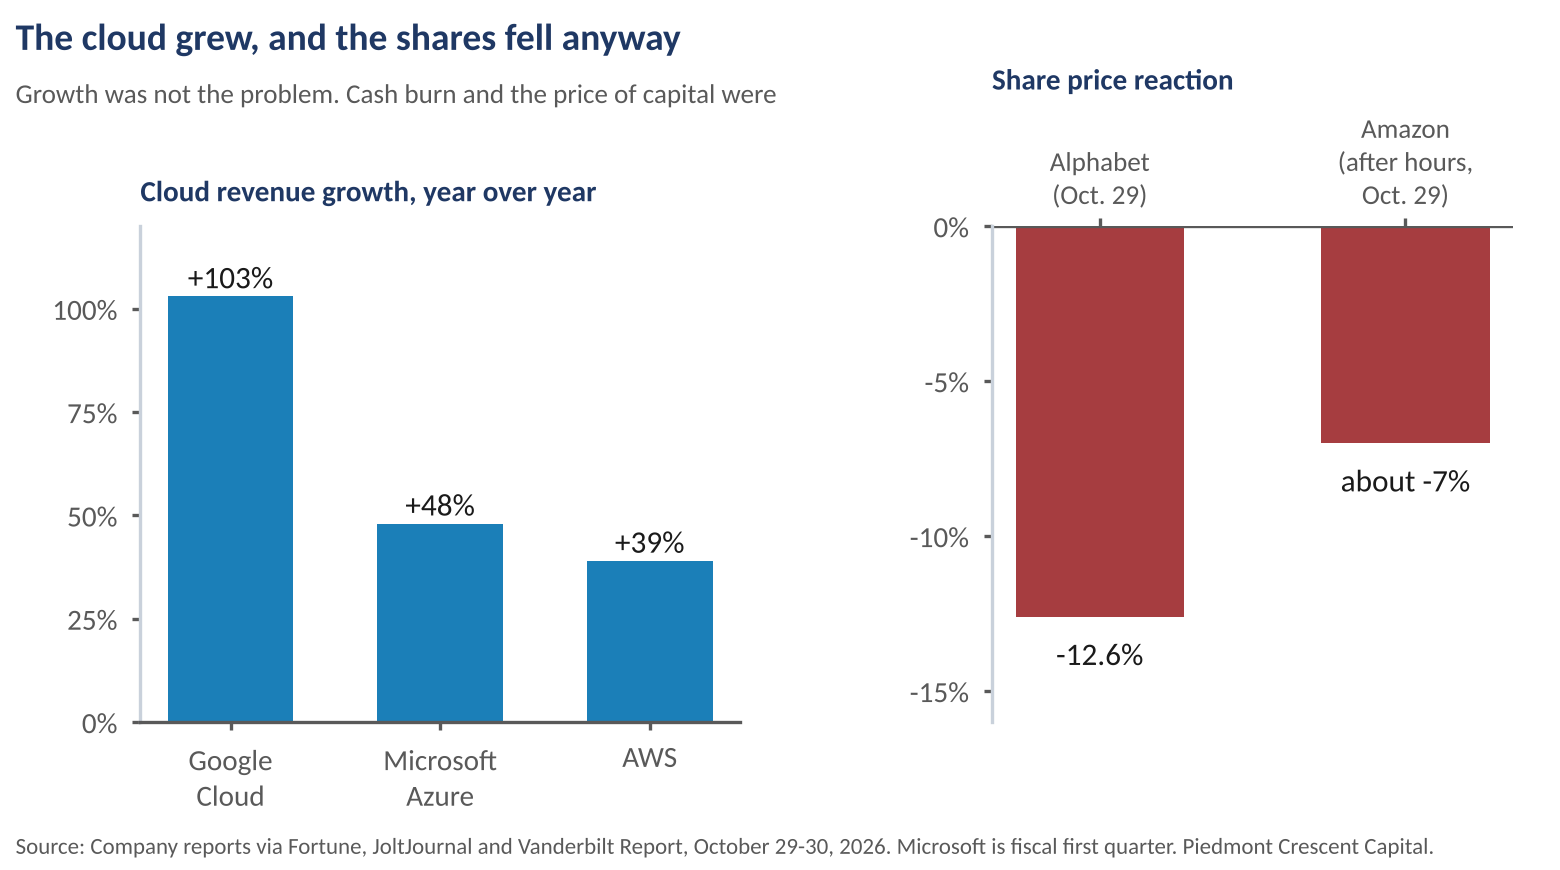
That is the logic of our most recent Piedmont Perspective, updated last Monday, played out in the stock market. With the 10-year Treasury at 4.92%-5.04%, the expected real yield near 2.2% and the funds rate headed up, capital is no longer inexpensive, and a business that consumes it faster than it generates cash has to earn more on it than it did when money cost 2%. The same demand for capital that pushed yields to 5% is now disciplining the spenders. Investors have moved from paying for capital spending to asking what it returns, and the first answers, from a search franchise growing more slowly and from companies such as Reddit warning that AI cannibalizes their own products, were less promising than expected.
Five things explain why the unease went beyond a few earnings reports:
- Payback. Hyperscaler capital spending is running near $725 billion this year, and investors want free cash flow, not just growth.
- The price of money. The 10-year is within a few basis points of 5%, and two Fed voters wanted to hike this week.
- Oil. Brent near $113 is a tax on every household and a cost for every airline, trucker and manufacturer, and Washington has signaled that strikes on Iran may resume after Tuesday.
- Paychecks. Real disposable income fell 0.3% in September and wage growth is below inflation, so consumers are carrying the economy on a 3.8% saving rate.
- Politics. The midterms on Tuesday, a contested Fed, and the administration’s ongoing effort to remove Governor Cook add event risk.
The week also showed why the K-shaped label is too small for what we are seeing. A K describes one split, households by income, and even that one is contested: the Minneapolis Fed’s review of the spending data finds the top 10% of households accounting for anywhere from 23% of spending (BLS) to more than 45% (Moody’s), with New York Fed data showing retail spending growing at similar rates across income thirds. Friday’s tape split along other lines, and all at once: AI against everything else, with Google Cloud up 103% while Reddit warned that AI is cannibalizing its business; technology against the rest of the market, with the sector down nearly 5% and energy producers among the few bright spots; companies that borrow against those that do not, with Amazon’s trailing free cash flow at negative $42.4 billion; capital against labor, with workers’ share of income at 59.7% in the second quarter against 19.5% for capital; and younger households against older ones, which Tuesday’s exit polls may show. Those are the divides we describe in the Perspective below, and they are the reason a K, however accurate as far as it goes, will not be enough to plan around.
Two details argue that this is a repricing and not yet a panic. Treasuries rallied and gold fell, which is what liquidation and a flight to safety look like, not an inflation scare, and the economy that supports earnings, with final sales to private domestic purchasers up 4.9%, has not cracked. The risk is that a market priced for perfection keeps repricing while rates stay high, and that is a slower grind than a crash.
BEHIND THE NUMBERS
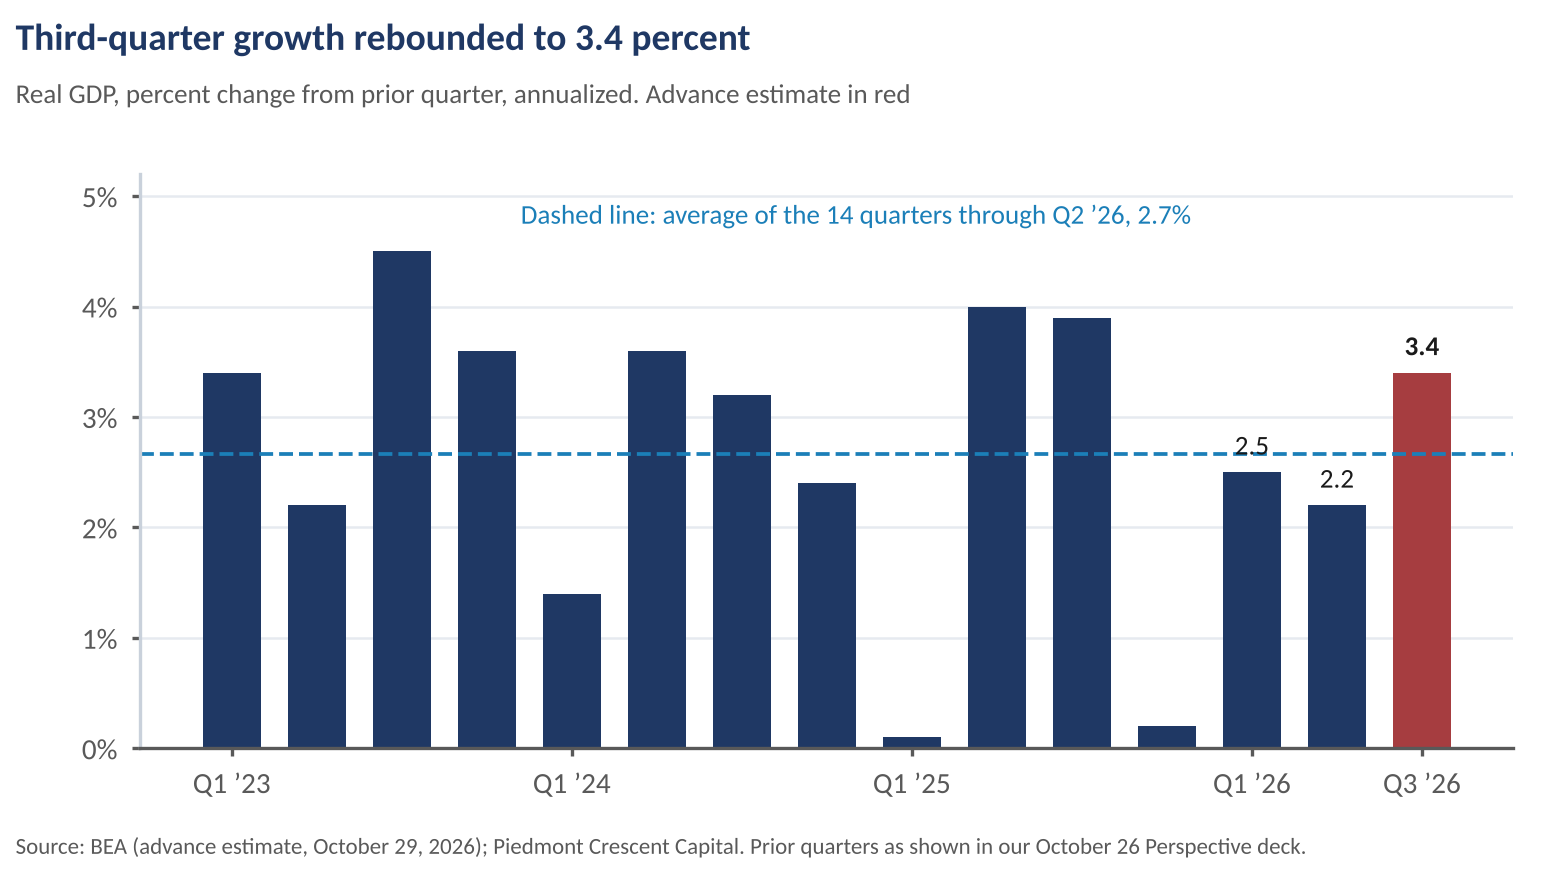
GDP. Third-quarter growth of 3.4% topped the 3.0% consensus and matched the 3.4% we published. The mix matters more than the headline. Private inventories and equipment, led by information-processing gear, drove the gain, government spending rose because the Strategic Petroleum Reserve sold less oil, and net exports subtracted as petroleum exports fell. Real consumer spending rose less than 0.1% in September. This is the employment-light, capital-intensive expansion we have described all year, and it is the same spending the stock market began questioning on Thursday (Exhibit 3).
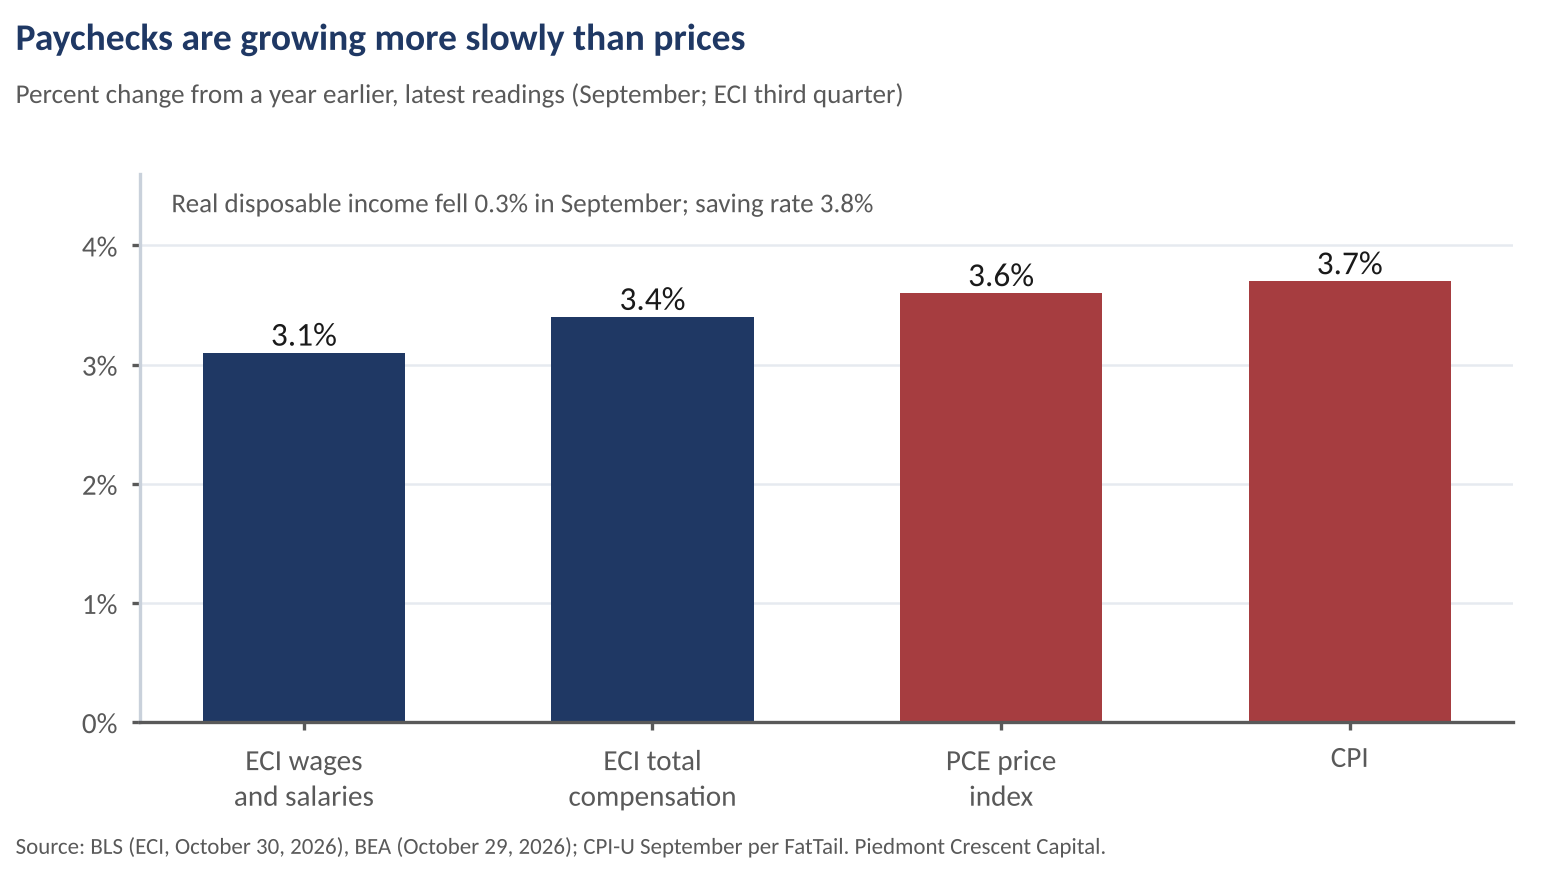
Income. Wages and salaries in the Employment Cost Index rose 3.1% over the year and total compensation 3.4%, against PCE inflation of 3.6% and CPI inflation near 3.7%, so wages are trailing prices by about half a point. Our October 26 slides showed the same thing from other angles: hourly earnings up 3.0% against CPI inflation of 3.7%, and workers’ share of income at 59.7% in the second quarter against 19.5% for capital. A saving rate of 3.8% leaves little cushion if hiring slows (Exhibit 4).
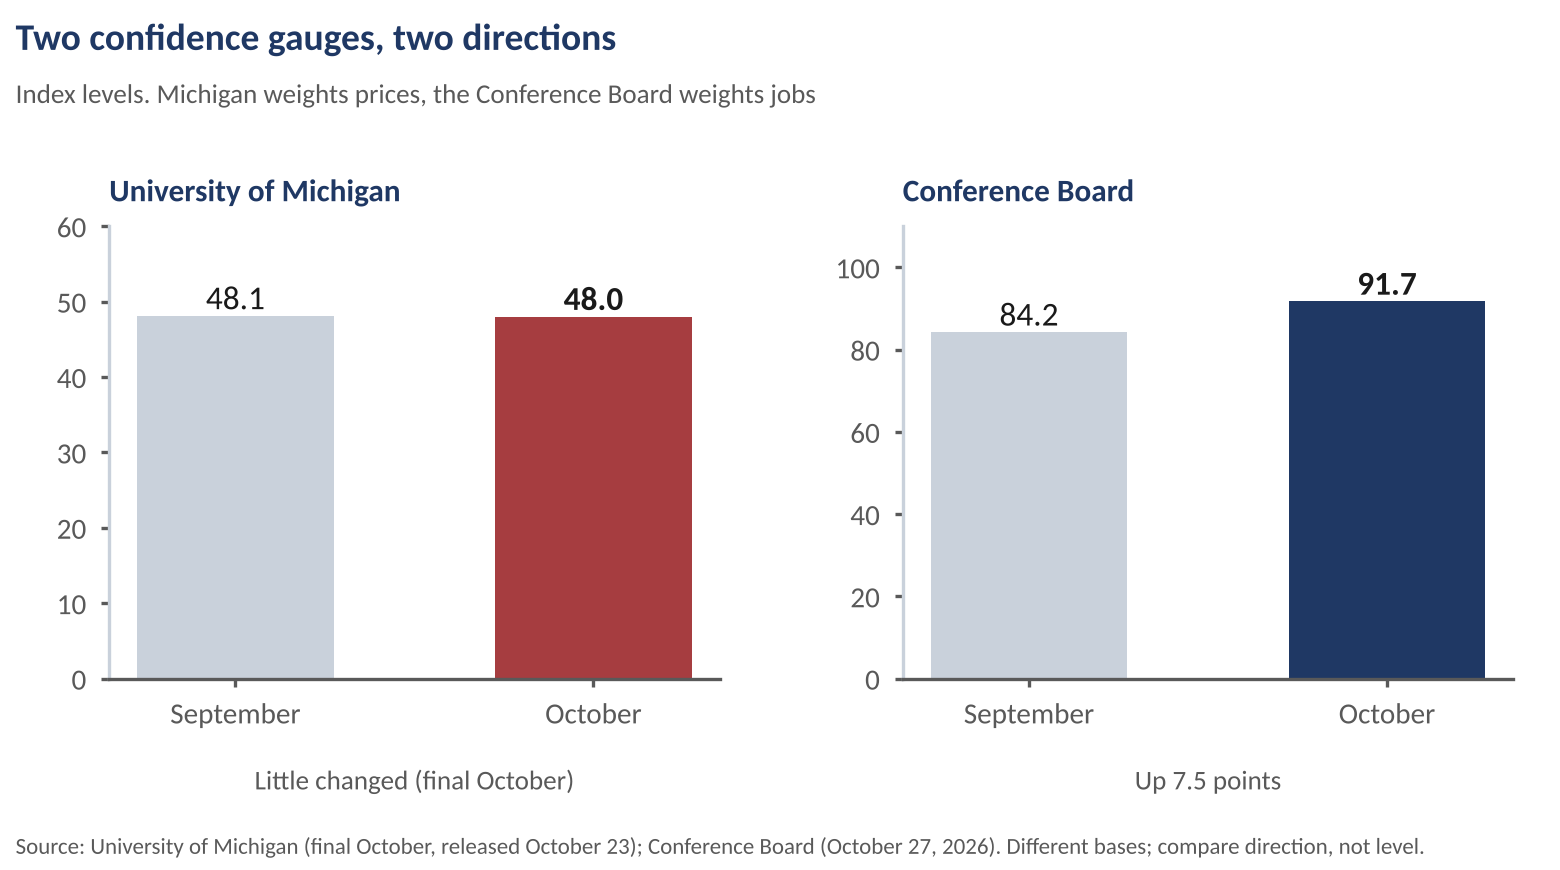
Consumer confidence. The two main gauges moved in opposite directions. The Conference Board index jumped 7.5 points to 91.7, well above the 81.0 consensus, with its present-situation index at 120.4, but its expectations index, 72.6, remains below the 80 level that has historically been consistent with recession. The University of Michigan’s final October sentiment index was 48.0, a touch below September’s 48.1 and revised up from the 46.3 preliminary reading. Current conditions fell to 46.7 from 50.9, expectations rose to 48.8 from 46.3, and one-year and long-run inflation expectations were 4.7% and 3.5%. The Conference Board leans toward jobs, and Michigan toward prices. With layoffs near historic lows, households feel secure about employment prospects, but remain perplexed as to whether or not they will earn enough to pay their bills (Exhibit 5).
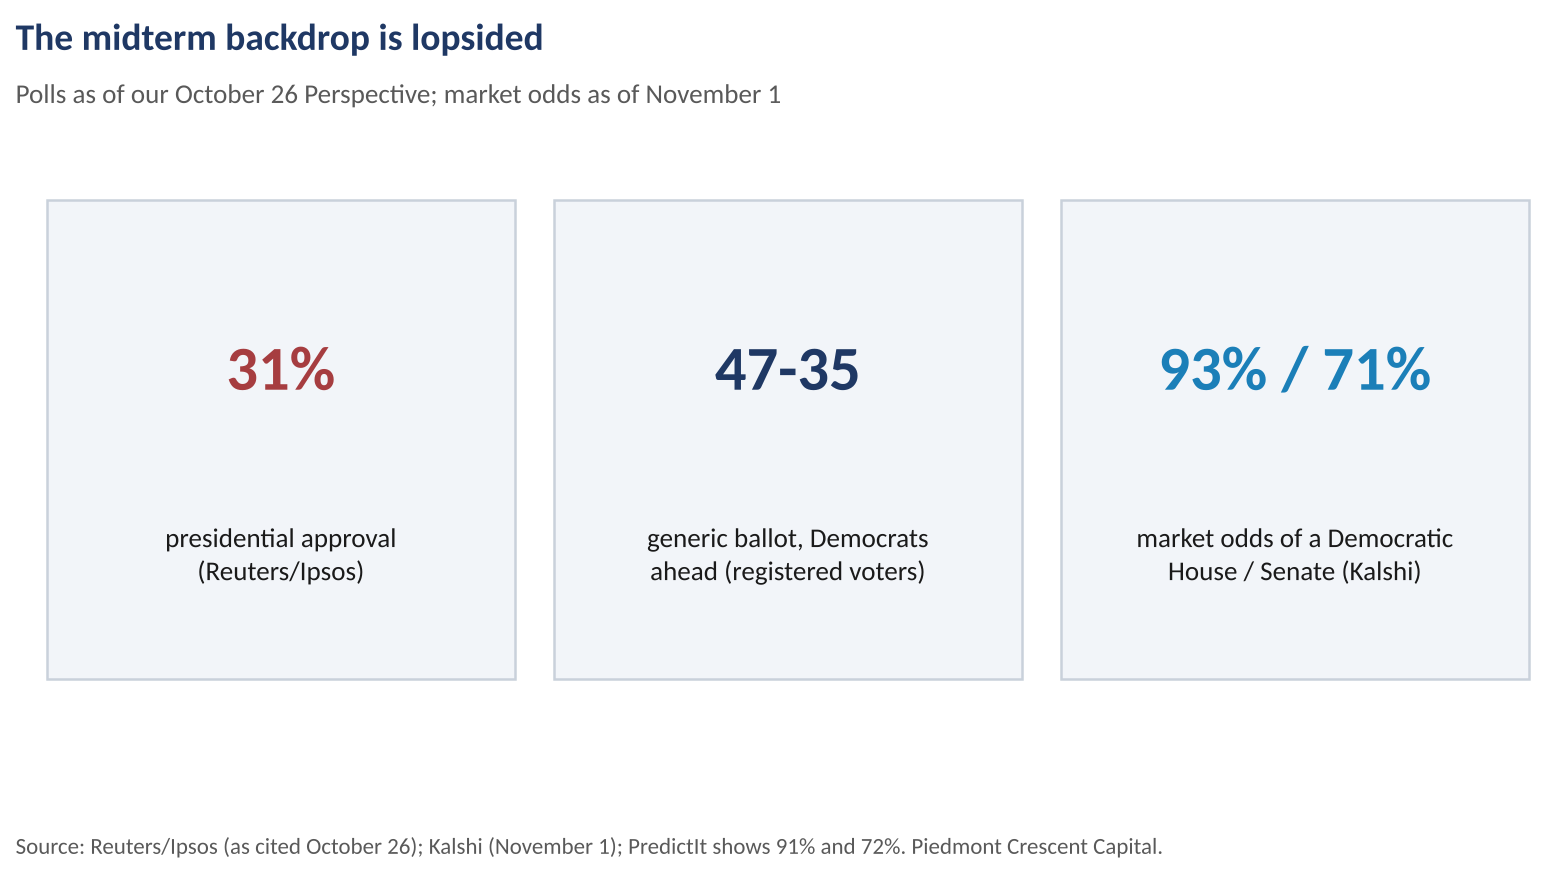
The midterms. Tuesday’s elections arrive with the president’s approval at 31% in Reuters/Ipsos polling, Democrats ahead 47-35 on the generic ballot, and prediction markets at about 93% for a Democratic House and 71% for a Democratic Senate on Kalshi, with PredictIt at 91% and 72%. Our income framework, which reads a midterm through real after-tax income per person in the year before the vote, pointed to larger losses for the president’s party, and September’s 0.3% drop in real disposable income does not argue otherwise. Michigan’s survey of 2,129 consumers found 67% expecting a Democratic House and 52% a Democratic Senate, and 53% saying Democrats would be better for the economy against 17% for Republicans, a read on mood, not a seat forecast. We take no side, and the stakes are narrower than the volume suggests. Goldman Sachs’ November 1 preview sees a Democratic House of about 236 seats and a closer Senate, where polls sit within the margin of error. Most legislation needs 60 Senate votes and the president can veto, so control of either chamber mostly lets Democrats block rather than enact, and the first tests are fiscal: spending authority expires December 11, likely to be pushed into February or March, and the debt limit should bind in the first quarter. The preview sees little change in fiscal policy, with the impulse roughly neutral in 2027, and expects new tariff increases after the election to outweigh any rollback, lifting the effective rate by a little under 2 points. None of that changes our rate call (Exhibit 6).
Central banks. The Bank of Canada ended seven straight holds with a quarter-point increase to 2.50%, citing energy prices and expecting inflation near 3.5% by year-end. The ECB held at 2.50% and said it is not pre-committing to a path. French 10-year yields were near 5%, with the gap to Germany around 155 basis points, and ING estimates the rise in French yields since September has done the work of a 25 basis point hike in Germany. The Bank of Japan stayed at 1.25% and kept a December hike on the table, which markets put near 80% before the meeting. The world’s central banks are still leaning toward tightening.
BOTTOM LINE
We continue to expect the Fed to raise the funds rate a quarter point to 4.00%-4.25% on December 9, hold in January and deliver a second increase in March, taking the rate to 4.25%-4.50%. Futures put the odds of a December increase near 85%, two voters already wanted to move this week, and the Committee labeled economic activity “strong.” Friday’s selloff does not change that call by itself. A decline in technology shares reduces the wealth effect on spending, but it takes a break in credit markets, not a 10% correction in the Nasdaq 100, to move a Fed that is worried about inflation of 3.6%. Our call is ceteris paribus, as it is on every issue, and less is holding still than usual: the Hormuz situation, the midterms and the October jobs report on Friday can each move it. Tariff increases after the election would add to the goods-price pressure in our inflation path.
What would change our mind is a different kind of selling. Wider high-yield spreads, a failed corporate issue or a sharp rise in the unemployment rate would move our growth-scare scenario, which we carry at 10%, closer to the center. Meanwhile the risk to our base case is on the other side, because a disorderly auction or a gilt or JGB selloff would push the 10-year toward the 5.50%-6.25% term-premium range we assign a 20% probability.
Our tripwire is 4.60% on the 10-year Treasury. A close below that level on any day before the December 9 meeting would tell us the market has shifted from pricing scarce capital to pricing a growth scare, and we would cut our December hike probability to even odds. We will check it on December 9.
CFO AND TREASURERS CORNER
- Treat the rally in yields as a window, not a trend. The 10-year slipped to about 4.92% on Friday from 5.04% intraday on Wednesday, and Treasuries are headed for their best month since February 2025. A hike is priced at 85% for December. Use the dip to term out debt and extend maturities before the long end is repriced again.
- Stress-test any plan that depends on AI customer spending. If your revenue or receivables depend on hyperscalers, note that Amazon alone plans about $220 billion in capital spending this year and the market just punished the spending. Model a scenario in which orders slow down or stretch out, and check customer concentration in your credit exposure.
- Do not count on an equity window. The Nasdaq 100 is about 10% below its peak and the VIX jumped to about 21. Companies planning equity issuance, stock-funded acquisitions or an IPO should plan for a slower, pricier market and keep bank lines available.
- Hedge energy against a post-election risk, not a Friday headline. Brent near $113 and WTI near $104 are priced for risk that the U.S. resumes strikes on Iran after Tuesday. Hedge a larger share of the first-half 2027 fuel and freight budget now, and set a trigger for the rest, since either a deal or an escalation can move prices sharply.
- Review currency exposure country by country. The Bank of Canada hiked, the ECB held with its president leaving in February and French spreads near 155 basis points, and the Bank of Japan is leaning toward a December hike with the yen near 157. A single dollar hedge ratio is the wrong tool for that mix.
- Budget wages for retention, not acceleration. Wage growth in the ECI is the slowest since 2021, so a wage spiral is not the risk for 2027 budgets. The risk is that wages are trailing inflation by about half a point, which raises turnover among experienced staff just as entry-level hiring is thin.
PIEDMONT PERSPECTIVE
More Than a K: The Great Divide Runs Along Six Lines
Abridged and updated from our October 26 Perspective
The K-shaped economy has become the standard shorthand for an expansion that works for some and not for others, and as far as it goes it is right. It does not go far enough, however. A K describes one split, high-income households against low-income ones, and that is the split the data are least able to settle. The purpose of this series is to make the larger point. We see six divides running at once: capital against labor, high-income households against low-income ones, AI against everything else, technology against the rest of the stock market, sectors that borrow against sectors that do not, and younger households against older ones. Data center construction is up 73% from a year ago while private residential construction is down 5% and factory construction is down 20%, and homeownership is 78.6% for households 65 and older against 35.2% for those under 35. Seven key themes that we have repeatedly highlighted, not the economy at large or just the AI buildout, are producing the above-average real GDP growth.
Beneath the divides is what we call the Great Decoupling. Relationships that held for a generation have come loose: economic growth from hiring, policy rates from long-term yields, paychecks from prices, and markets from the mood on Main Street. This week’s data supports each. Real GDP grew 3.4% while payrolls have averaged about 41,000 a month, the funds rate is 3.75%-4.00% while the 10-year is near 5%, and wages are up 3.1% against inflation of 3.6%.
The center of our argument is the price of capital. About 71% of this year’s rise in the 10-year yield through September was a rise in the real rate, not in inflation expectations, and real yields now roughly equal real growth, which ends the arithmetic of low-cost debt that held for 15 years. Three forces push the same way: demand for capital from the AI buildout, government borrowing with deficits near 7.8% of GDP, and a security premium from the war with Iran. The Fed cannot add oil, build power plants or close a deficit, so the long end is set by supply, not by the funds rate.
This week made that abstract point concrete, and it did so along the divides above. When capital costs 5%, buyers of a capital-intensive expansion ask for returns, and the companies whose growth is real but whose cash generation does not cover their spending, Alphabet and Amazon among them, were repriced. Technology was 39.9% of the S&P 500 and up 27.4% this year as of October 23, while energy was up 52.6%, and concentration that high means a selloff in one sector moves the whole index.
We said the evidence is descriptive and that an AI productivity boom could rescue the older pattern. We would change our mind if the expected real 10-year yield fell back below 1% while inflation drifted toward 2%, or if payroll growth recovered above 100,000 a month with real GDP growth near 2%. Neither is in the data. The practical conclusion is to plan around the economy that exists, with capital that costs what it cost in the 2000s, not the 2010s, and to look past the K to the divides that decide who earns, who hires and who votes how.
THE WEEK AHEAD
Monday: The ISM Manufacturing PMI for October and September construction spending at 10:00 a.m. What would move us: prices-paid and delivery-times readings that keep rising alongside softer activity would fit the energy shock and argue against the Fed looking through it.
Tuesday: Midterm elections, with September JOLTS and factory orders at 10:00 a.m. The AP does not call a chamber until a party reaches 218 House or 51 Senate seats, and in 2022 the Senate took four days and the House eight, so a slow count is plausible. What would move us: a Democratic House alone raises the odds of a standoff over the December 11 spending deadline and a first-quarter debt limit, while a sweep would also cut the odds of further reconciliation bills and the Treasury supply that comes with them.
Wednesday: ADP employment, the trade balance and the ISM Services PMI, plus the Treasury quarterly refunding announcement and Israel’s final election certification. What would move us: a larger share of issuance in longer maturities with the 10-year near 5% would push up the term premium.
Thursday: Bank of England decision, third quarter productivity and costs, and remarks from Cleveland Fed President Hammack, who dissented for a hike. What would move us: a vote split at the BOE and any comment on gilt yields near 5.28%.
Friday: The October employment report at 8:30 a.m., with consensus of roughly 50,000 to 56,000 against our fourth-quarter average of 62,000, and the preliminary November Michigan survey at 10:00 a.m. What would move us: payrolls below zero would raise the growth-scare odds, while a figure above 100,000 would challenge our view that break-even is zero to about 50,000 and support an earlier hike. The jobs numbers are volatile at these low levels, however, and an upside surprise is often offset by downward revisions to previous data.
Watch also for the U.S. decision on Iran after Tuesday. Rubio says no decision has been made, and Iran’s foreign minister says a new proposal could reopen the strait within two days. October CPI follows on November 10.
U.S. ECONOMIC AND FINANCIAL OUTLOOK
Our latest forecast carries the third-quarter GDP advance of 3.4%, matching the 3.4% we published in our last weekly, and keeps the December and March hikes. CPI rises to 3.9% in the fourth quarter from 3.5% in the third. We see Brent at $105 from $91. We peg fourth-quarter real GDP growth at 3.1%, with payrolls rising 62,000 a month, up from 51,000.
U.S. Economic & Financial Outlook
Piedmont Crescent Capital • November 1, 2026 vintage; Q3-26 GDP is the BEA advance estimate
| Indicator | Units | 2024 | 2025 | 2026F | 2027F | Q1-26 | Q2-26 | Q3-26 | Q4-26F | Q1-27F | Q2-27F | Q3-27F | Q4-27F |
|---|---|---|---|---|---|---|---|---|---|---|---|---|---|
| Output | |||||||||||||
| Real GDP | % q/q SAAR | 3.0 | 2.3 | 2.3 | 2.6 | 2.5 | 2.2 | 3.4 | 3.1 | 2.2 | 2.7 | 2.8 | 2.7 |
| 4th Qtr-to-4th Qtr, Yr/Yr for Qtly Data | % YoY | 2.6 | 2.0 | 2.8 | 2.6 | 2.6 | 2.2 | 2.1 | 2.8 | 2.7 | 2.9 | 2.7 | 2.6 |
| Final Sales to Private Domestic Purchasers | % q/q SAAR | 3.1 | 2.8 | 2.9 | 2.9 | 1.8 | 4.6 | 4.9 | 3.5 | 2.6 | 2.9 | 2.8 | 2.6 |
| Consumer Spending | % q/q SAAR | 2.9 | 2.6 | 2.5 | 2.0 | 0.7 | 3.8 | 3.8 | 2.8 | 1.8 | 2.2 | 2.1 | 2.0 |
| Nonresidential Fixed Investment | % q/q SAAR | 3.9 | 5.4 | 6.2 | 4.6 | 9.9 | 9.0 | 12.7 | 8.5 | 7.2 | 6.5 | 6.2 | 5.4 |
| Residential Investment | % q/q SAAR | 3.2 | -2.7 | -1.8 | -1.1 | -7.6 | 0.0 | -3.3 | -4.5 | -3.5 | -2.0 | 0.5 | 1.0 |
| Industrial Production, Manufacturing | % YoY | -0.9 | 1.0 | 1.7 | 2.9 | 1.0 | 1.7 | 1.3 | 3.0 | 3.2 | 2.5 | 2.9 | 3.1 |
| Light Vehicle Sales | Mil. units, SAAR | 15.9 | 16.3 | 16.1 | 16.4 | 15.5 | 16.5 | 16.2 | 16.4 | 16.4 | 16.3 | 16.5 | 16.5 |
| Labor Market | |||||||||||||
| Unemployment Rate | % | 4.0 | 4.3 | 4.2 | 4.0 | 4.3 | 4.3 | 4.1 | 4.1 | 4.1 | 4.0 | 4.0 | 3.9 |
| Nonfarm Payrolls | Avg. mo. chg, thous. | 150 | 62 | 67 | 76 | 73 | 81 | 51 | 62 | 68 | 75 | 80 | 80 |
| Employment Cost Index | % YoY | 3.9 | 3.5 | 3.4 | 3.5 | 3.4 | 3.4 | 3.4 | 3.4 | 3.5 | 3.4 | 3.5 | 3.5 |
| Housing Market | |||||||||||||
| Housing Starts | Thous. units, SAAR | 1,370 | 1,356 | 1,345 | 1,370 | 1,418 | 1,345 | 1,293 | 1,340 | 1,330 | 1,350 | 1,360 | 1,360 |
| New Home Sales | Thous. units, SAAR | 684 | 679 | 646 | 638 | 622 | 652 | 668 | 640 | 630 | 630 | 640 | 650 |
| Existing Home Sales | Thous. units, SAAR | 4,060 | 4,060 | 4,014 | 4,010 | 4,043 | 4,120 | 3,993 | 3,900 | 3,950 | 4,000 | 4,030 | 4,060 |
| Case-Shiller National Home Prices | % YoY | 5.1 | 2.2 | 1.5 | 2.3 | 0.9 | 1.3 | 2.0 | 1.8 | 2.1 | 2.3 | 2.5 | 2.6 |
| Inflation | |||||||||||||
| Consumer Price Index (CPI) | % YoY | 3.0 | 2.6 | 3.5 | 2.6 | 2.7 | 3.8 | 3.5 | 3.9 | 3.5 | 2.4 | 2.6 | 2.6 |
| Core CPI | % YoY | 3.4 | 2.8 | 2.6 | 2.4 | 2.5 | 2.7 | 2.5 | 2.8 | 2.7 | 2.3 | 2.8 | 2.8 |
| PCE Deflator | % YoY | 2.6 | 2.6 | 3.4 | 2.9 | 3.0 | 3.6 | 3.5 | 3.6 | 3.2 | 2.9 | 2.7 | 2.7 |
| Core PCE Deflator | % YoY | 2.9 | 2.8 | 3.1 | 2.7 | 3.0 | 3.1 | 3.1 | 3.2 | 2.9 | 2.6 | 2.6 | 2.6 |
| Interest Rates & Markets | |||||||||||||
| Fed Funds Target Range | Avg. / range, % EOP | 5.14 | 4.21 | 3.63 | 4.06 | 3.5-3.75 | 3.5-3.75 | 3.75-4 | 4-4.25 | 4.25-4.5 | 4.25-4.5 | 4.25-4.5 | 4.25-4.5 |
| 2-Year Treasury | % (period end) | 4.37 | 3.81 | 3.92 | 4.06 | 3.78 | 4.14 | 4.88 | 4.75 | 4.60 | 4.50 | 4.40 | 4.38 |
| 10-Year Treasury | % (period end) | 4.21 | 4.29 | 4.80 | 4.93 | 4.35 | 4.44 | 5.29 | 5.10 | 5.10 | 4.95 | 4.85 | 4.80 |
| 30-Year Mortgage Rate | % (period end) | 6.72 | 6.60 | 6.71 | 6.95 | 6.10 | 6.49 | 7.03 | 7.20 | 7.10 | 7.00 | 6.90 | 6.80 |
| Brent Crude | $/bbl, period avg | 79.91 | 68.32 | 93.62 | 87.67 | 78.00 | 100.20 | 91.27 | 105.00 | 91.67 | 88.00 | 86.00 | 85.00 |
| Trade-Weighted Dollar Index | Period average | 122.9 | 122.7 | 119.9 | 122.9 | 119.1 | 119.3 | 119.6 | 121.8 | 122.0 | 122.6 | 123.3 | 123.6 |
| % chg, period | % chg | 1.7 | -0.1 | -2.3 | 2.4 | -1.4 | 0.2 | 0.2 | 1.9 | 0.2 | 0.4 | 0.5 | 0.2 |
| Government, Trade & Inventories | |||||||||||||
| Government | % q/q SAAR | 4.5 | 1.6 | 0.1 | 1.1 | 4.7 | -0.1 | 5.3 | 2.4 | 0.8 | 1.1 | 1.2 | 1.2 |
| Net Exports (percentage point impact) | Percentage points | -0.54 | 0.30 | -0.10 | -0.76 | -0.04 | -1.10 | -3.32 | -0.73 | -1.44 | -0.96 | -0.63 | 0.00 |
| Inventories (percentage point impact) | Percentage points | -0.20 | -0.20 | -0.13 | 0.36 | 0.18 | -0.53 | 1.61 | 0.70 | 0.31 | 0.35 | 0.39 | 0.39 |
Source: Piedmont Crescent Capital, BLS, BEA, Census, Federal Reserve, EIA. Forecast values are shaded. Dollar-denominated lines are omitted from this draft.
Mark P. Vitner
President & Chief Economist, Piedmont Crescent Capital
mark.vitner@piedmontcrescentcapital.com · 704-458-4000
SOURCES AND NOTES
Sources. Bureau of Economic Analysis (Gross Domestic Product, Advance Estimate, Third Quarter 2026, and Personal Income and Outlays, September 2026, both October 29, 2026); Bureau of Labor Statistics (Employment Cost Index, third quarter 2026, October 30, 2026); Federal Reserve (FOMC decision and Chair Warsh press conference, October 28, 2026, via Admiral Markets); Conference Board (Consumer Confidence, October 27, 2026, via Verified Investing); University of Michigan (final October survey, October 23; “Expected Outcomes and Economic Implications of Midterm Elections,” October 30; “Risks of Entrenchment,” October 23); TheStreet (final Michigan figures); FatTail (ECI real-wage comparison and September CPI-U); Bloomberg via SWI swissinfo.ch (Nasdaq 100 selloff markets wrap, October 30); TheStreet (stock market close, October 30); Yahoo Finance (market live blog, October 30); Fortune (Alphabet, October 29); JoltJournal (Amazon third quarter); Vanderbilt Report (week in review, October 26-30); Newsquawk (central bank week in focus); Kalshi and PredictIt (market odds, October 31 to November 1); Goldman Sachs Global Investment Research (U.S. Economics Analyst, November 1); Reuters via Korea Times (oil settlements, October 30); ICE Futures Europe (expiry calendar); Minneapolis Fed (“Have U.S. Consumers Gone K-Shaped?”); Fox News and Times of Israel (live coverage, October 31); Rio Times (Bank of Canada, October 28); Euronews (ECB, October 29); The National and Fox News (oil prices and Hormuz, October 30).
Market data. Equity index closes for Friday, October 30 from TheStreet. Treasury yields, oil, gold, bitcoin and currencies are Friday intraday or afternoon quotes from TheStreet, Yahoo Finance and Bloomberg via SWI and are not official closes. Brent is the January 2027 contract, now the front month after the December contract expired on Friday at $117.64. Figures reported differently by sources, including Friday’s S&P 500 move, were reconciled to TheStreet.
Calculations. The 2s-10s spread, the 2.7% average of 14 quarters of GDP growth and the characterization of pay against prices are our calculations from the sources above. GDP history through the second quarter of 2026 is as shown in our October 26 presentation.