
Consumer Confidence Report: Business Conditions Turn Negative
The Conference Board index fell 6.7 points to 81.9 as all five of its components deteriorated, and fuel prices dominated what respondents wrote in.
Early Signal
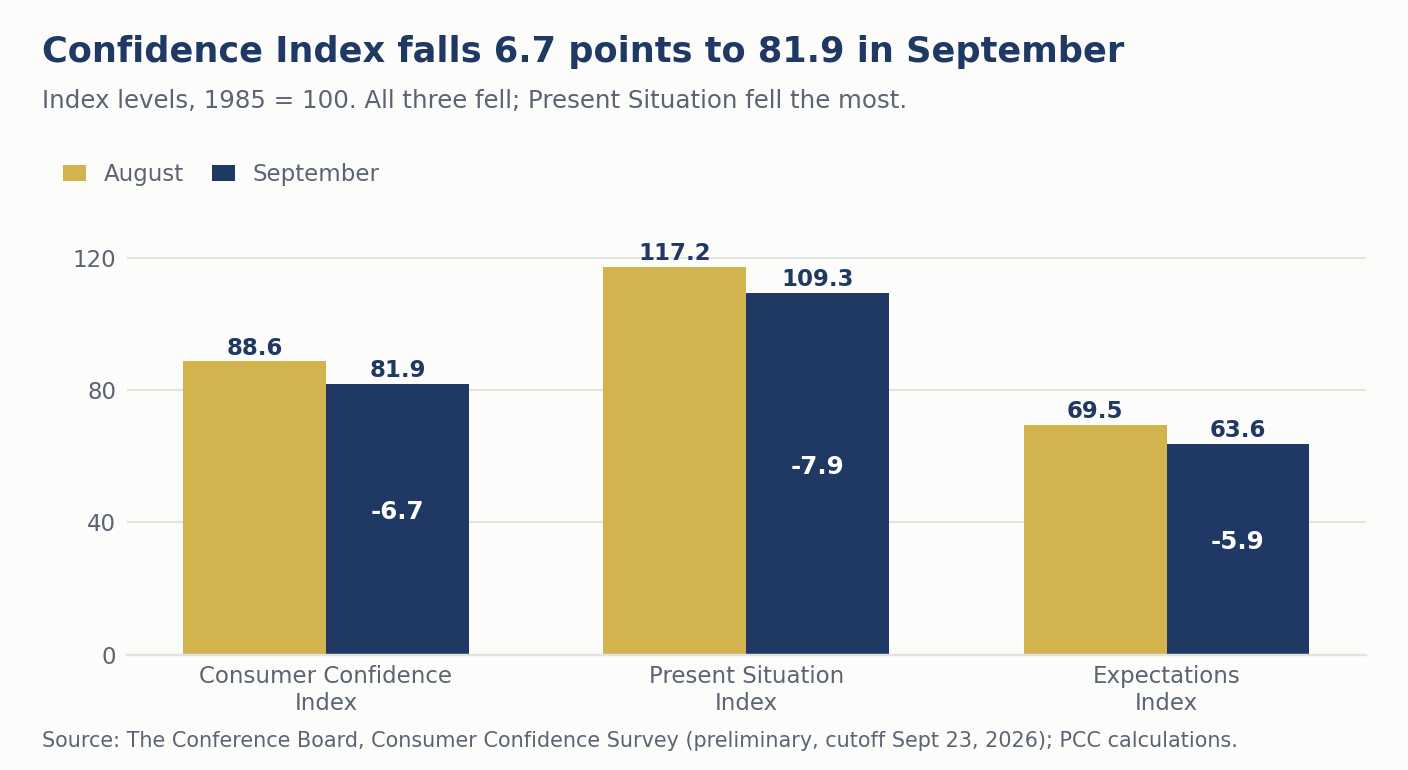
- Confidence fell 6.7 points to 81.9. The Consumer Confidence Index was 88.6 in August. The release follows two prior months of softening.
- The Present Situation Index fell 7.9 points to 109.3, the larger of the two declines. The Expectations Index fell 5.9 points to 63.6, its third consecutive monthly decline.
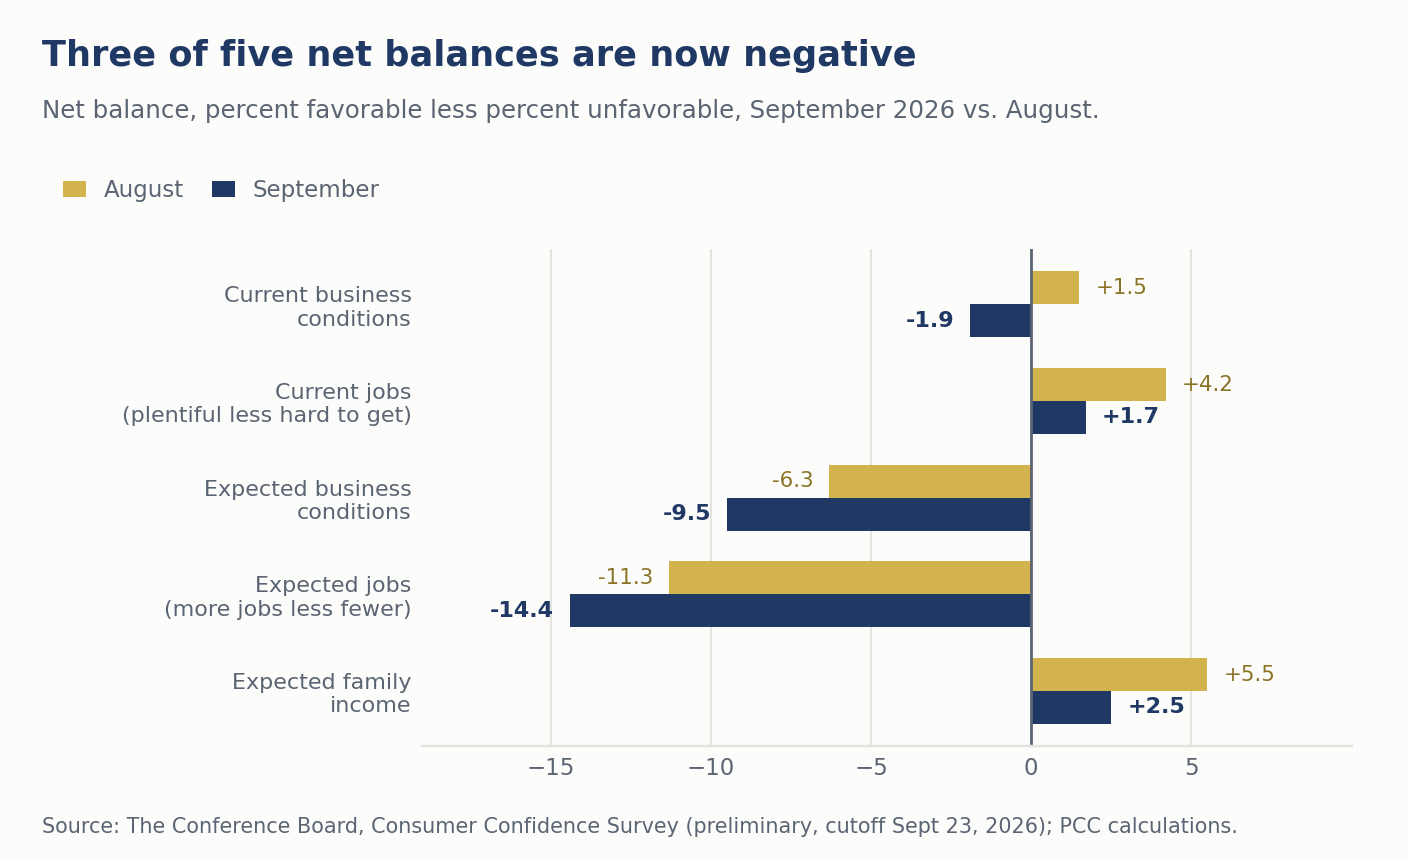
- Current business conditions turned net negative for the first time since September 2024. The net balance fell 3.4 points to -1.9%, and the move came almost entirely from more households saying conditions are bad.
- The labor market differential narrowed to +1.7%, from +4.2%. Households saying jobs are plentiful (23.6%) barely outnumber those saying jobs are hard to get (21.9%).
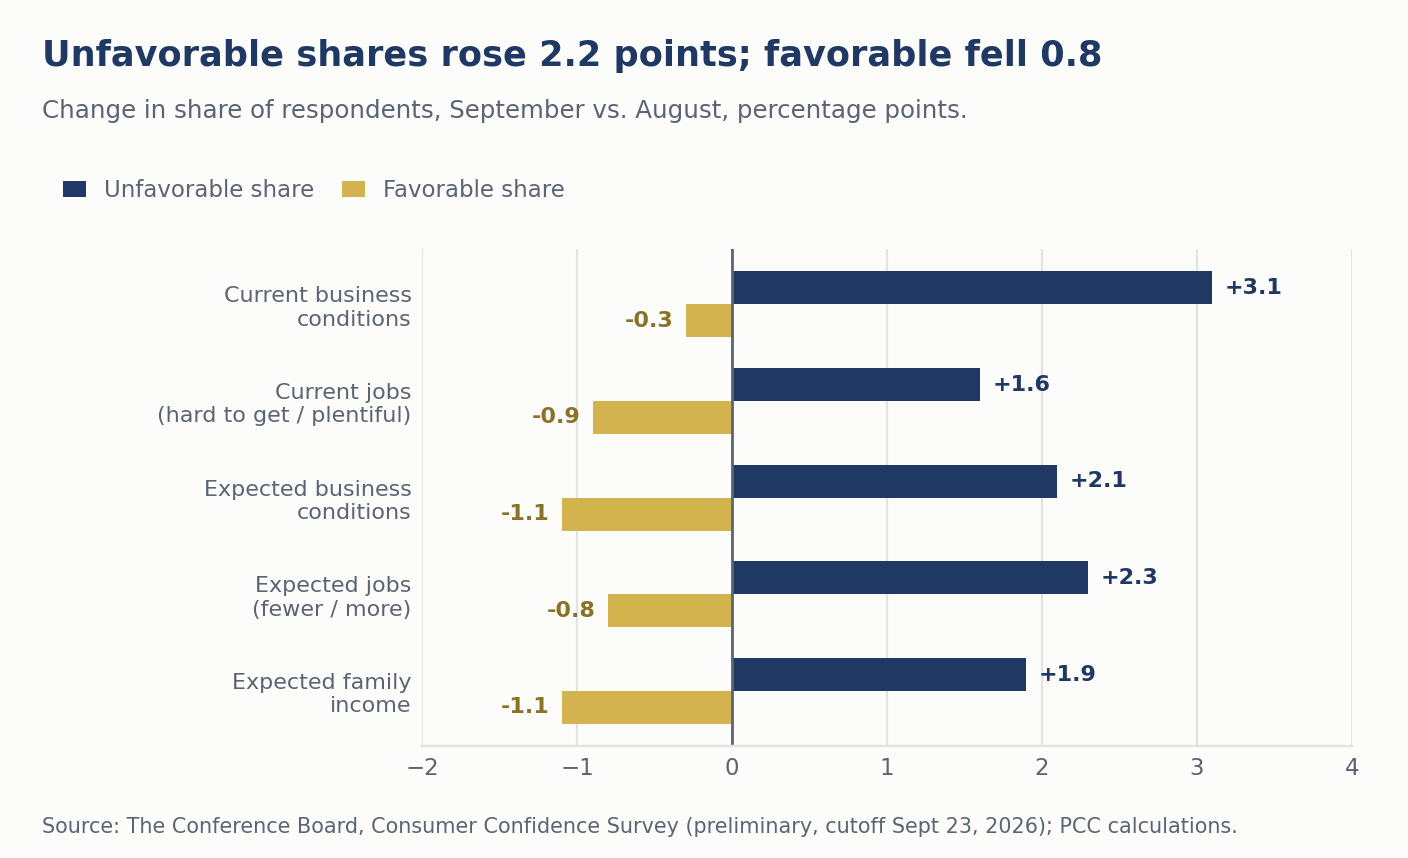
- Unfavorable answers rose in all five components. On average the unfavorable share rose 2.2 points while the favorable share fell 0.8 point.
- Inflation and rate expectations both rose. The average 12-month inflation expectation is 6.1% (median 5.1%), and 68.4% of households expect higher interest rates, up 5.2 points.
- Family finances turned net negative. Households calling their current finances bad now outnumber those calling them good, for only the second time in the four years the question has been asked.
- The headline index is 1.9 points above 80. Our research shows that a reading below 80 has typically preceded outsized midterm losses for the incumbent party. The October report, due October 27, is the last before the election.
Overview
The Conference Board's Consumer Confidence Index fell 6.7 points to 81.9 in September, from 88.6 in August. The Present Situation Index dropped 7.9 points to 109.3 and the Expectations Index fell 5.9 points to 63.6. Expectations sits well below 80, the level the Conference Board has long treated as a signal of recession risk. The preliminary survey ran September 1 to 23, so it captured the September 16 rate hike, a surge in fuel prices and the ongoing geopolitical tensions.
A quick reminder about what these numbers measure. Every component is built from the share of households giving a favorable, unfavorable or neutral answer, so the index reports the breadth of sentiment and not its intensity. A household that moves from “good” to “bad” counts the same whether its view slipped a little or a lot. We try to use breadth language throughout our analysis and reserve words like growth and spending for the hard data.
The Present Situation
Current business conditions turned net negative for the first time since September 2024. The share calling conditions good was 18.5%, nearly unchanged from 18.8%, while the share calling them bad rose to 20.4% from 17.3%. The net balance fell 3.4 points to -1.9%. One quick takeaway is that consumers’ perception of the economy appears to be more sensitive to interest rate hikes than the economy itself has been. Treasury yields stayed near their highest level since 2007 on the day.
The labor market differential narrowed to +1.7%, from +4.2% in August. Households saying jobs are plentiful slipped to 23.6% from 24.5%, and those saying jobs are hard to get rose to 21.9% from 20.3%. Roughly as many households now report jobs hard to get as plentiful. That fits the labor market we described in the September 28 issue of A View from the Piedmont, where a falling unemployment rate reflects a shrinking labor force more than strong hiring. Households describe a job market in balance, with little hiring to lean on. This morning’s August JOLTS report, with job openings down 256,000 to 7.1 million and hires little changed at 5.2 million, is also consistent with this view.
Expectations
Households expect both business conditions and jobs to weaken over the next six months. Net expectations for business conditions fell 3.2 points to -9.5%, and net expectations for jobs fell 3.1 points to -14.4%. The 28.4% of households expecting fewer jobs outnumber the 14.0% expecting more by roughly two to one. Income expectations stayed positive at +2.5%, down from +5.5% in August, and the share expecting a lower income rose to 15.4% from 13.5%. Consumers are clearly experiencing some stress from higher energy prices and are concerned about rising interest rates.
The shares show where the deterioration came from. In each of the five components, the larger part of the move came from more households giving an unfavorable answer and the smaller part from fewer giving a favorable one. Unfavorable shares rose by an average of 2.2 points, while favorable shares fell by an average of 0.8 point (Chart 3). The neutral middle thinned in every component too, most of all for current business conditions, where the share saying conditions are normal fell to 61.1% from 63.9%.
Prices, Rates And Family Finances
Fuel prices dominated the write-in responses. References to prices, the high cost of goods and services, and oil and gas prices in particular rose to new highs, reflecting September's surge in fuel costs. Comments about war and conflict eased but stayed elevated. On September 25, retail diesel averaged $6.50 a gallon (AAA) and November Brent traded near $104 a barrel.
Inflation expectations rose alongside. The average 12-month expectation rose 0.3 point to 6.1% and the median rose 0.3 point to 5.1%. The average sits a full point above the median, which tells us a tail of very high answers pulls up the mean. The University of Michigan's final September reading for the year ahead, 4.6% and up from 4.0%, uses different wording and a different sample but points the same way.
Households expect the Fed to keep going. The share expecting higher interest rates over the next 12 months jumped 5.2 points to 68.4%. They have reason to think so, with the 10-year Treasury closing at 5.24% on September 28, its highest level since 2007, and the 30-year mortgage rate at 7.03%. Consumers still expect stock prices to rise over the next year, though with less conviction than in August.
Family finances turned net negative. The share calling their family's current financial situation bad overtook the share calling it good, for only the second time since the question was introduced four years ago. The series sits outside the index, and it moved the same way as everything else.
The 80 threshold matters for the November 3 midterms. Our research shows that a headline Consumer Confidence reading below 80 has typically preceded outsized losses for the incumbent party, which fits our framework of reading midterms through real after-tax per capita income growth. At 81.9, September's reading is 1.9 points above the threshold. The October report, due October 27, is the last one before voters go to the polls, and a decline of two points or more would put the index below it.
The Conference Board and Michigan surveys locate the damage differently. In Michigan's final September survey, current conditions eased only a point to 50.9 while expectations fell 5.2 points to 46.3. In the Conference Board survey, the Present Situation Index fell more than the Expectations Index, 7.9 points against 5.9. The two are built from different questions, business conditions and jobs at the Conference Board, and personal finances and buying conditions at Michigan, and both pointed lower.
Spending Plans And Who Is Feeling It
Spending plans softened at the margin. On a six-month moving average basis, plans to buy autos and homes both declined slightly, and planned spending on services pared back again. Hotels for personal travel, movies, airfare and amusement parks were among the discretionary categories that moderated. Vacation plans held up, with 42.6% of households planning a trip in the next six months, up 0.5 point, but the gain was limited to domestic travel and planned foreign travel dipped. The link between spending plans and actual spending remains loose, however. The direction is probably more important than the magnitude.
Confidence weakened across age groups, income groups and political affiliations. On a six-month moving average basis, confidence trended lower in every age group and in nearly all income groups. Households earning $125,000 to $149,000 reported the largest decline over six months, and higher-income groups stayed the more optimistic. Gen Z and Millennials have the highest confidence, while Generation X, Baby Boomers and the Silent Generation continued to weaken. In September, confidence fell among Democrats, Republicans and Independents alike.
OUR CALL
September's drop reads as a reaction to the cost of living. The hard data on household spending have not yet confirmed a pullback, and the September flash composite PMI of 58.4 was the strongest since 2021. We hold our forecast for real consumer spending growth of 2.3% in 2026 and 2.0% in 2027 (September 23 vintage), and we leave the Fed call unchanged: a hold at the October 27-28 meeting, a second quarter-point increase on December 9 to 4.00%-4.25%, and at least one more in 2027.
The test is the October report, released October 27, the first day of the FOMC meeting. If the labor market differential turns negative, with more households calling jobs hard to get than plentiful, we will take our consumer spending forecast lower. If it holds above zero, we read September as a response to fuel prices and higher rates and keep the forecast where it is.
Bottom Line
Confidence deteriorated sharply in September after two months of softening, and the shares behind the index show households changing their minds in one direction, a more cautious one. Fuel prices, a rate hike and Treasury yields at their highest since 2007 gave them reasons. The labor market differential is the line to watch, because it remains positive but only slightly so. Our forecasts for consumer spending and the Fed path stand, and the October survey will tell us whether they should.
What We Are Watching
- Labor market differential: the +1.7% reading sits just above zero. A move below zero on October 27 would change our consumer spending forecast.
- The 80 threshold: a headline reading below 80 in the October report, released a week before the midterms, would put the index in the range that has typically preceded outsized losses for the incumbent party.
- Fuel prices and inflation expectations: if diesel and gasoline ease, the 6.1% average inflation expectation should be the first series to retrace.
- Wednesday's core PCE inflation and Friday's employment report: both arrive before the Committee meets again and will show whether the household mood in this survey has reached spending and hiring.
Mark P. Vitner
Chief Economist, Piedmont Crescent Capital
mark.vitner@piedmontcrescentcapital.com | 704-458-4000
Sources: The Conference Board, Consumer Confidence Survey, September 2026 (preliminary results, cutoff September 23, conducted by Toluna); University of Michigan, Surveys of Consumers, final September 2026; U.S. Bureau of Labor Statistics, Job Openings and Labor Turnover Survey, August 2026 (released September 29); U.S. Treasury, daily par yield curve, September 25, and market reports of Treasury yields, September 28 and 29; Freddie Mac, Primary Mortgage Market Survey, week ended September 24; AAA, national average retail diesel, September 25; S&P Global, flash U.S. PMI, September 2026; Piedmont Crescent Capital, A View from the Piedmont, September 28, 2026, and forecast vintage of September 23, 2026.
© 2026 Piedmont Crescent Capital, LLC. For informational purposes only. Not investment advice.