
ECONOMIC INDICATOR REPORT · HOUSING STARTS, AUGUST 2026
Single-Family Comes Back, Multifamily Falls Away
August’s single-family rebound and multifamily pullback reversed the year-to-date pattern for one month, and builder sentiment fell to a one-year low the day before this report.
Early Signal
- Single-family starts posted their best month since March. Single-family starts rose 7.6% in August to 918,000 units at a seasonally adjusted annual rate, the fastest pace since March and enough to push the year-over-year comparison to plus 5.2%. Single-family permits held closer to flat, down 1.8% to 878,000, so the August jump reads more like builders working through a backlog than a fresh acceleration in demand. Year to date, however, single-family starts are still running 4.9% below the same eight months of 2025, so one strong month has not closed the gap.
- Multifamily construction fell off a cliff. Starts on buildings of five or more units dropped 22.5% to a 344,000-unit pace, reversing July’s spike and pulling the year-over-year comparison to minus 15.5%. Multifamily permits fell a smaller 3.1%, to 467,000, which argues August’s air pocket in starts is at least partly a timing story rather than a change in the pipeline. Year to date, multifamily starts are still running 10.0% above 2025’s pace, so August looks like a pause in a stronger multifamily year, not a new trend.
- The composite still slipped. Total starts fell 2.6% to 1,275,000, the third decline in the last four months, because the multifamily decline outweighed the single-family rebound. Total permits, the better leading indicator, fell 2.7% to 1,394,000 but held 3.5% above a year ago. Year to date, total starts are averaging 1,359,000 through August, down 1.0% from the same span of 2025, with single-family down 4.9% to 913,750 and multifamily up 10.0% to 430,875. Permits are averaging 1,416,000 through August, down 0.7%, with single-family down 3.4% to 890,000 and multifamily up 5.9% to 475,000, a less noisy version of the same split.
- Completions cratered. Total completions fell 11.9% to 1,128,000, down 27.1% from August 2025’s unusually high 1,548,000. The comparison flatters the size of the decline, because last year’s completions were still working off the record 2023-2024 multifamily construction wave, and that wave has largely cleared the pipeline.
- Builder sentiment matched its worst reading in a year. The NAHB/Wells Fargo Housing Market Index fell three points to 32 in September, tying the September 2025 low, with all three components, current sales, six-month expectations and buyer traffic, at or below their year-ago levels. Thirty-eight percent of builders cut prices in September, up from 35% in August, and 66% offered some form of sales incentive, the highest share since December.
- Mortgage rates moved further from the house forecast. The 30-year fixed rate reached 6.95% this week, up from 6.76% the week before and an August average near 6.67%, the highest level in more than a year and well above PCC’s own fourth-quarter workbook path of 6.60%, as Treasury yields absorbed this week’s Fed rate hike and elevated geopolitical risk. Higher financing costs were the reason builders cited most often for September’s drop in sentiment.
- Regulation and remodeling both point to a market with less room to maneuver. A new NAHB survey puts the regulatory cost of building a single-family home at $131,734, or 26.4% of the sale price, up more than 40% from $93,871 in the association’s 2021 study. Separately, Harvard’s Joint Center for Housing Studies now expects growth in home improvement spending to slow to just 0.5% year over year by the second quarter of 2027, down from 1.8% in the second quarter of this year.
- PCC’s own call remains on track, for now. Starts have averaged 1,359,000 through the first eight months of 2026, a bit ahead of our 1,336,000 full-year forecast despite August’s pullback. The single-family/multifamily mix, not the total, is the thing to watch, and the August starts moved against our standing expectation that multifamily gives up relatively less ground than single-family this cycle. Year-to-date permits are much closer to our expectations, averaging 1,416,000 through August, down just 0.7% from a year ago and with far smaller single-family/multifamily swings than starts have shown.
The Overview
The Census Bureau's New Residential Construction report for August, released this morning, and NAHB's Wells Fargo Housing Market Index for September, released yesterday, describe two different problems in the same market. The Census data show single-family builders finally getting relief, with starts and, to a lesser extent, permits both moving higher. The NAHB survey, fielded over roughly the same weeks, shows builders more pessimistic than at any point in the past year. Both can be true at once. Builders can be breaking ground on homes they already have permits and lots for while telling surveyors they expect the next few months to be harder, and that is the more likely reading of August than a genuine turn in either direction.
Total starts fell 2.6% to 1,275,000 at a seasonally adjusted annual rate, essentially unwinding July's 1,309,000 gain and leaving the level 1.2% below August 2025. Total permits fell a similar 2.7% to 1,394,000, still 3.5% above a year ago, which keeps the permits-to-starts relationship, the more reliable leading signal, pointed modestly higher on a trailing basis even as the single-month starts print disappointed.
The Mix: Single-Family vs. Multifamily
August's headline decline was entirely a multifamily story. Single-family starts rose 7.6% to 918,000, their best print since March, while starts on buildings of five or more units fell 22.5% to 344,000, erasing essentially all of the prior month’s surge. Permits tell a more consistent version of the story. Single-family permits slipped 1.8% to 878,000 and multifamily permits fell 3.1% to 467,000, both far smaller moves than the swings in starts. When starts move more than permits in the same direction, that is usually noise in the timing of groundbreakings rather than a change in what builders are approved to build, and this month's gap between the starts and permits moves, in both categories, argues for treating August as noisy rather than definitive. The year-to-date levels tell the more reliable story. Single-family starts are running 4.9% behind last year's pace while multifamily starts are running 10.0% ahead of it, the reverse of August's single-month print and the better read of where this cycle actually stands.
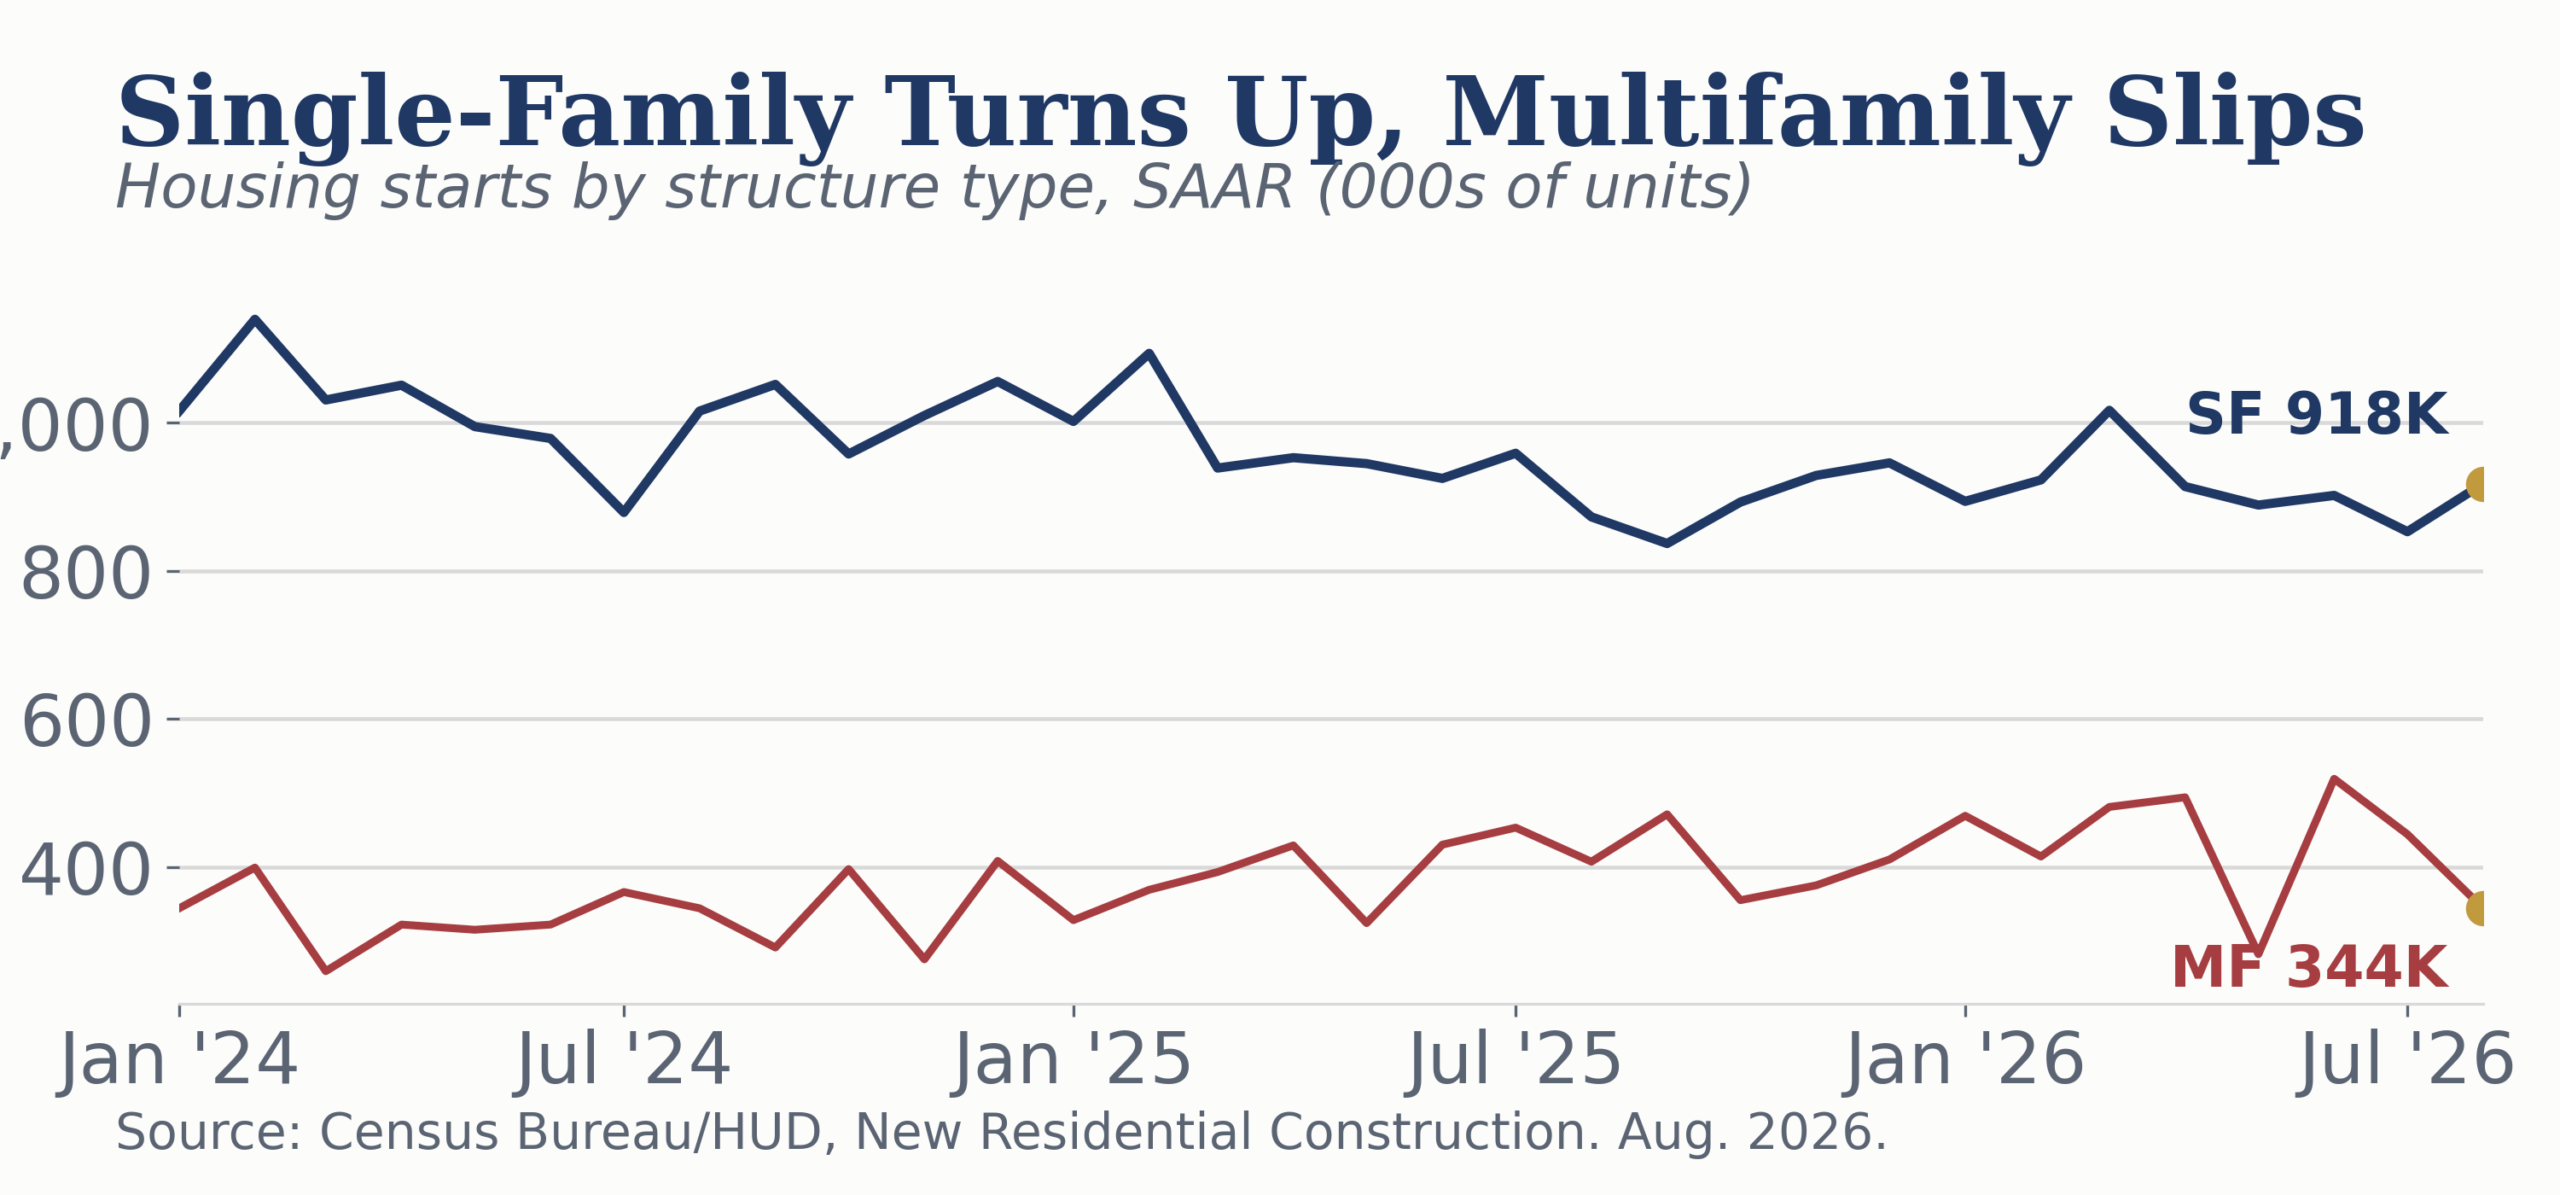
The multifamily air pocket is easier to explain than the single-family bounce. Builders delivered an outsized wave of apartments in 2023 and 2024, and the completions data below show that wave is still working through lease-up. A single soft month for multifamily starts, on top of that overhang, is the more parsimonious explanation than a sudden change in apartment demand.
The Regional Split
National single-family starts do not say where the improvement came from, and the answer matters for judging whether August's rebound is durable. Regional starts carry a wide margin of error and are unusable month to month on their own, so permits, the steadier series, are the better cross-check.
| Region | SF Starts, Aug (000s) | M/M | SF Permits, Aug (000s) | M/M |
|---|---|---|---|---|
| Northeast | 46 | -2.1% | 52 | -7.1% |
| Midwest | 143 | +23.3% | 130 | 0.0% |
| South | 531 | -0.9% | 527 | -0.6% |
| West | 198 | +28.6% | 169 | -5.1% |
Source: Census Bureau/HUD, New Residential Construction, Table 3a (starts) and Table 1a (permits), August 2026.
The West and Midwest produced essentially all of the national single-family gain, up 28.6% and 23.3% in a single month, while the South and Northeast were flat to lower. Permits in those same two regions moved the other way, flat in the Midwest and down 5.1% in the West. When starts move sharply in a region where permits do not confirm it, the more likely explanation is builders converting existing entitlements and already-developed lots into construction, not a fresh burst of new commitments.
That reading lines up with what builders themselves are describing. NAHB's September survey found 42% of builders rate lot availability as poor and 38% as fair, so the large majority are land-constrained rather than land-flush, and this month's trade coverage of the sector's cost structure describes finished-lot and land-development costs as now embedded in builders' cost basis in a way that pushes them to keep building through weak demand rather than around it. Our read, consistent with that commentary, is that a good share of August's single-family pickup reflects builders monetizing lots and development costs they cannot otherwise recover, not a change in buyer demand, which also fits a month in which builder sentiment fell to a one-year low.
The complication is that completed, unsold inventory is already near a cycle high, close to four times the February 2022 low, with total months' supply at 9.6, above the four-to-six-month range that has historically balanced the market. Building to work through sunk land costs is a sound explanation for why starts can rise even as sentiment falls, but it does not by itself resolve an already-elevated inventory of finished, unsold homes, and it argues for caution about reading August's single-family pickup as the start of a sustained upturn.
Completions and the Vacancy Overhang
Total completions fell 11.9% in August to 1,128,000, and the year-over-year comparison, down 27.1% from August 2025's 1,548,000, is the sharpest of any series in this release. Single-family completions fell 10.4% to 816,000 and multifamily completions fell to 302,000.
Harvard's Joint Center for Housing Studies put a number on the overhang in its June State of the Nation's Housing report. The rental vacancy rate has climbed to 7.3% as of the first quarter of 2026, up from a record low of 5.9% in 2022, and the for-sale vacancy rate has risen to roughly 1.1% from 0.81% in 2023. The Center's own read is that a multifamily construction wave layered on top of already-elevated single-family building pushed vacancy up from those historic lows, and that is precisely the supply now working its way through completions. Fewer completions from here is the expected, not the alarming, response to that much vacant inventory.
Builder Sentiment: The NAHB/Wells Fargo Survey
The HMI is a diffusion-style index. Each component is built from the share of builders rating conditions good, fair or poor, so a move in the index measures how many builders shifted their view, not how far conditions moved for any single builder.
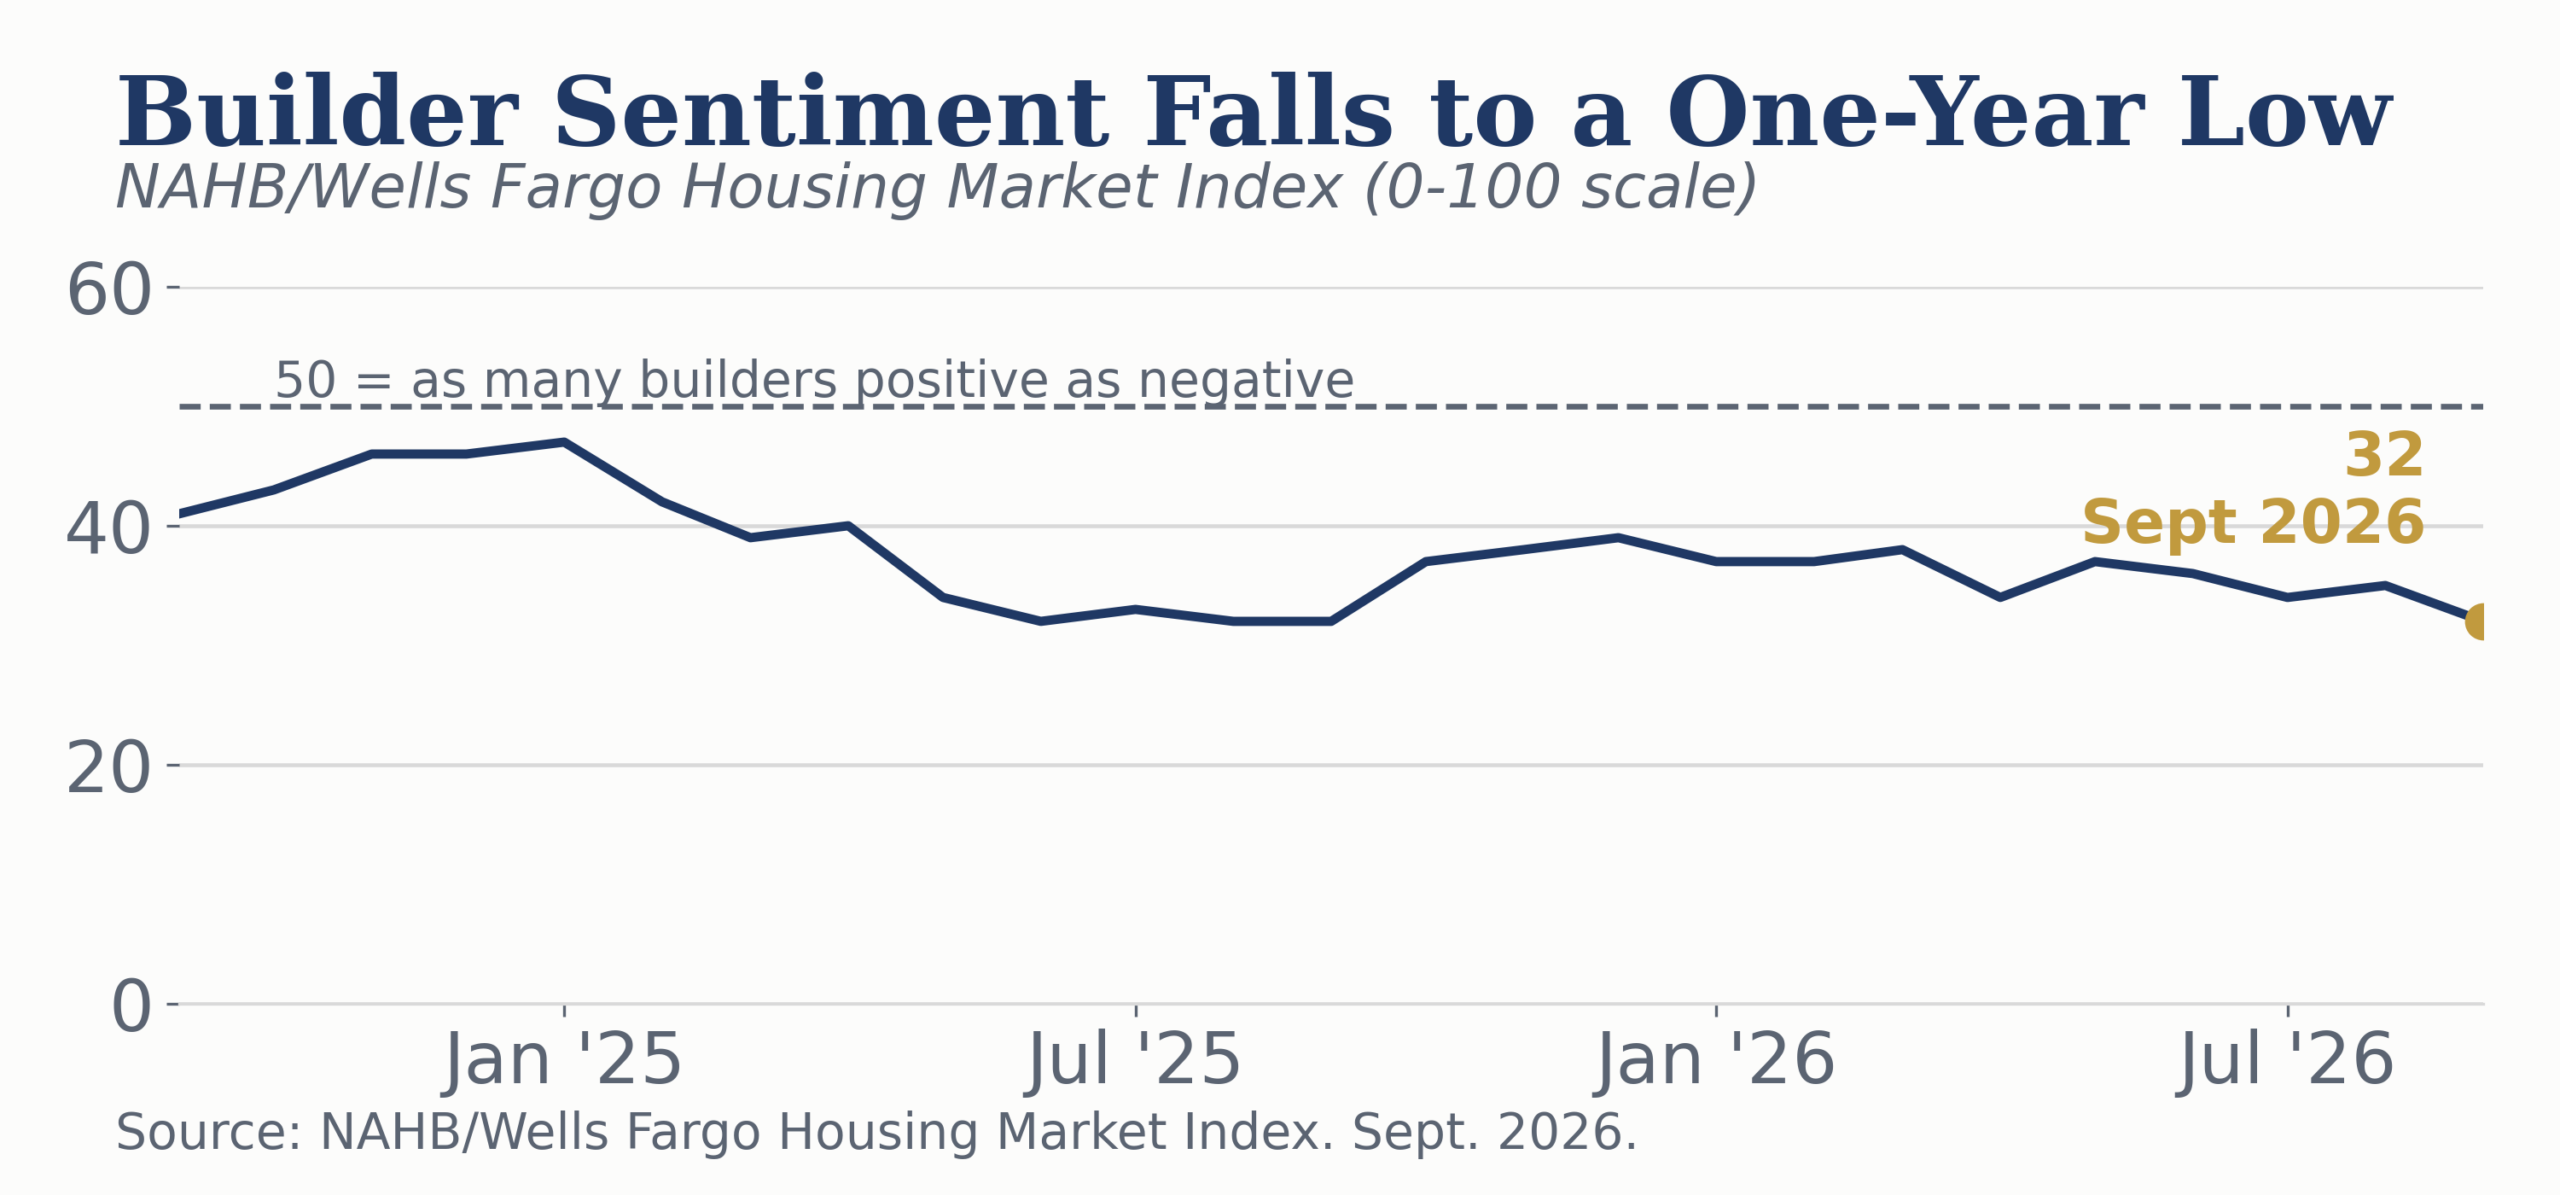
The headline index fell three points in September to 32, tying the September 2025 reading as the weakest of the past year. All three components declined or held flat, as current sales conditions fell four points to 35, sales expectations for the next six months fell six points to 37, and prospective buyer traffic held at 23. Regionally, on NAHB's three-month moving average, the Midwest led at 44 (down one point), followed by the Northeast at 39 (down five), the South at 31 (down one) and the West at 28 (up one). No region is above the 50 breakeven line, so the gap between regions is a measure of relative resilience in a soft market rather than strength anywhere.
NAHB Chairman Bill Owens attributed the drop mainly to financing costs: “Buyer traffic weakened across much of the country largely due to rising mortgage rates. Builders face higher material costs, rising fuel prices, labor shortages, and immigration enforcement issues.” Chief Economist Robert Dietz added that “builder confidence is at its lowest level since September 2025 as tight lending conditions and elevated land, labor, and construction costs continue.” Builders are responding on price. Thirty-eight percent cut prices in September, up from 35% in August, with the average cut holding at 6% for a sixth straight month, and 66% offered a sales incentive, the highest share since December, up from 63%.
The Cost Side: Regulation and Remodeling
A new NAHB regulatory cost study, based on a March 2026 builder survey and January 2026 home price data, puts the total regulatory cost of a new single-family home at $131,734, or 26.4% of the final sale price. That is up more than 40% from the $93,871 the association measured in its 2021 study, split between $46,795 in lot development costs and $84,939 in costs tied directly to construction. Regulatory cost has grown faster than the home price it is measured against, which is the cleaner way to read the 40% increase: builders are not just paying more because homes cost more, they are paying a larger share of a home's price to regulation than they were five years ago.
Remodeling is decelerating alongside new construction rather than offsetting it. Harvard's Leading Indicator of Remodeling Activity, updated July 23, now projects annual home improvement and repair spending will slow to 0.5% year-over-year growth by the second quarter of 2027, down from 1.8% growth in the second quarter of 2026, as spending levels off near $519 billion. The Center points to flattening remodeling permits and building-material retail sales, alongside reduced housing starts, as the reasons homeowners are pulling back on renovation spending alongside builders pulling back on new construction.
Rates and the Road Ahead
The Federal Reserve raised the federal funds rate a quarter point to 3.75%-4.00% yesterday, its first increase since July 2023, on a unanimous 12-0 vote. PCC's call is that at least two more quarter-point increases are likely, one later in 2026 and at least one more in 2027, putting the terminal rate at 4.25%-4.50% or higher by the end of next year, a touch more hawkish than the Fed's own median projection. Every rate call of this kind is a ceteris paribus forecast. Each policymaker says what the Committee should do if nothing else changes, and something else is already changing. The 30-year fixed mortgage rate reached 6.95% this week, well above PCC's own fourth-quarter workbook path of 6.60%, and higher financing costs were the single most-cited reason builders gave for September's drop in sentiment.
A higher-for-longer funds rate argues for continued pressure on mortgage rates, and mortgage rates, not the funds rate directly, are what shows up in builder surveys and buyer traffic. If the Fed's hawks are right about a second 2026 hike, that pressure does not relent before the spring selling season.
Our Call
We are not changing our full-year forecast on the strength of one month. PCC still expects total housing starts to average 1,336,000 in 2026 and 1,353,000 in 2027. Starts have averaged 1,359,000 through August, running a little ahead of that call even after this month's pullback, so the level forecast needs no revision. What we are watching is the mix. Our standing view is that single-family production keeps giving up relative ground to multifamily through this cycle, and August moved the other way. Year to date, the mix still points our way. Single-family starts are down 4.9% from last year and multifamily is up 10.0%, so on the evidence so far August was the outlier, not the trend. Here is the test, with dates: if the September release, due in mid-October, shows single-family starts giving back most of August's gain while multifamily stays soft, that confirms August was noise. If single-family instead holds near 900,000 while multifamily stabilizes above 350,000, that would argue the mix call needs revisiting before year end.
President & Chief Economist, Piedmont Crescent Capital
Sources
U.S. Census Bureau and U.S. Department of Housing and Urban Development, New Residential Construction, August 2026, including Table 1a (regional permits) and Table 3a (regional starts) (released September 17, 2026). National Association of Home Builders and Wells Fargo, Housing Market Index, September 2026, including the lot-availability question (released September 16, 2026). National Association of Home Builders, Eye on Housing, regulatory cost survey (March 2026 survey; published June 2026). Harvard University, Joint Center for Housing Studies, The State of the Nation's Housing 2026 (released June 17, 2026) and the Leading Indicator of Remodeling Activity (released July 23, 2026). Trade press coverage of builder finished-lot and completed-inventory cost dynamics, September 2026. Freddie Mac, Primary Mortgage Market Survey, 30-year fixed rate, week of September 17, 2026. Board of Governors of the Federal Reserve System, FOMC statement and Summary of Economic Projections, September 16, 2026. Piedmont Crescent Capital internal forecast workbook.
This report reflects the analysis and opinions of Piedmont Crescent Capital as of the date shown and is provided for general informational purposes only. It does not constitute investment, legal, or tax advice, is not an offer or solicitation, and should not be relied upon as the basis for any investment decision. Forecasts and other forward-looking statements are inherently uncertain and actual outcomes may differ materially.