
Output Is Ramping Up, and Hiring Should Follow
The Manufacturing PMI reached its highest level in more than four years, and the Employment Index broke a 33-month losing streak, while a prices gauge still above 70 leaves the Fed no room to answer.
Early Signals
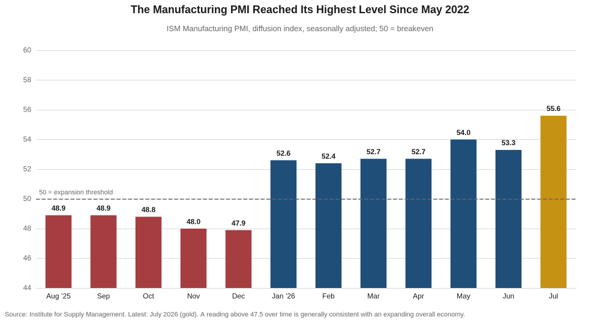
- The factory sector broke out. The Manufacturing PMI rose 2.3 points to 55.6 in July, its highest reading since May 2022 and its seventh consecutive month above 50. ISM’s own mapping puts that reading at roughly 2.8 percent real GDP growth on an annualized basis, which lines up with the stronger second half our full-year forecast has been leaning on.
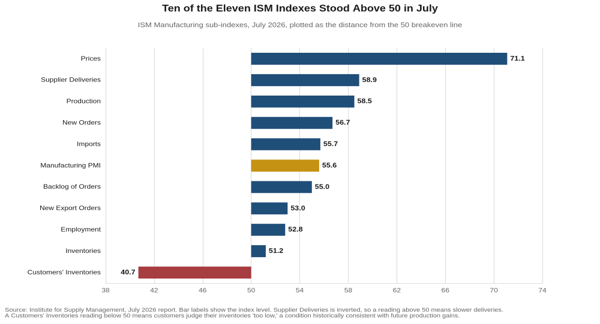
- Production did most of the lifting. The Production Index jumped 6.3 points to 58.5, its strongest reading since November 2021, and the Backlog of Orders Index rose 4.5 points to 55.0 after nearly stalling out in June.
- Employment finally crossed over. The Employment Index rose 3.1 points to 52.8, its first reading above 50 in 33 months and its highest since August 2022. Sixty percent of panelists reported that their companies are hiring.
- Trade moved in both directions. New export orders returned to expansion at 53.0 and the Imports Index rose to 55.7, its highest since June 2021, an unusual pairing with tariffs still in force across much of the goods basket.
- Price relief continued, and prices remain the problem. The Prices Index slipped 1.9 points to 71.1, its third straight monthly decline, but it has now signaled rising input costs for 22 consecutive months.
Key Takeaways
| Key Concept | Findings |
|---|---|
| Manufacturing PMI | Rose to 55.6 from 53.3, the highest reading since May 2022 (55.9) and the seventh straight month of expansion following a ten-month contraction. The overall economy has now grown for 21 consecutive months on ISM’s mapping. |
| Production | Up 6.3 points to 58.5, its highest level since November 2021. Twelve industries reported higher output and no industry reported a decline in production in July. |
| New Orders and Backlogs | New orders edged up 0.7 point to 56.7 for a seventh month of growth, while backlogs jumped 4.5 points to 55.0. Customers’ inventories fell further into “too low” territory at 40.7, a 22nd month, which historically points to future production. |
| Employment | Up 3.1 points to 52.8, the first expansion reading in 33 months and the highest since August 2022. The ratio of panelists hiring to those managing head counts was 1.5 to 1. |
| Prices | Down 1.9 points to 71.1, a third consecutive decline, with 50.2 percent of respondents reporting higher prices against 55.1 percent in June. Steel and aluminum tariffs and the Middle East oil premium are still exerting pressure. |
| Trade | New export orders returned to expansion at 53.0, the highest since March 2022, and imports rose to 55.7, the highest since June 2021. Both indexes gained more than 2.5 points. |
| Breadth | Fifteen of 18 industries grew, with Chemical Products the lone industry in contraction. By GDP weight, however, the contracting share widened to 20 percent from 5 percent in June. |
| Policy Signal | A firming industrial economy paired with input costs still in the 70s argues for patience, not a pivot. We hold our no-cut base case for 2026, with the next move more likely up than down, in 2027. |
The Overview
We have argued for some time now that the factory recovery was real, and that new orders and production were carrying it. The missing piece was hiring. July supplied it, as the Manufacturing PMI rose 2.3 points to 55.6, the highest reading in more than four years, and the Employment Index moved into expansion for the first time in 33 months. Four of the five components that feed the headline accelerated, and the only exception, inventories, slipped by two tenths.
The sequence is the part worth holding onto, because a factory recovery tends to run in a familiar order, with new orders improving first, order backlogs lengthening next, the workweek stretching after that, and hiring arriving last. This cycle has now completed all four steps. New orders turned in January and backlogs edged above 50 the same month, the factory workweek stretched from 41.1 hours in December to 41.6 by February, backlogs then lengthened decisively in July, to 55.0 from 50.5, and the Employment Index crossed 50 in the same report. The chain took an unusually long time to run its course this cycle, however, because tariff and geopolitical uncertainty gave employers every reason to add hours before they added staff.
What July did not deliver was any relief on costs. The Prices Index eased for a third month and still sits at 71.1, a level it has held since at least April. Pricing volatility turned up in 57 percent of the negative panel comments and the Iran war in 43 percent, so the two forces working against the recovery are the same two we flagged earlier, only now they sit alongside an acceleration instead of a stall.
Production Did the Lifting
The Production Index rose 6.3 points to 58.5, its highest reading since November 2021, and the composition beneath it is as clean as the headline. Twelve industries reported higher output, six reported no change, and none reported a decline. Of the six largest manufacturing industries, four expanded production, including Chemical Products, the only industry that contracted on the composite.
Demand kept pace without accelerating. New orders rose seven tenths to 56.7 and have now held the 54 to 57 band for four months, a firm reading well short of a boom. The more interesting move was in backlogs, which rose 4.5 points to 55.0 after sitting at 50.5 in June. Order books lengthening while production runs at a four-year high is the combination that pulls hiring forward. Customers’ inventories, meanwhile, fell to 40.7 and have been judged too low for 22 straight months, a condition that historically precedes restocking. That the restocking has not yet arrived likely reflects continued uncertainty about the Iran war and U.S. tariff policy, and more clarity on either front would probably set it off.
Supplier deliveries slowed for an eighth consecutive month, at 58.9, and the buying-policy detail says why. The average commitment lead time for production materials stretched to 87 days in July from 81 days in April, and capital expenditure lead times edged up to 172 days. Slower deliveries usually accompany firming demand, and they can also signal genuine scarcity. Panelists named electronics, critical minerals and printed circuit boards, so both readings apply this month.
The 33-Month Streak Ends
The Employment Index registered 52.8 in July, up 3.1 points and in expansion for the first time in 33 months. Six industries added workers and six cut them, with six unchanged, and 60 percent of panelists reported that their companies are hiring against 40 percent still managing head counts. ISM’s own guidance is that an Employment Index above 50.3 is generally consistent with rising manufacturing payrolls in the Bureau of Labor Statistics data, which makes the July employment report on Friday the first real test of the signal.
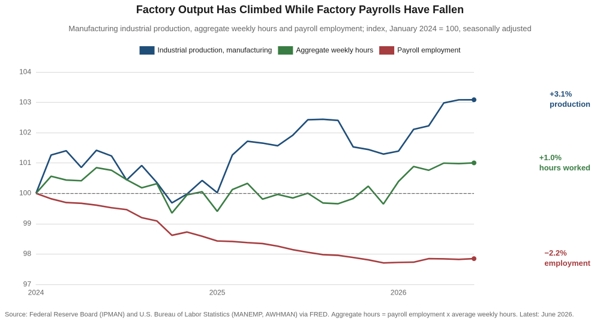
The payroll data have been waiting for this. Manufacturing employment bottomed at 12.58 million in December and has added just 18,000 workers in the six months since, leaving the sector 38,000 jobs below where it stood a year ago. Even with the flat head count, however, manufacturing output has climbed 1.1 percent over the past year and 1.8 percent since December, so the recovery to date has been produced by the workers already on the payroll.
The workweek is where that shows up, and it is the step that comes just before hiring. Average weekly hours in manufacturing reached 41.6 in June, up from 41.1 in December and 41.0 a year earlier, and the highest reading in at least five years. Half an hour sounds trivial, and it is worth roughly 150,000 workers at December’s workweek, more than eight times the head count the sector has actually added. Employers stretch hours rather than hire when they doubt a recovery will last, because hours can be unwound quickly and hires cannot. July suggests a good number of manufacturers are now confident enough to boost hiring.
What the Capital Was Doing
The capital side of this recovery has been visible in the hard data for a year. Orders for nondefense capital goods excluding aircraft reached $85.1 billion in June, up 12.5 percent from a year earlier and up 7.4 percent since December alone. Manufacturing labor productivity rose 1.5 percent over the year through the first quarter. Since the start of 2024 factory output is up 3.1 percent while aggregate hours are up 1.0 percent and payrolls are down 2.2 percent, the signature of a cycle that deepened capital before it added workers.
What the panel comments add is where the capital is going. A machinery producer described products going into data centers at full procurement and manufacturing ramp-up, with semiconductor, power, networking and photonics demand booming and orders for medical, industrial and consumer products markedly lower. A computer and electronic products panelist cited semiconductor, AI, advanced packaging and high-performance computing markets. A transportation equipment panelist reported aerospace and defense backlogs growing while the firm competed for scarce electronics and critical minerals. The recovery has a narrow set of end markets behind it, which is the conditional capital argument we made in our data center work.
Prices, Tariffs and the War Premium
The Prices Index fell 1.9 points to 71.1, a third consecutive monthly decline from April’s 84.6, and the share of respondents paying more fell to 50.2 percent from 55.1 percent. The direction is right and the level is not. Twenty-two consecutive months of rising input costs have compounded into a number that is visible in the official data, where the producer price index for processed goods for intermediate demand is up 11.1 percent over the past year, though it did fall 0.7 percent in June, its first monthly decline since December.
Three forces are holding the index up, and they are separable. Tariffs on steel and aluminum raise costs through the entire value chain, and they are a policy choice. The Middle East conflict has put a premium on petroleum-based products and freight, and it is a live variable rather than a settled one, since panelists reported fuel costs falling while the war was paused and rising again once skirmishes resumed. The third force is scarcity in the categories the AI buildout is consuming, and an electrical equipment panelist put numbers on it, citing price increases of 5 to 25 percent for printed circuit board assembly components and 15 to 45 percent for bare boards. The first two can reverse on a headline, while the third will not ease materially until the buildout does.
For the Federal Reserve, this report cuts against easing rather than toward it. A factory sector growing at its fastest rate in four years, hiring for the first time in nearly three years, and paying up for inputs is not the profile of an economy that needs help. The Committee has spent the year waiting for confirmation that the spring energy shock was not becoming a wage-price problem. It did not get that confirmation in July.
Our Call
The manufacturing recovery is now broad enough to be self-reinforcing. Orders improved, backlogs lengthened, the workweek stretched and payrolls have now turned, which is the complete chain and not just the front half of one. We look for manufacturing employment to post modest gains through the fall, and we would treat a soft July payroll print on Friday as timing rather than as a refutation, since the ISM Employment Index has led the payroll data at every prior turn.
The recovery is broad by industry and narrow by end market, and that distinction will matter. Fifteen of 18 industries grew in July, yet the share of manufacturing GDP in contraction widened to 20 percent from 5 percent, because Chemical Products carries real weight. The panel comments point the same way, with data centers, semiconductors, aerospace and defense running at capacity while consumer, medical and general industrial orders lag. This is a capital goods recovery riding an investment cycle, and it will stay vulnerable to anything that interrupts that cycle.
We hold our call that the next Fed move is more likely up than down. Nothing in the July report argues for easing, and the Prices Index at 71.1 alongside an accelerating industrial economy argues mildly against it. The risk to that view is not a weaker factory sector. It is a wider Middle East conflict that pushes energy and freight costs high enough to stall the very improvement in demand this report is measuring, and the panel comments suggest firms are still pricing that possibility into their planning.
Mark P. Vitner – Chief Economist, Piedmont Crescent Capital
mark.vitner@piedmontcrescentcapital.com · (704) 458-4000
Disclaimer: This report is provided for informational purposes only and does not constitute investment, legal, tax, or accounting advice, nor an offer or solicitation to buy or sell any security. Information is drawn from sources believed to be reliable, including the Institute for Supply Management, the U.S. Bureau of Labor Statistics, the U.S. Census Bureau and the Federal Reserve Board, but its accuracy and completeness are not guaranteed. Views expressed are those of the author as of the date of publication and are subject to change without notice. Past performance is not indicative of future results.