
Q1 GDP Holds Up Better Than Feared; Final Demand Tells the Cleaner Story
A 2.0% headline print after a brutal February, an oil shock, and a residual government shutdown drag is more durable than it looks. The labor market data confirm it.
| Indicator (q/q SAAR, %) | Q1 2026 | Q4 2025 | Change |
|---|---|---|---|
| Real GDP | +2.0% | +0.5% | +1.5 pp |
| Final Sales to Pvt. Domestic Purchasers | +2.5% | +2.9% | −0.4 pp |
| Personal Consumption | +1.6% | +1.9% | −0.3 pp |
| Nonresidential Fixed Investment | +10.4% | +5.0% | +5.4 pp |
| Residential Investment | −8.0% | −1.7% | −6.3 pp |
| Core PCE Price Index (y/y) | +3.2% | +3.0% | +0.2 pp |
| Employment Cost Index (q/q) | +0.9% | +0.7% | +0.2 pp |
Headline Print
Real GDP grew at a 2.0% annualized pace in the first quarter, according to the advance estimate from the Bureau of Economic Analysis. That came in slightly below the 2.3% consensus and our own forecast, but it was substantially better than feared. The Atlanta Fed’s GDPNow tracking model had drifted as low as 0.5% in mid-April, and Q1 prints have come in mysteriously weak in each of the past several years, with seasonal-adjustment quirks that the BEA continues to wrestle with. Q1 also had to overcome a brutal February, the oil shock from the war with Iran, and the residual drag from the federal government shutdown that disrupted activity in the closing months of 2025.
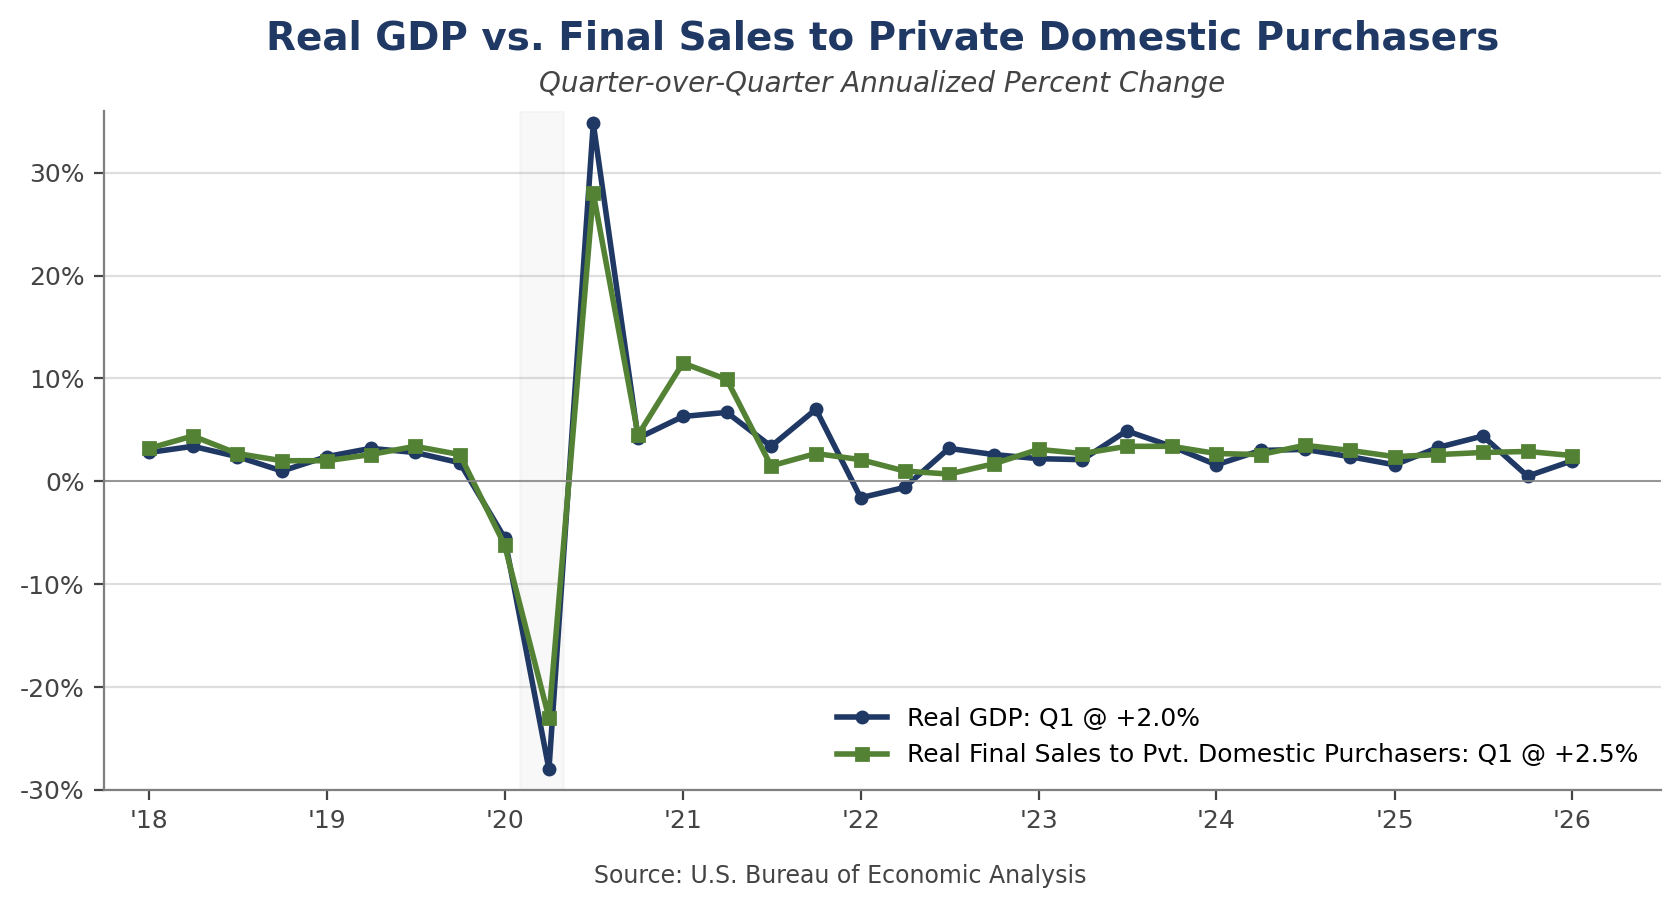
That makes the 2.0% print, in our view, a thoroughly reassuring report. The composition is cleaner than the headline. Real final sales to private domestic purchasers — the sum of consumer spending and gross private fixed investment, and our preferred read on the underlying pace of demand — rose 2.5% in Q1 after a 2.9% gain in Q4. That is consistent with the trend that has held since mid-2023 and suggests the private-sector economy is still expanding at a pace just above 2.5%, even as inventories and net trade introduced their usual quarter-to-quarter noise into the headline.
The 2.5% gain in real final sales to private domestic purchasers is the cleaner read on the underlying pace of demand.
Composition: Where the Growth Came From
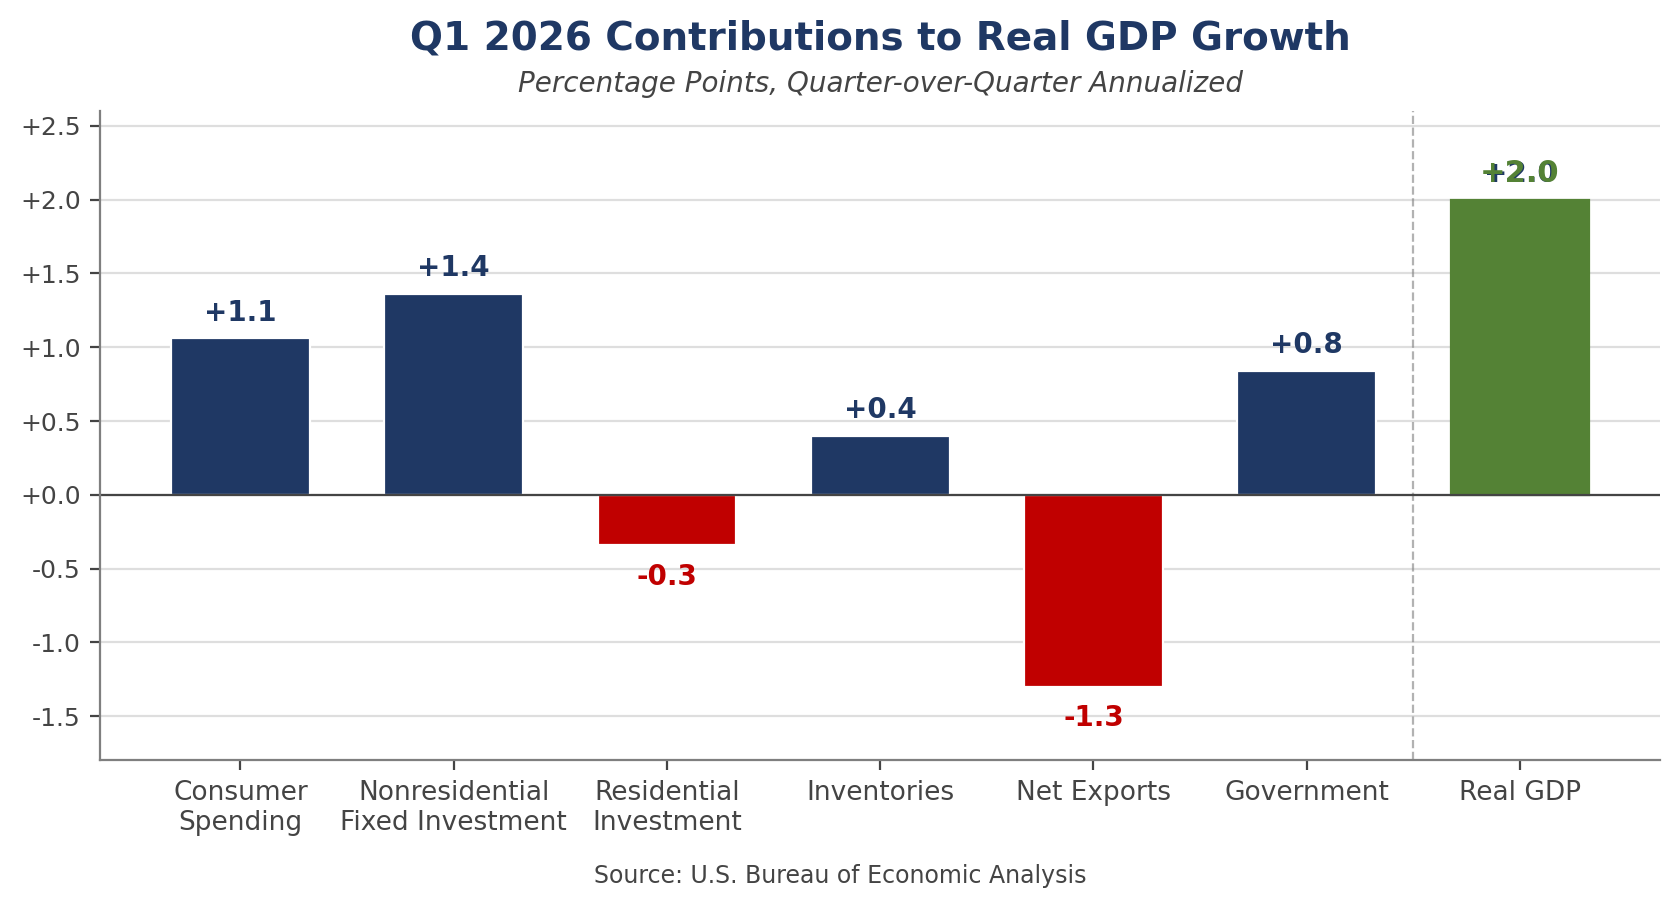
The standout strength was business investment. Nonresidential fixed investment surged at a 10.4% annualized pace in Q1, contributing 1.4 percentage points to GDP growth. Equipment spending led the gain, with information processing equipment driving the bulk of the increase. The surge in equipment purchases likely reflects the buildout of AI, as well as efforts to reshore production in semiconductors, pharmaceuticals, and advanced manufacturing. Software prices declined sharply in the quarter, which mechanically boosted real software investment, but the underlying capex story is real. Capital deepening, particularly tied to AI infrastructure, is becoming the most durable feature of this expansion.
Government spending added 0.8 percentage points to GDP growth, primarily reflecting a partial rebound in federal nondefense outlays from the Q4 shutdown drag. The bounce was smaller than expected — federal spending in Q1 remained more than 2% below its mid-2025 level — and the recovery from the shutdown is likely to extend into Q2. Inventory accumulation contributed 0.4 percentage points, less than many had penciled in heading into the print. Net exports subtracted 1.3 percentage points, with imports of AI-related electronics rising sharply ahead of the resolution of certain tariff disputes earlier in the year.
Residential investment fell at an 8% annualized rate, consistent with the declining volume of homes and apartments under construction, as well as the slide in Q1 starts and permits that we wrote about yesterday. The slide in home building has not ended, but the pace of deterioration is moderating.
Labor Market: Confirmation From the High-Frequency Data
If the headline GDP number invites a debate about whether the underlying expansion is durable, this morning’s labor market data settle that debate decisively in favor of the bulls. Initial jobless claims fell to 189,000 in the week ending April 25, down 26,000 from the prior week and well below expectations. The four-week moving average dropped to 208,000, the lowest reading in months. Continuing claims declined to 1.785 million.
The week’s print was flattered by a meaningful decline in New York claims that more than reversed a spike the prior week, likely a seasonal-adjustment artifact tied to spring break timing. Even adjusting for that, the broader trend in claims is consistent with a labor market that has stopped weakening and may even be firming a touch. That is a meaningful piece of corroborating evidence. When jobless claims, which arrive weekly and require no seasonal-adjustment heroics from the BEA, line up with what real final sales to private domestic purchasers are saying about the underlying pace of demand, the case for the resiliency narrative is much stronger than the GDP headline alone would suggest. The claims data are confirming what the income side of the GDP report is telling us: businesses are not laying off workers at any meaningful rate, and the demand side of the economy continues to support employment.
The Employment Cost Index, the cleanest measure of labor cost pressures, rose 0.9% in Q1, a tenth above expectations and an acceleration from the 0.7% pace in Q4. Wages and salaries rose 0.8%; benefits costs rose 1.2%, the strongest quarterly gain in some time. The benefits component is volatile quarter to quarter, but the trend is worth thinking about. Slower voluntary turnover is likely a meaningful contributor. When fewer workers quit for new jobs, employers carry more of the long-tenured workforce, and benefit costs — which are heavily seniority- and tenure-weighted, particularly for health insurance and retirement contributions — naturally rise. The same dynamic that is pushing benefits costs higher is also reducing training and onboarding costs and, plausibly, supporting productivity growth. That second-order effect deserves more attention.
The Consumer: Goods Held Up, Services Moderated
Personal consumption rose at a 1.6% annual rate in Q1, a step down from the 1.9% pace in Q4. The aggregate number is solid given the headwinds, but the composition is what matters. Goods spending held up, helped by a strong March print that reflected the warmer weather, tax refunds running roughly 17% above last year’s pace, and some pull-forward of big-ticket purchases ahead of further price increases. Services spending, by contrast, has clearly moderated. The early read is that higher gasoline prices, which have averaged above $4 per gallon since the war began, are doing what they typically do — pulling discretionary dollars away from things like restaurants, travel, and other away-from-home activities.
Households appear to be staying in a little more, dining out a little less, and trading down within the categories where they continue to spend. That pattern is a familiar response to an energy shock, and it tends to persist for several quarters after the initial price impulse. Real disposable income rose just 0.2% in March, with most of the headline gain in personal income reflecting payments under the Farmer Bridge Assistance program rather than broad-based wage gains. The personal saving rate fell to 3.6%, the lowest since 2022, which means consumers are saving incrementally less of every dollar earned. At the micro level, middle-income and lower-middle-income households are likely dipping into savings to support spending. That is not sustainable indefinitely, but with the labor market firm and tax refunds still flowing, it is sustainable for now.
Inflation: Energy Doing the Work
The PCE price data released alongside GDP showed headline PCE up 0.66% month-over-month and 3.50% year-over-year in March, reflecting a 12% monthly surge in energy prices. Core PCE rose a more measured 0.29% month-over-month and 3.20% year-over-year, which was no worse than expected. The Dallas Fed’s trimmed-mean PCE, which strips out the most volatile categories on either side of the distribution and is the cleanest filter on the FOMC’s preferred index, ran at an estimated 2.4% year-over-year in March.
The underlying disinflation story remains intact. Core goods prices have firmed somewhat, partly reflecting the AI-related demand pulse for electronics and partly the early pass-through from higher fuel costs into transportation and freight. Core services inflation continues to moderate as housing services finally cool meaningfully. The Fed will look through the headline energy spike, as it should. The harder question is whether the war-related cost impulse begins to lodge itself in core categories during the second half. So far, the trimmed-mean evidence says no, but the next two PCE prints will be closely scrutinized.
Outlook: Q2 Held at 2.8%
We continue to look for Q2 real GDP growth at 2.8%, unchanged from our prior forecast. The composition shifts modestly. Base effects and tax refunds are expected to pull consumer spending up at a 2.2% pace, with most of that gain concentrated at the start of the quarter as refunds fade after Memorial Day. Real final sales to private domestic purchasers should rebound back above a 3% pace, as capital spending remains strong and housing stabilizes somewhat. Several of the Q1 drags reverse: net trade improves as the tariff-related import surge fades and U.S. petroleum exports rise on the Hormuz disruption; inventories rebuild after the smaller-than-expected Q1 contribution; and government spending continues its catch-up from the shutdown.
The risks remain skewed to the downside, but less than they did a month ago. The war is the dominant variable. A negotiated reopening of the Strait of Hormuz by late May or early June would bring Brent back toward $90 over the summer and remove the principal headwind on services consumption. A breakdown in those talks would push Brent toward $120 or higher and meaningfully cut into Q3 growth. The labor market and underlying business investment, particularly in AI infrastructure, look durable enough to absorb a moderate energy shock without breaking. They would not absorb a severe one easily.
Implications
The expansion is more durable than the headline suggests, and the labor market confirms it. Real final sales to private domestic purchasers rose 2.5% in Q1, in line with the underlying trend. Initial jobless claims at 189,000 — the lowest in months — corroborate that signal. The economy can absorb a moderate energy shock and a brutal February without rolling over, and the AI-related capex cycle is showing no signs of fading.
The consumer slowdown is visible in services. Goods spending is holding up, supported by tax refunds and some pull-forward demand. Services spending, particularly in the away-from-home discretionary categories — restaurants, travel, recreation — has clearly moderated. Watch the May and June numbers for confirmation. If gasoline stays above $4 per gallon into the summer driving season, the services drag will broaden.
The Fed remains on hold through summer. The 2.0% growth print, the firm labor market, and the slight acceleration in the ECI on benefits all argue against any near-term move. A September cut is still our base case, but the bar is higher than it was a quarter ago. Headline inflation will run hot through Q2 on the energy pass-through, and the FOMC will want to see that the underlying trimmed-mean trend remains contained before easing.
Slower voluntary turnover is a quiet productivity tailwind. It boosts benefit costs visible in the ECI, but it also reduces training and onboarding costs and allows longer-tenured workers to compound their experience. That tradeoff probably nets positive for productivity in 2026, even if it is not yet showing up in the headline labor compensation data.
Bottom Line
The Q1 GDP report is best read as a reassuring sign that the U.S. economy can weather a meaningful energy shock and a difficult winter. Past oil shocks have tripped up the economy with surprising regularity; this one, so far, has not. A 2.0% headline print after a brutal February, a largely unforeseen oil shock, and a residual government shutdown drag is a more durable result than the headline alone suggests. Real final sales to private domestic purchasers rose 2.5%, consistent with the trend that has held since mid-2023, and business investment surged on the AI buildout. The labor market is firm — initial claims at 189,000 are the lowest in months — and the underlying disinflation story remains intact. The consumer is moderating, with services bearing the brunt of higher gasoline prices, but moderation is not weakness.
We continue to look for Q2 growth at 2.8%, with the composition shifting toward inventories and net trade and away from the consumer. The Fed remains on hold through summer. A September rate cut remains our base case, but headline inflation running above 3% in the near term will keep the FOMC patient. The expansion is intact. The questions are about pace, not direction.