
A VIEW FROM THE PIEDMONT
"A shoal is not a storm. Storms are remembered. Shoals are run aground on slowly, while the crew debates whether the chart is wrong."
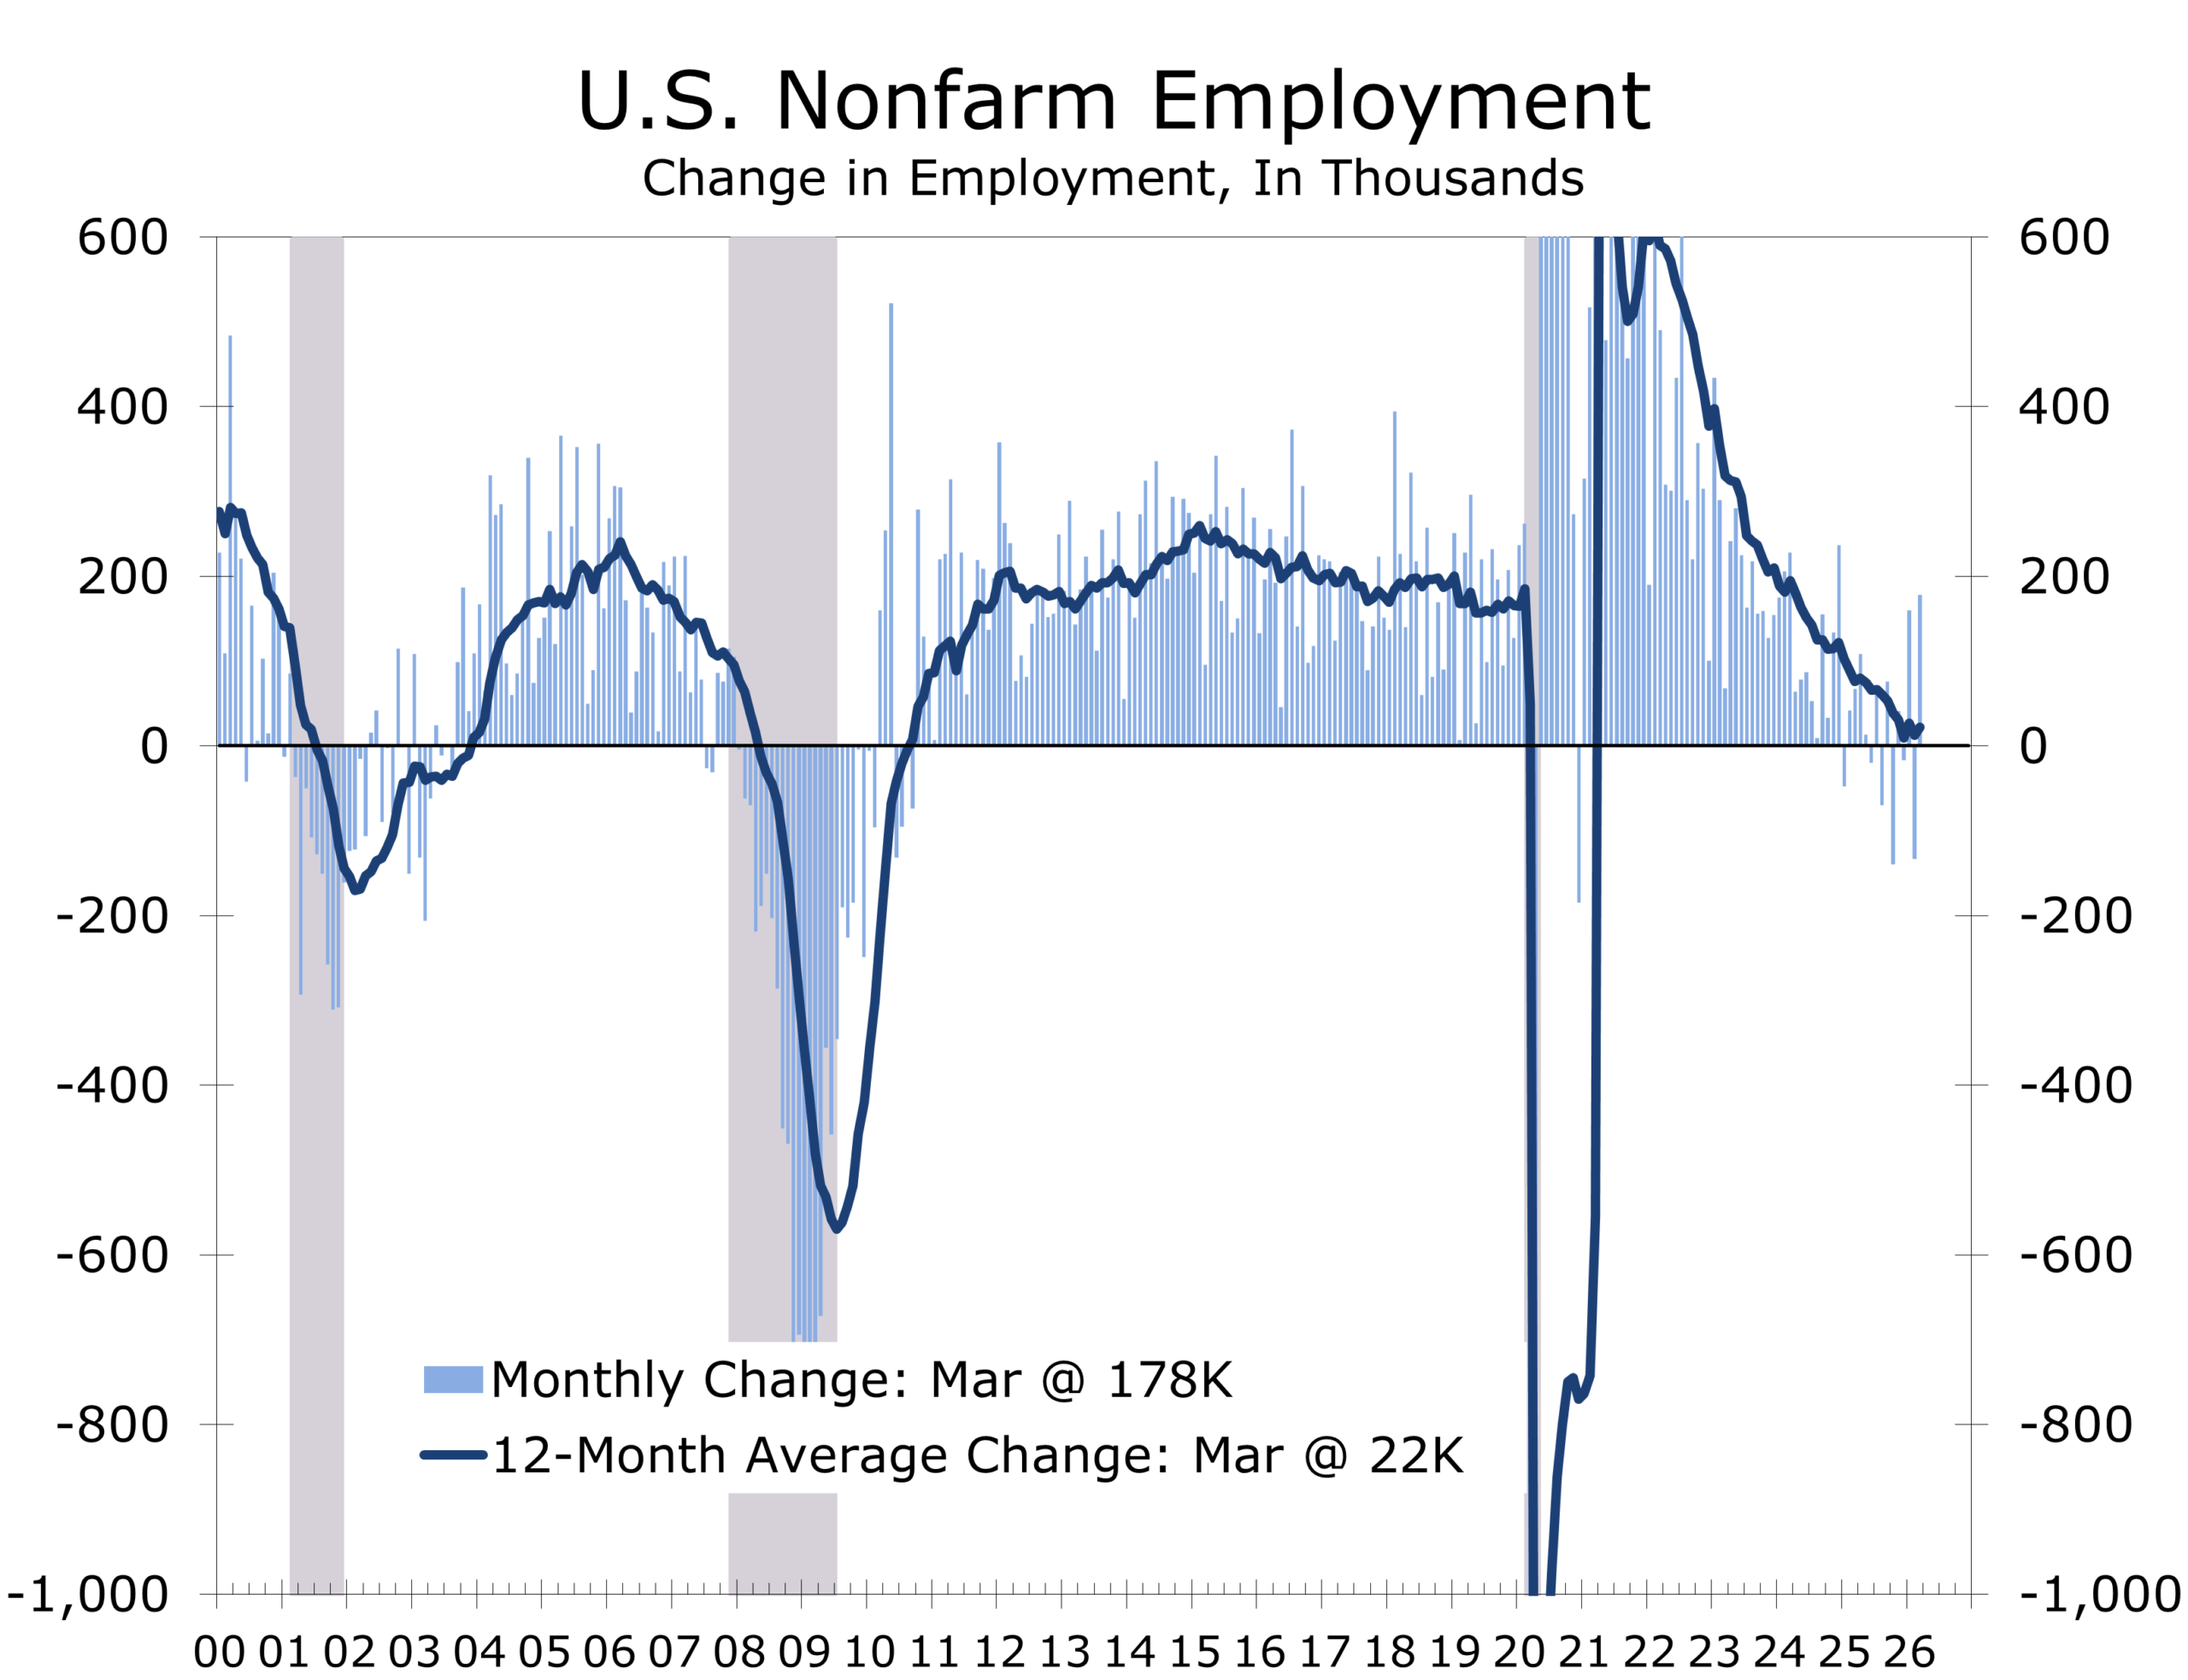
The past week brought a familiar but increasingly consequential divergence between the data we have and the risks we are still learning to price. The March employment report showed payrolls rising by 178,000, a strong reversal from February's revised decline of 133,000 and well above the consensus estimate of 59,000. On the surface, this looks like a resilient economy. But the underlying details, combined with what is happening in energy markets, tell a more measured and sobering story.
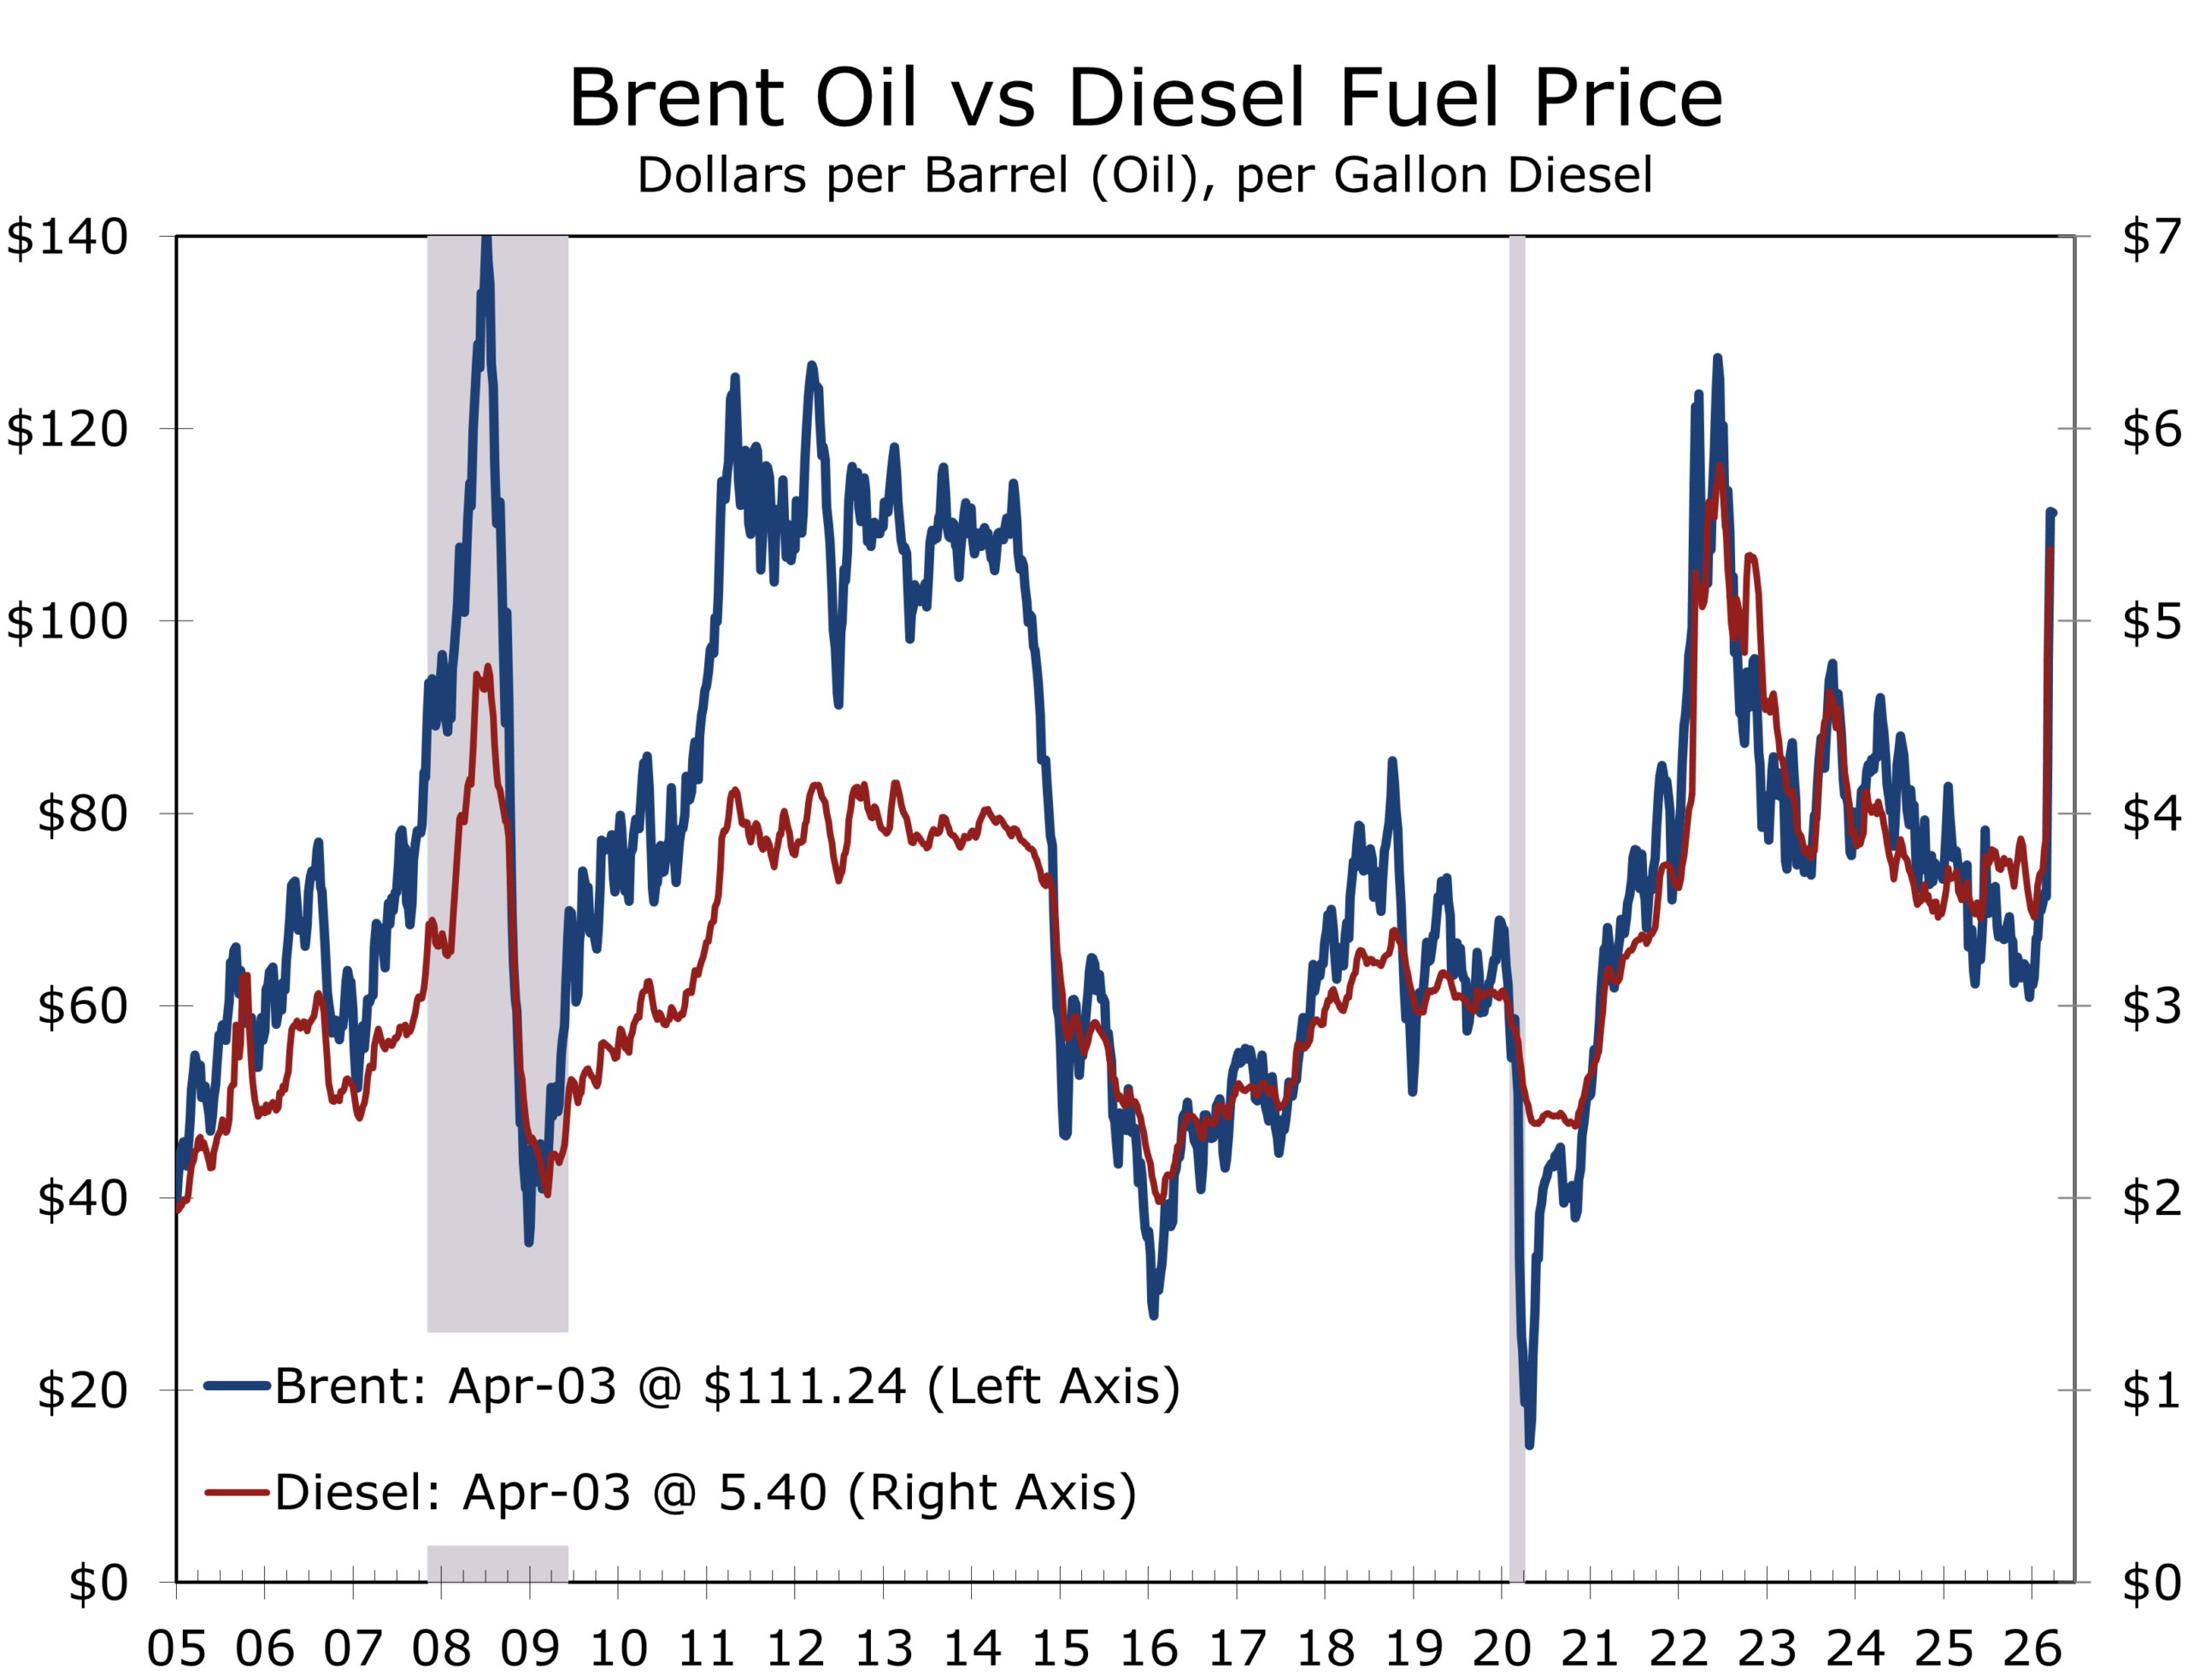
Oil ended the week with Brent near $109 per barrel and WTI above $111 — the market's highest sustained levels since 2022 — following President Trump's pledge to escalate military action against Iran with no concrete plan to reopen the Strait of Hormuz. Treasury yields held near 4.31% on the 10-year even as growth concerns persisted, and gold settled around $4,677 per ounce after a volatile week shaped by stronger than expected reports on nonfarm employment, retail sales, and consumer confidence. Financial conditions have tightened, reflecting higher energy prices and their likely near-term spillover into grocery prices.
The U.S. economy entered this energy shock in better shape than many feared, but that is different from saying it can absorb it without cost. The March employment report confirmed a labor market that is resilient on the surface and fragile underneath. The 178,000 gain was driven largely by a rebound in healthcare — where 76,000 jobs returned after strike-related losses in February — along with construction (+26,000), transportation and warehousing (+21,000), and manufacturing (+15,000). Federal government employment declined again (-18,000), extending a trend that has now persisted for months. The three-month average of roughly 68,000, well below the 200,000-plus pace of late 2025, tells the more accurate story: hiring has slowed to a crawl. The unemployment rate edged down to 4.3%, but that improvement reflected a drop in labor force participation to 61.9%, not a broad improvement in demand.
The 'no-hire, no-fire' equilibrium remains the defining feature of the labor market. Firms are producing more with fewer workers, supported by capital investment and ongoing productivity gains. Reduced voluntary turnover is playing an underappreciated role — with separations exceeding hires in February on a net basis, businesses are retaining incumbent workers at higher rates, lowering onboarding costs and raising average experience levels. Wage growth of 3.8% year-over-year remains firm and has run slightly above that pace over the past three months. With the war and higher gasoline prices front and center, spending is likely to stay restrained. The drag from $4-plus gasoline and financial market volatility will probably offset the lift that larger tax refunds are expected to provide in April and May.
The Strait of Hormuz has moved from tail risk to binding constraint. Ship traffic remains severely impaired, hundreds of tankers are idle, and Middle Eastern producers have slashed output by an estimated seven to twelve million barrels per day since the conflict began. WTI briefly surged above $111 per barrel this week after President Trump pledged more aggressive action against Iran and offered no concrete plan to reopen shipping lanes — crossing the threshold that markets have historically associated with regime change in global energy pricing, not merely volatility. A report that Iran is drafting a monitoring protocol with Oman provided brief relief, but the ceasefire optimism has repeatedly proven premature.
What matters now is less the price level than the nature of the disruption. Even partial impairment of Hormuz introduces delays, raises insurance and transport costs, and fractures supply chains extending well beyond crude oil. Fertilizers, liquefied natural gas, industrial gases including helium, and a range of petrochemical inputs are all exposed. Market estimates suggest OECD commercial crude inventories are set to decline sharply through April and into early May, potentially approaching operational minimums. At that point, the dynamic shifts. The market is no longer absorbing the shock. It is beginning to ration supply. Storms pass; shoals remain. The risk is not a price spike that corrects. It is a sustained period of elevated costs and constrained logistics that slowly erodes growth.
The inventory picture deserves careful reading. U.S. crude stocks rose by 5.5 million barrels in the week ending March 27 to 461.6 million barrels — the highest since June 2023 — and that headline number has tempted some observers toward complacency. It should not. The composition matters more than the total. Gasoline inventories fell by 586,000 barrels, distillate inventories fell by 2.1 million, and petroleum product exports hit a record high as overseas buyers scrambled for refined fuel. OPEC output plunged by 7.3 million barrels per day in March to its lowest level since June 2020. The United States is not short of crude in storage. It is increasingly tight in refined products, particularly diesel and middle distillates — which are the bloodstream of freight, industry, agriculture, and aviation. The IEA's Fatih Birol warned that April could be twice as difficult as March for global energy supplies, with diesel and jet fuel shortages the most acute near-term risk, especially in Asia and Europe by May. The national average for gasoline has reached $4.12 per gallon and is rising.
Forecasts run the gamut. BCA Research's geopolitical team assigns a 70% probability to a continued massive oil shock scenario based on its decision tree analysis, with only 30% probability of meaningful de-escalation in the near term. Their key insight is that the conflict's resolution hinges on a narrow window: President Trump has a political incentive to reduce energy costs before the midterms, but Iran's incentive to hold Hormuz leverage is greatest precisely now — before a U.S. election, not after. The window for a temporary Hormuz monitoring arrangement is real, but it is closing. If Iran keeps striking regional energy supply through mid-April, BCA argues the conflict will shift from an election constraint to a regime-change objective, a fundamentally different and more dangerous footing for markets.
Europe is once again in the most exposed position. Qatar's LNG disruption has driven European benchmark gas prices sharply higher, and regional storage remains critically low, with Germany at roughly 27% capacity, the Netherlands near 10%, against a seasonal norm above 50%. A prolonged disruption would simultaneously strengthen Russia through higher energy revenues, complicate European support for Ukraine, and remind investors that the continent's strategic ambitions remain well ahead of its energy security. History has a habit of sending the bill twice.
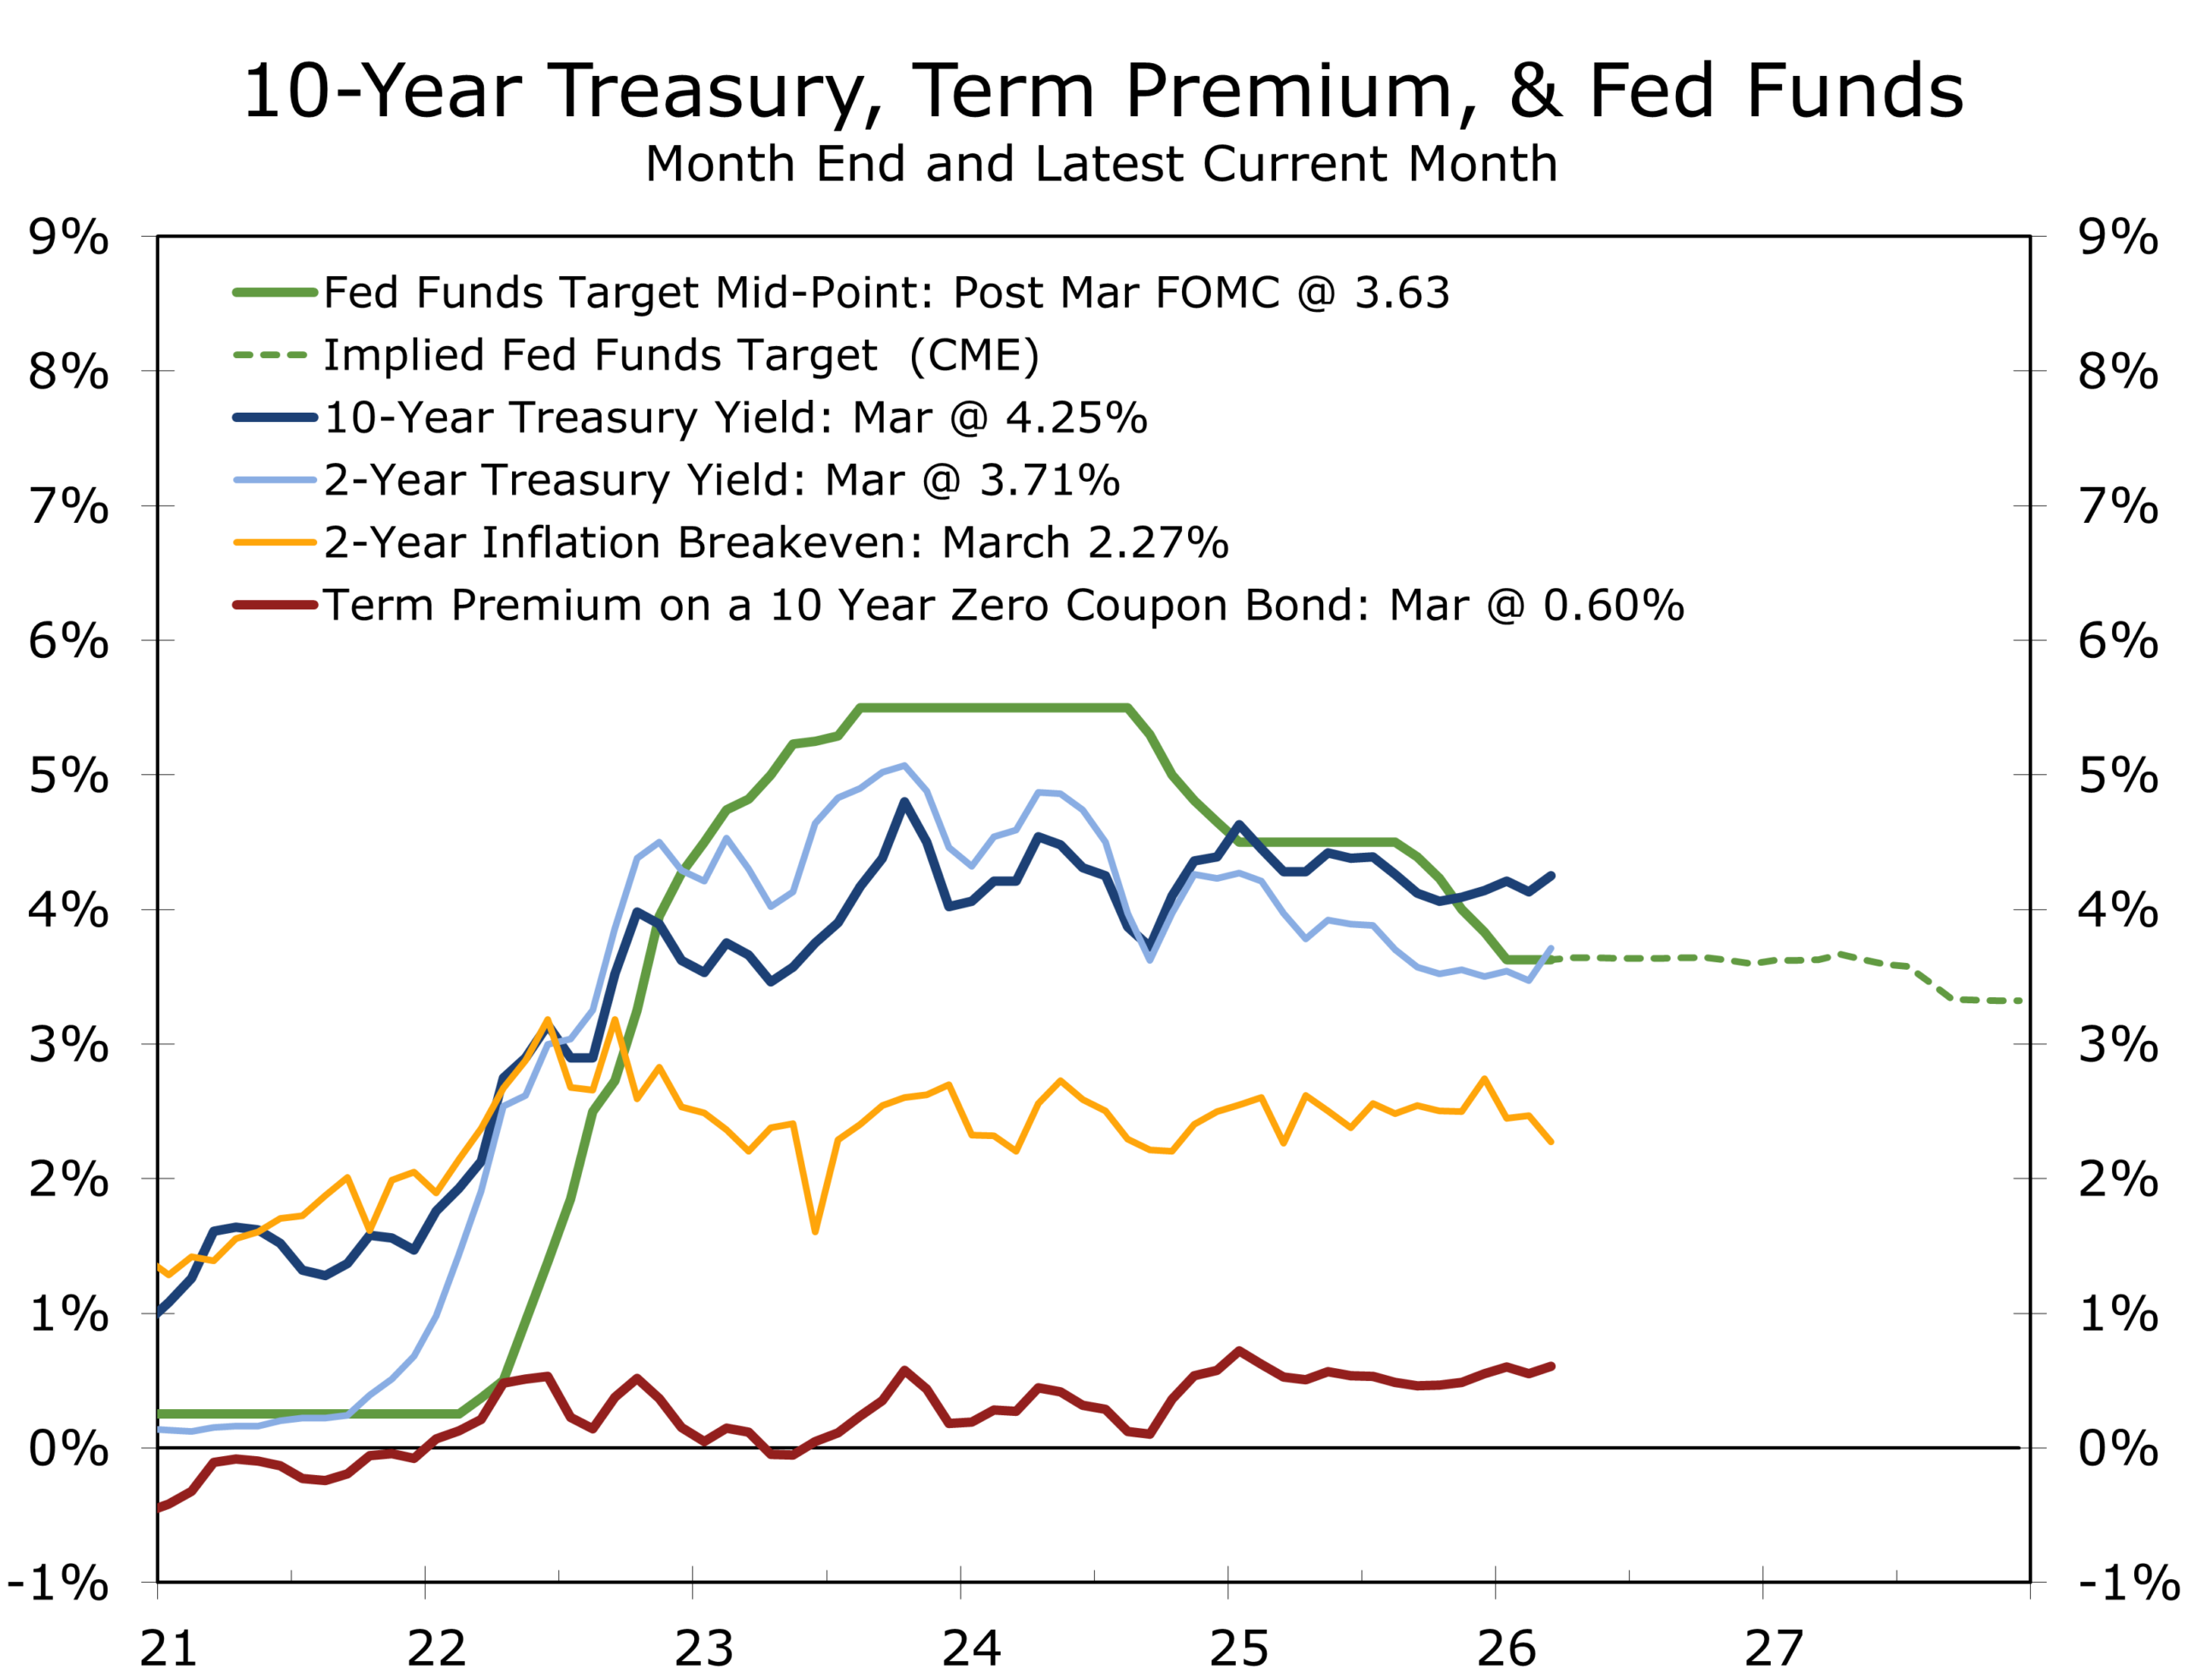
Financial markets are not simply reacting to this shock. They are repricing it. The distinction matters. Initial reactions often overshoot and reverse. Repricing tends to persist. Oil, the dollar, Treasury yields, equity markets, and gold are no longer moving independently. They are moving as a system. That system is sending a consistent message. Financial conditions are tightening materially, even without a rate increase from the Federal Reserve.
The 10-year Treasury yield held near 4.31% this week. The 2-year stood at 3.79%. The curve is now positively sloped by 52 basis points. That reflects both near-term growth expectations and a rising term premium.
The nomination of Kevin Warsh as the next Fed chair, often called the "Warsh Shock" by traders, has reinforced the view that monetary accommodation is further off than markets expected at the start of the year. CME FedWatch now shows a 77.5% probability that the Fed remains on hold through year-end. The probability of a cut at the April 28–29 FOMC meeting is effectively zero.
Gold's behavior has been equally instructive. Prices swung between $4,622 and $4,720 within a single week. The move reflects more than geopolitical risk. It signals a broader reassessment of real yields, dollar strength, and the fiscal outlook.
When oil, gold, the dollar, and long-term yields tighten at the same time, the transmission is direct. Corporate borrowing costs rise. Equity valuations adjust quickly.
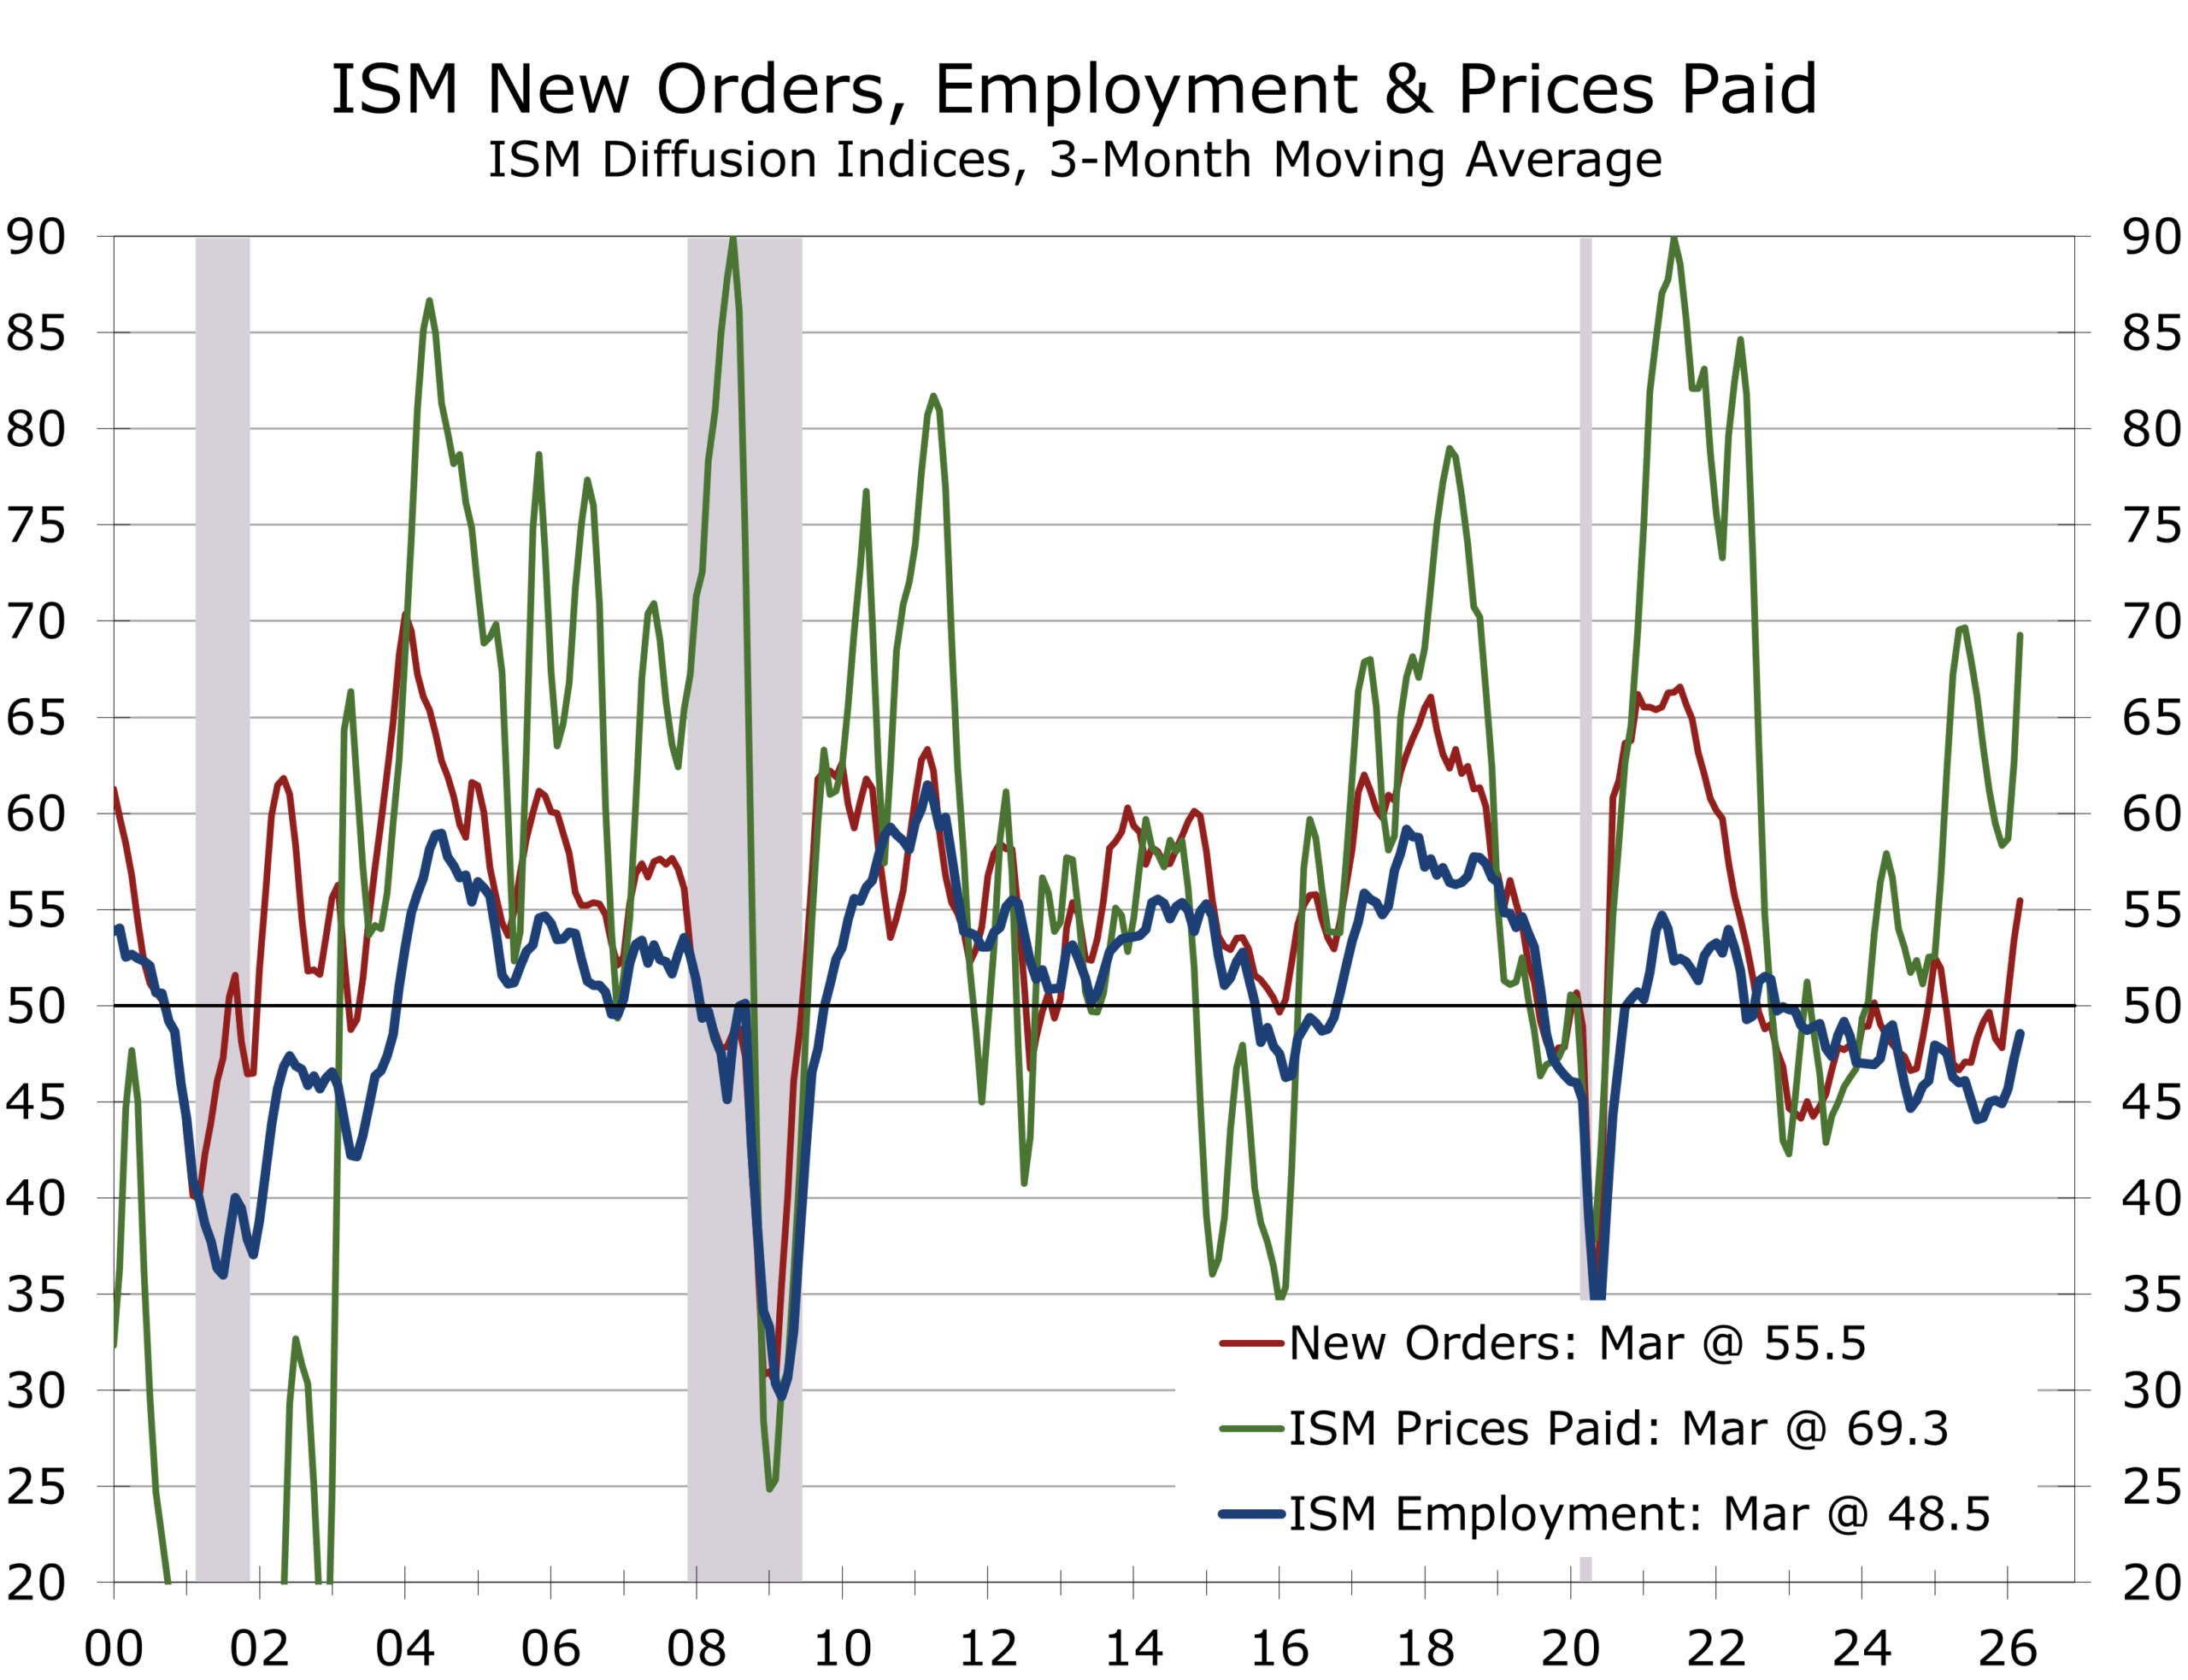
Manufacturing data reinforced the friction theme this week. The ISM Manufacturing Index rose modestly to 52.7 in March. That marks a third consecutive month of expansion. The internal composition is becoming more concerning.
The Prices Paid component surged 19.3 percentage points over the past two months to 78.3. That is the highest reading since June 2022. Seventeen of eighteen industries reported higher costs.
ISM Chair Susan Spence noted that the employment index remains "stubbornly stuck in contraction" at 48.7. Firms are holding headcount steady rather than adding staff. New orders softened. Supplier delivery times lengthened. Respondents cited Middle East shipping delays directly.
This is not the profile of an overheating economy. It is the profile of an economy encountering friction. The topline is expanding. Cost pressures are building. Those pressures will show up in margins, hiring decisions, and pricing behavior.
Funding & Liquidity: The fixed-rate issuance window remains open. The trajectory is becoming less favorable. Markets are pricing no Fed cuts in 2026. Term premium is rising. The case for locking in fixed-rate financing is strengthening. Floating-rate borrowers remain exposed. Review covenant headroom. Stress test interest coverage if the 10-year holds above 4.5% through year-end.
Energy & Input Costs: Brent is above $109. Diesel prices remain elevated. Firms with exposure to freight, logistics, or petrochemical inputs should stress test 2026 cost assumptions now. OECD inventories are drawing toward operational minimums. The window to pre-buy or hedge inputs may be short. Fertilizer and LNG-linked supply chains require immediate review.
Working Capital: Higher energy and freight costs are creating a slow-moving squeeze on working capital. Transportation and warehousing firms absorbed the first wave. Consumer goods and industrial firms are next. Companies with just-in-time supply chains and limited inventory buffers face the greatest risk. Margin pressure is likely to build in Q2 and Q3.
Planning Assumption: Base case — Hormuz risk is contained but not resolved. Brent stabilizes in a $95 to $110 range. The Fed remains on hold through 2026. GDP growth runs near 2.0% to 2.5%. Stress case — Disruption persists through Q3. Oil rises to $120 to $130. Inflation re-accelerates. Credit spreads widen by 50 to 75 basis points. Build both scenarios into Q2 board discussions.
| Day | Release / Event | Why It Matters for CFOs & Markets |
|---|---|---|
| Monday | ISM Services PMI (March): Look for a pullback from last month's strong reading. | Services have held strong at around 56. We will likely see a pullback. Any softening here signals demand erosion that manufacturing data cannot yet show. |
| Tuesday | Durable Goods Orders, Feb. prelim.: Look for a headline drop, focus on core capital goods; Fed Vice Chair Jefferson speaks. | Factory orders will provide a cross-check on capex momentum. The headline orders will likely come in soft as commercial aircraft orders reverse, but core capex orders should rise 0.5%. Jefferson's remarks on energy and inflation will be parsed closely for any shift in the Fed's patience threshold. |
| Wednesday | FOMC Minutes (Mar. 17–18); Wholesale Inventories; Consumer Credit. | The minutes are the policy signal of the week. The March meeting was slightly hawkish. Look for how much weight the committee is placing on energy-driven inflation versus labor market softening. Rising inventories would suggest weakening final demand. |
| Thursday | Personal Income & Spending (Feb); PCE Inflation (Feb); GDP Q4 third est.; Initial Claims. | The PCE will likely come in slightly below consensus — a softer reading would be the first data point suggesting the inflation impulse is lagging the energy shock. GDP Q4 revised to +0.8%. Claims above 220K would begin to challenge the no-fire labor equilibrium. |
| Friday | CPI (March): Look for the headline CPI to jump 0.7% on sharply higher gasoline prices, core +0.3%; Michigan Sentiment prelim. | Sharply higher gasoline prices will boost the headline CPI, but not as much as the markets currently fear. The energy shock will take a few months to be fully reflected in the CPI data. The critical question is whether core services accelerate, signaling the shock is embedding in broader pricing. Michigan inflation expectations will reveal whether household psychology is shifting. |
The interpretation of the CPI will matter more than the number itself. A firm reading alongside stable labor market data supports the narrative of resilient growth with higher inflation. A softer services print or rising claims shifts the focus to demand erosion — a much harder environment for policymakers to navigate. The expansion is not ending. But it is entering a more difficult phase. The shoals are now visible. The task ahead is to navigate them.
| Scenario | Macro & Market Implications | Corporate Finance Action |
|---|---|---|
| Base Case (50%) | Oman monitoring protocol or something similar is enacted by late spring; Brent stabilizes $95–110; Fed on hold; GDP 2.0–2.5%; CPI rises to 3.3–3.5% on energy, then moderates. | Lock in fixed-rate maturities now. Stress-test energy/freight in 2026 budgets. Maintain liquidity buffers above minimums. Use this time to take precautions against the alternatives. |
| Downside (30%) | Disruption persists through Q3; oil $120–130; inflation re-accelerates to 4%+; credit spreads widen 50–75 bps; Fed forced to hold or hike. | Accelerate issuance ahead of wider spreads. Model demand destruction in revenue forecasts. Limit new floating-rate exposure. |
| Tail Risk (20%) | Infrastructure damage or Hormuz closure extends through year; oil $140+; global recession risk rises sharply; dollar surges; EM stress. | Maximize liquidity; draw revolvers preemptively; halt discretionary capex; model severe demand contraction scenarios. |
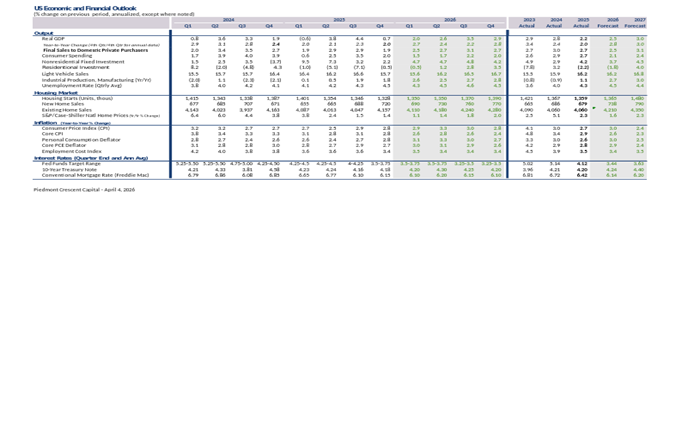
(% change on previous period, annualized, except where noted)
Piedmont Crescent Capital — April 6, 2026
This publication has been prepared for informational purposes only and is not intended as a recommendation, offer, or solicitation with respect to the sale of any security or other financial product, nor does it constitute investment advice.