Key Takeaways
- Metro Growth Rate: Fell from 1.1% (2023–24) to 0.6% (2024–25) — the sharpest single-year deceleration of the post-pandemic period, with metros adding only 1.7M residents vs. ~3.2M the prior year.
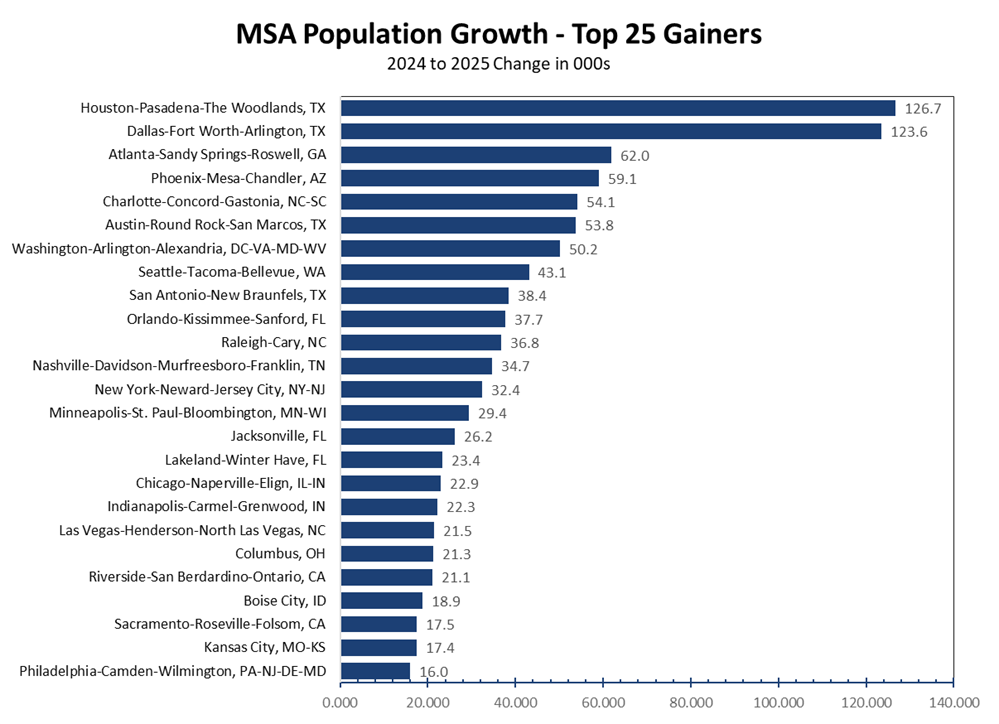
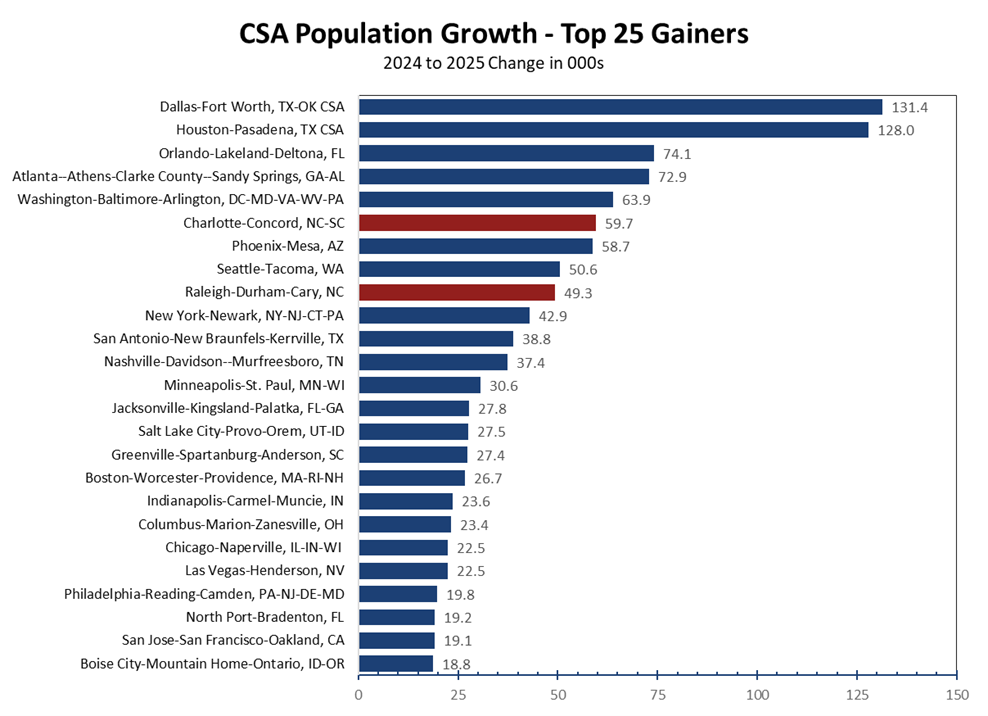
- Top Numeric Gainers: Houston, Dallas-Fort Worth, Atlanta, Phoenix, Charlotte — all in the South/Sun Belt corridor. Texas alone claimed four of the top nine metros by numeric gain..
- Top % Growth: Ocala, Myrtle Beach, Spartanburg, Lakeland, Punta Gorda, Huntsville — smaller markets riding domestic inflows as primary Sun Belt hubs fill in and costs rise..
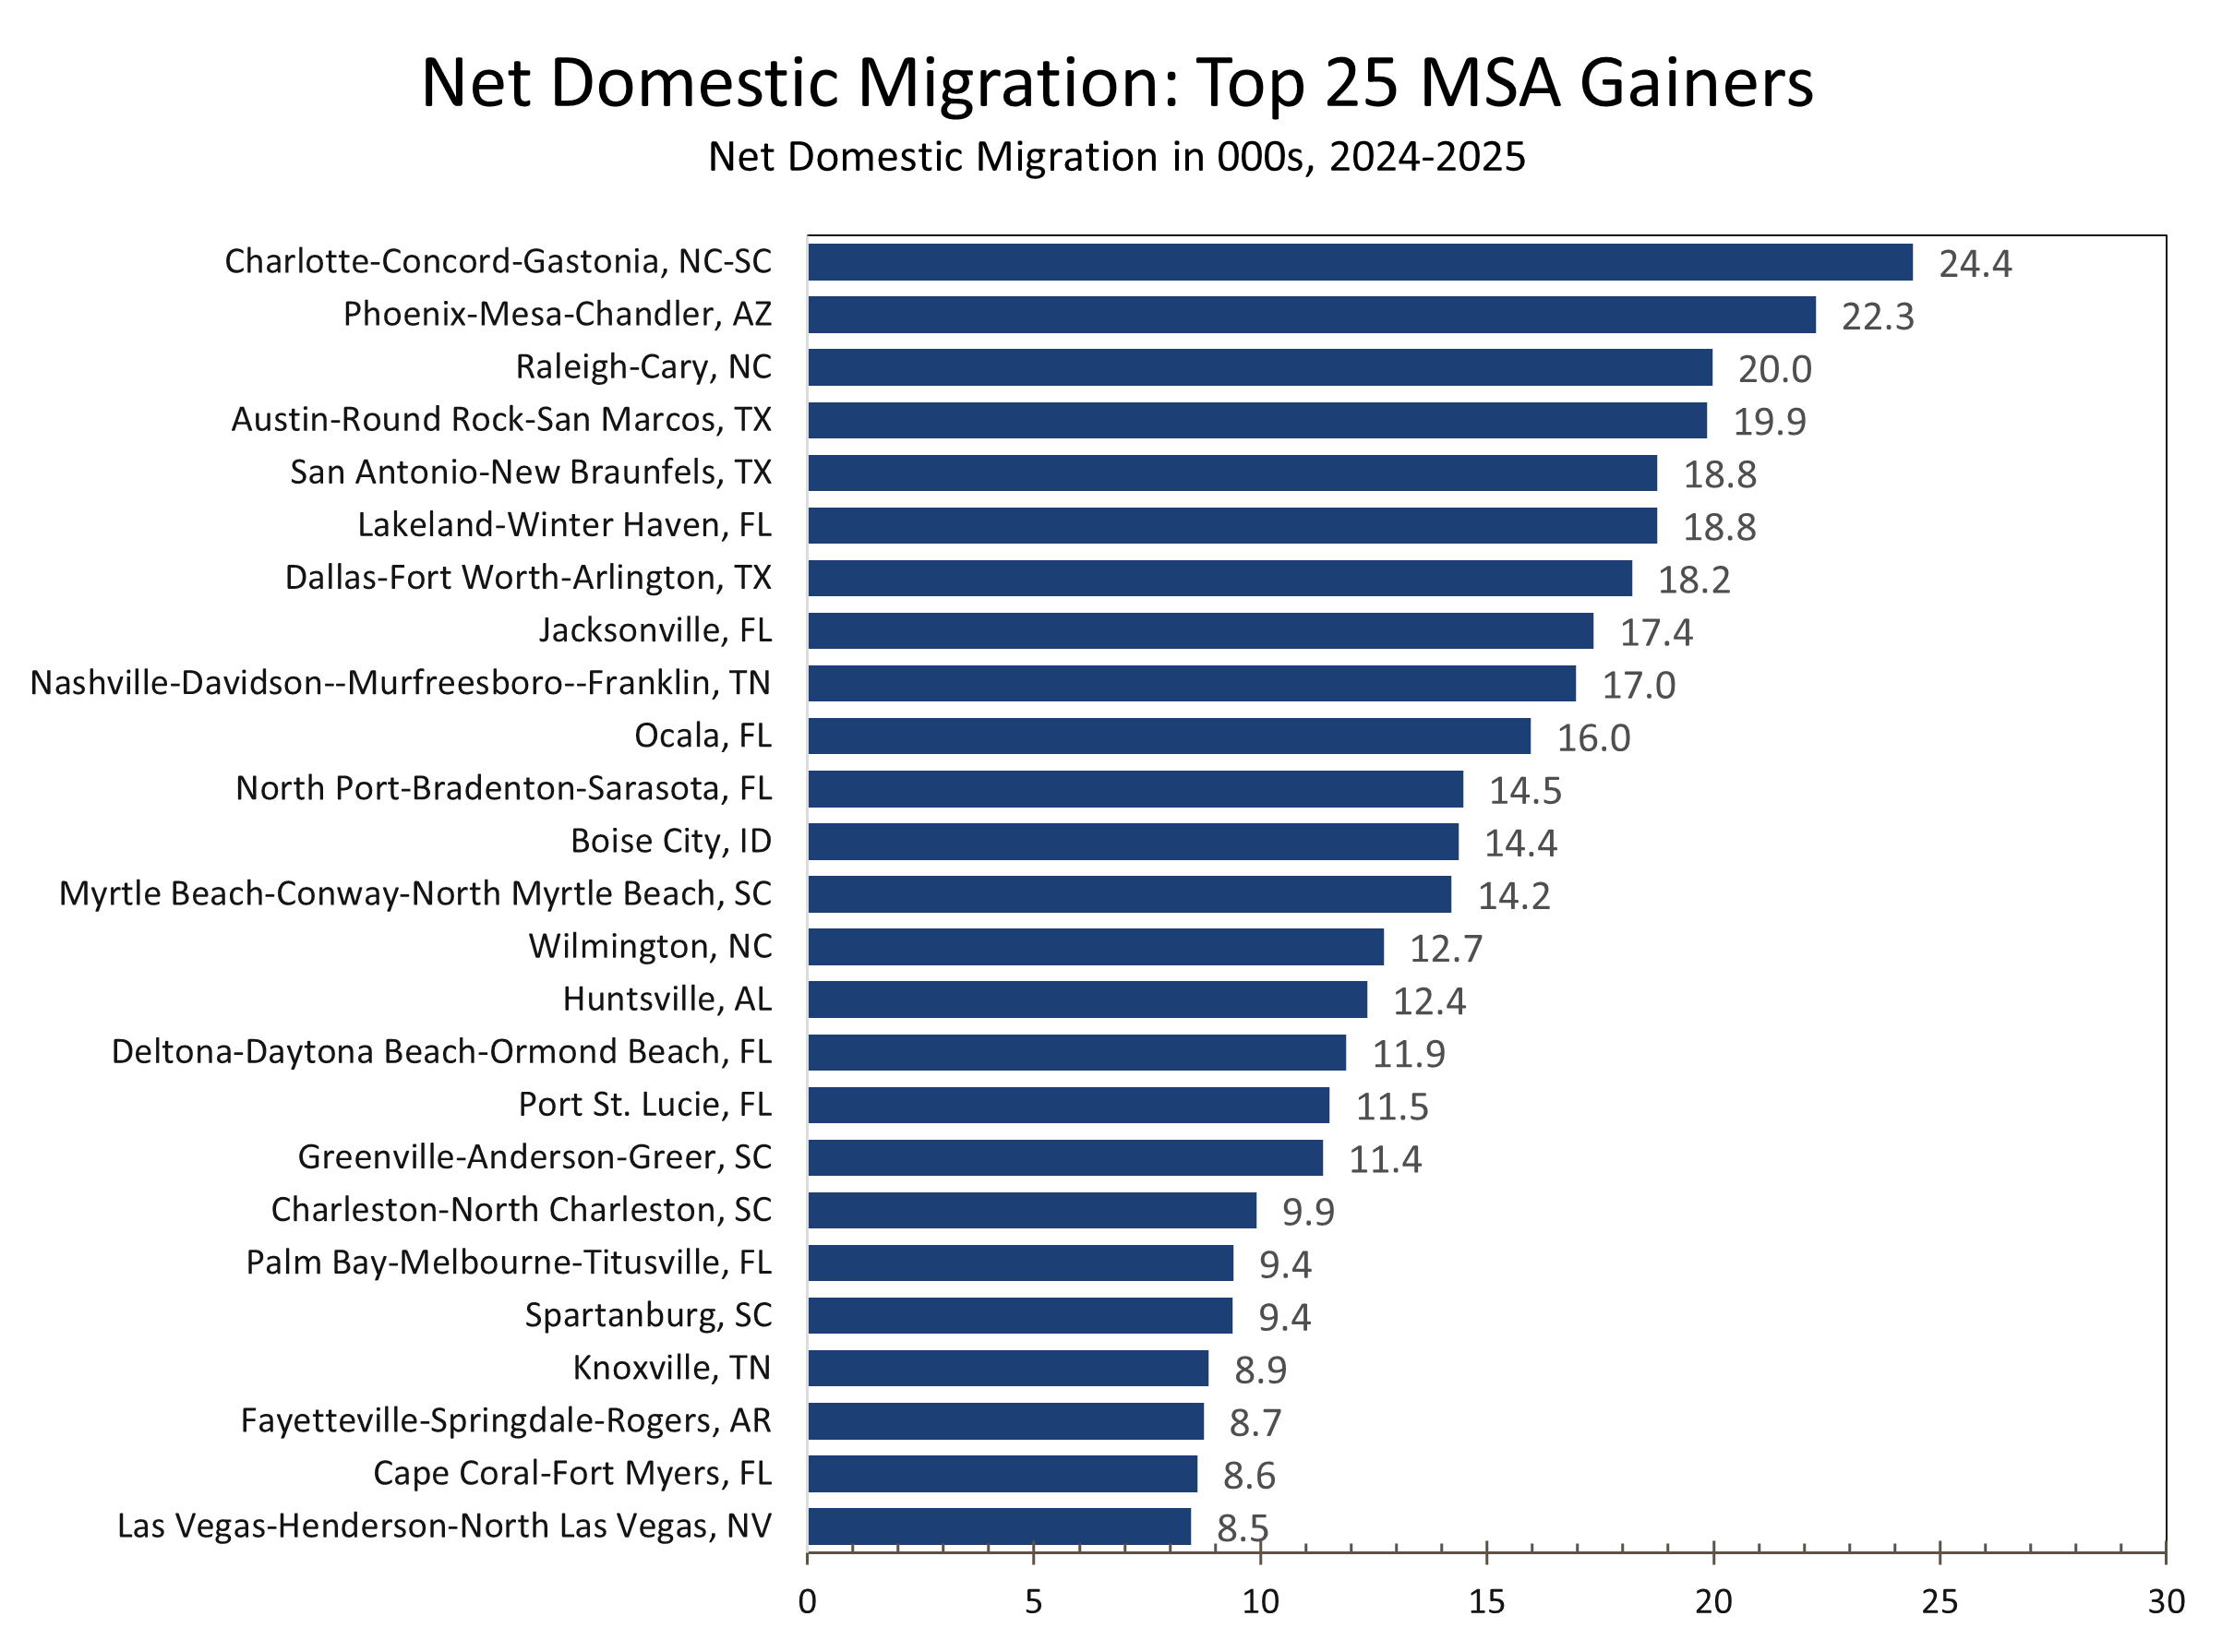
- Domestic Migration: Charlotte led all 387 MSAs in net domestic in-migration; Phoenix, Raleigh, Austin, San Antonio follow. NC ranked 3rd nationally in IRS net migration (79,317 individuals on 40,999 returns).
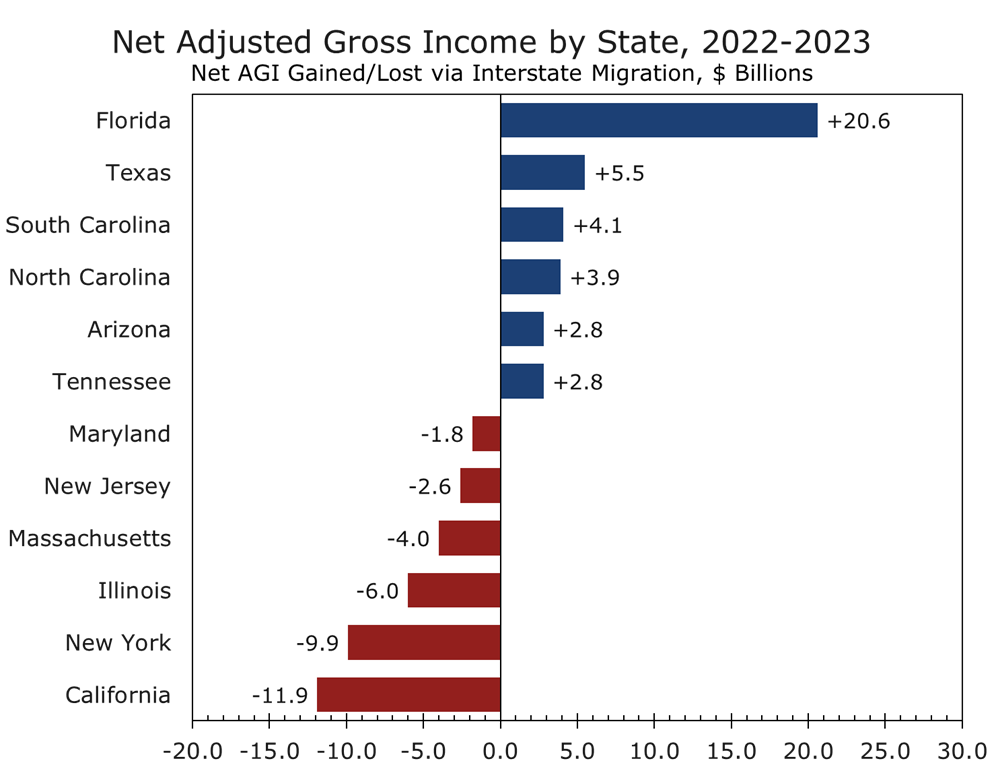
- Wealth Redistribution: IRS data confirm this is not just a headcount story: NC gained $3.9B and SC gained $4.1B in net AGI in 2022–23. The Carolinas combined captured $8.0B — trailing only Florida and Texas. NY lost $9.9B. CA lost $11.9B..
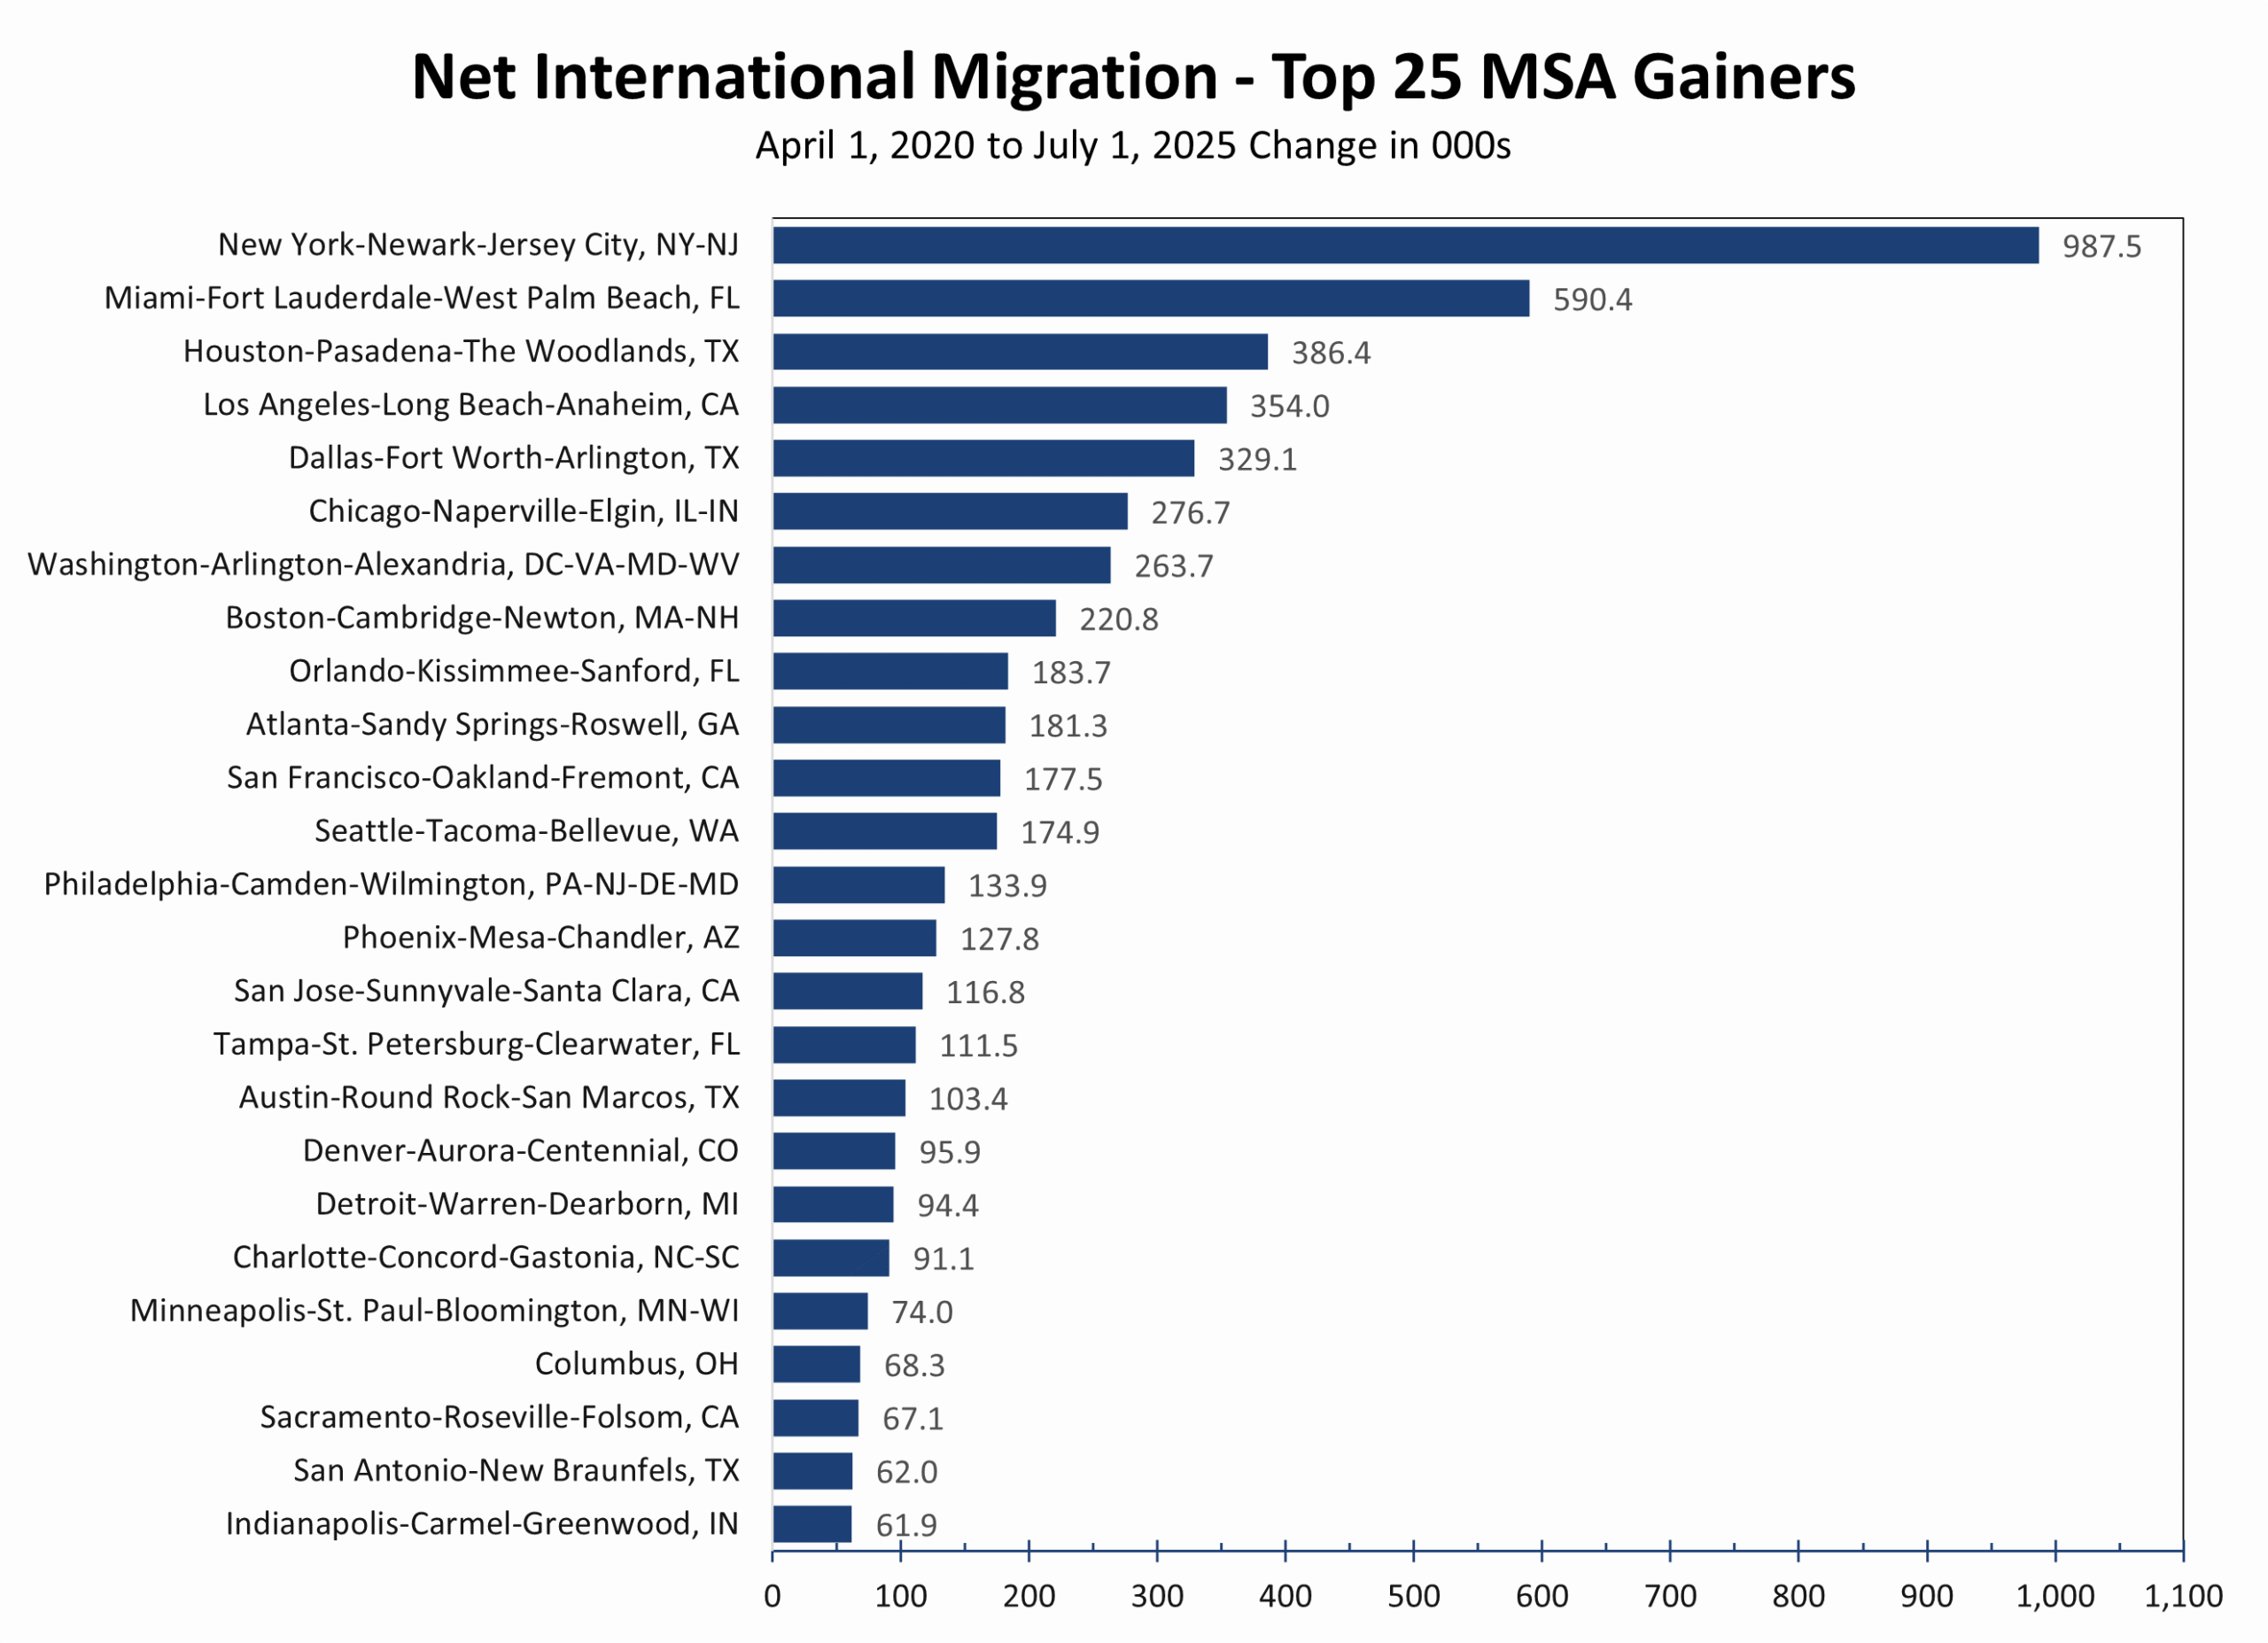
- Gateway Metros: Los Angeles, Miami-Dade, and the NYC metro are losing population or stagnating as immigration recedes. New York fell from 1st to 13th in numeric gains in a single year..
- Border MSAs: Laredo (3.2%→0.2%), Yuma (3.3%→1.4%), El Centro (1.2%→-0.7%) — sharpest growth-rate collapses; these border markets lead the national immigration trend by 6–12 months.
- Piedmont Corridor: Charlotte, Raleigh-Durham, and the resurging Piedmont Triad form one of the most durable growth corridors in the Southeast, confirmed by both Census headcount and IRS income-flow data.
- Key Risk: Nine of ten U.S. counties recorded lower net international migration in 2024–25. The trend is accelerating under the current enforcement policy and will take 12–24 months to fully manifest.
Data Note: This report draws on two complementary datasets released in March 2026: (1) U.S. Census Bureau Vintage 2025 population estimates, which measure headcount migration through July 2025; and (2) IRS Statistics of Income (SOI) Migration Data for Filing Year 2022–2023, which captures AGI flows, household counts, and migrant age profiles. Together they provide both the current population trajectory and the income quality of the migration.
The Wave Has Broken
Population growth is among the most consequential first-order economic variables in any analytical framework. It shapes labor supply, household formation, and long-run consumer demand. The latest Census Bureau data (the Vintage 2025 estimates released in March 2026) make three things clear: the post-pandemic surge in metropolitan area growth is over, the deceleration is broad-based, and the geography of American expansion is narrowing. The IRS’s newly released migration data for 2022–23 reveal a crucial second dimension: the people who are moving are not a random cross-section of the population. They are disproportionately working-age and above-median income — and where they go, economic capacity follows.
Metro areas as a whole grew 0.6% between July 2024 and July 2025, exactly half the 1.1% rate recorded in the prior year. In absolute terms, U.S. metros added roughly 1.7 million residents, down from nearly 3.2 million the year before. That comparison captures the scale of the deceleration. Growth did not just slow; it was cut in half.
| 0.6%
Metro area population growth rate, 2024–25 — half the prior year’s 1.1% pace |
1.7M
Net new metro residents added in 2024–25, down from 3.2M the prior year |
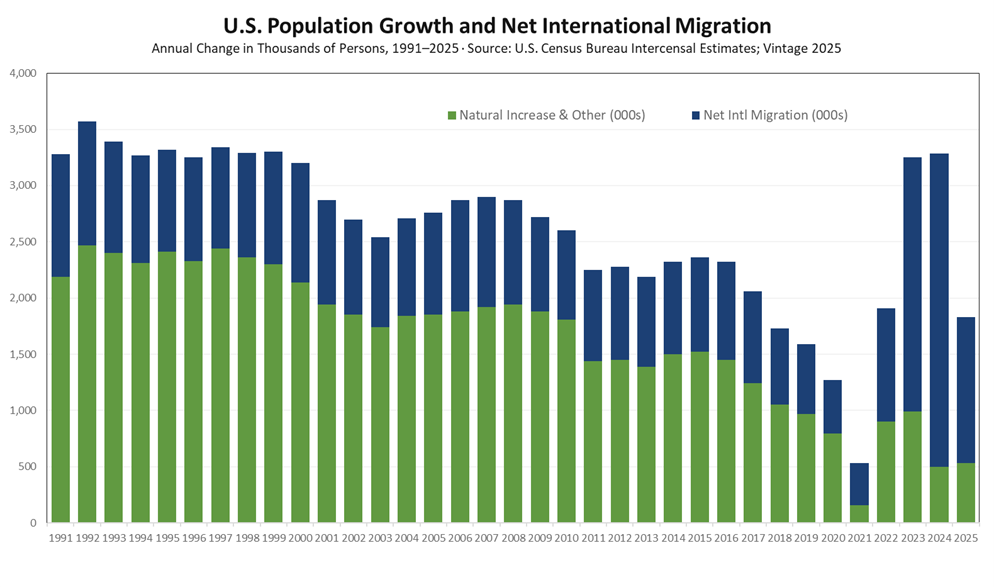
The proximate cause is well-documented: net international migration (NIM) collapsed. Nine out of ten U.S. counties recorded lower NIM in 2024–25 than in 2023–24; the remaining tenth saw essentially no increase. The Biden administration began tightening border security in the second half of 2024, and enforcement tightened considerably further under President Trump. Border metros felt it first and most acutely, but the effect has radiated outward to nearly every major immigration hub in the country.
What makes this cycle particularly instructive is the contrast with 2023–24. That year, post-pandemic normalization of global mobility produced an unusually large immigration surge — approximately 2.7 million net international migrants flowing into metro areas alone. That surge temporarily reversed population losses in several major gateway metros that had been bleeding residents for years. New York, Los Angeles, Chicago, San Francisco, Washington, Miami: all posted gains. For many, that story read like a comeback. It was not. The reprieve was a temporary bridge, and that bridge has now been removed.
What lies beneath that bridge is the structural reality many large gateway cities had been deferring: persistent domestic outmigration that immigration was masking but not curing.
Three Forces, One Direction
Population change in any MSA is the arithmetic sum of three components: net international migration, net domestic migration, and natural increase (births minus deaths). Understanding 2024–25 requires understanding what each is doing — and why the balance has shifted so decisively.
International Migration: The Dominant Variable, Now Contracting
NIM has been the swing factor in U.S. metro growth since the pandemic ended. Its rise from 2022 to 2024 inflated national growth rates and masked divergences between metros that were organically healthy and those merely benefiting from their geography as immigrant entry points.
The contraction now underway is structural, not cyclical. Tighter border enforcement has reduced new arrivals. Elevated deportation activity and the chilling effect on would-be migrants compound this. The Census Bureau’s own demographers flagged border metros as the clearest leading indicator: Laredo’s growth rate fell from 3.2% to 0.2% in a single year. Yuma dropped from 3.3% to 1.4%. El Centro went negative at -0.7%. These are not rounding errors — they are collapses.
| Border Metro Collapse: A Leading Indicator
The three sharpest single-year growth-rate declines among all U.S. MSAs are in border communities: Laredo (−3.0 ppts), Yuma (−1.9 ppts), and El Centro (−1.9 ppts, now shrinking). These markets lead the national trend by 6–12 months. What is happening at the border today will be visible in gateway metro data by mid-2026. |
Gateway metros saw the same dynamic play out at larger scale. Miami-Dade — the second-largest county gainer in the entire country in 2023–24 — lost more than 10,000 residents in 2024–25. Many residents are simply moving to other parts of South Florida, however, particularly Broward and Palm Beach counties. Los Angeles County continued its decade-long decline. New York City, which had briefly re-entered growth mode on immigration inflows, resumed contraction. The data reflect only the early phase of tighter enforcement; the full effect will take 12 to 24 months to fully manifest.
One facet of immigration often overlooked — and that is essential for correctly reading the domestic migration data in the next section — is that a person is counted as an immigrant when they first relocate to the country. When they subsequently move from their initial landing spot (typically one of the nation’s largest gateway cities) they appear in the data as a domestic out-migrant from that area. This secondary dispersal is one reason most large gateway metros have recorded persistent domestic outflows even during periods of strong overall immigration. It also means the domestic outmigration figures for cities like New York and Los Angeles understate the degree to which those metros’ populations have become dependent on continuous fresh immigration just to hold their footing.
Domestic Migration: Where the Real Votes Are Cast — and the Money Follows
Net domestic migration is one of the most revealing signals in demographic data. It reflects active, discretionary decisions by households, people choosing to leave one place and move to another. It responds to wages, housing costs, tax burdens, labor market conditions, and quality of life. And as the newly released IRS data make clear, what is migrating is not just population — it is purchasing power, tax base, and entrepreneurial capital.
The Census Bureau counts tell part of the story: the country’s fifty most populous counties collectively lost 637,634 residents to domestic outmigration in 2024–25. But the IRS data for 2022–23 tell us what those people earned. California lost $11.9 billion in net adjusted gross income (AGI) to outmigration — the largest income loss of any state. New York lost $9.9 billion. Illinois shed $6.0 billion. Massachusetts lost $4.0 billion. New Jersey, $2.6 billion. These are not budget rounding errors; they are structural fiscal wounds that compound annually.
| -$11.9B
California net AGI lost to outmigration, 2022–23 |
-$9.9B
New York net AGI lost to outmigration, 2022–23 |
| -$6.0B
Illinois net AGI lost to outmigration, 2022–23 |
-$4.0B
Massachusetts net AGI lost to outmigration, 2022–23 |
On the receiving end of these flows, the picture is equally clear. Florida gained $20.6 billion in net AGI — the largest income gain of any state. Texas gained $5.5 billion. North Carolina gained $3.9 billion, and neighboring South Carolina added $4.1 billion. Tennessee captured $2.8 billion. Arizona gained $2.8 billion. The directional pattern is consistent, persistent, and policy-linked: states with lower tax burdens, more competitive regulatory environments, and a more cooperative relationship between business, government, and labor are capturing income, investment capital, and the entrepreneurial activity that accompanies high-earning households.
| +$20.6B
Florida net AGI gained from in-migration, 2022–23 |
+$5.5B
Texas net AGI gained from in-migration, 2022–23 |
| +$4.1B
South Carolina net AGI gained, 2022–23 |
+$3.9B
North Carolina net AGI gained, 2022–23 |
Massachusetts offers a particularly instructive case study in policy-driven migration. In 2022, the state enacted a 4% tax surcharge on income exceeding $1 million, raising its top marginal rate to 9%. In the subsequent filing year, taxpayers earning more than $200,000 accounted for 70% of the state’s net outflows — roughly double their share in 2019. New Hampshire, the state’s zero-income-tax neighbor, captured nearly $900 million of that income directly from former Massachusetts filers. Washington state offers a comparable cautionary tale: after enacting a 7% capital gains tax in 2021, the state shifted from being one of the country’s largest income gainers to recording a net outflow of approximately $500 million in 2022–23.
| The High-Earner Flight Premium
Among taxpayers with $200,000 or more in AGI, the most attractive destination states in 2021–22 were Florida, Texas, North Carolina, South Carolina, and Arizona. The least attractive: California, New York, Illinois, Massachusetts, and New Jersey. Florida alone gained 29,771 affluent filers in a single year — adding $28.7 billion to its AGI base. California lost 24,670 of them, removing $16.1 billion. The migration of high earners is not incidental to the reallocation; it is the dominant driver of it. |
Charlotte led all 387 metro areas in net domestic in-migration in the Census data. The IRS data provide the income context behind that ranking. North Carolina ranked third nationally in net IRS migration with 79,317 individuals on 40,999 returns in 2022–23, trailing only Florida and Texas. Critically, 55.4% of those arriving in North Carolina were between the ages of 26 and 44 — prime working-age, household-formation years. These are not retirees or students; they are earners, spenders, and taxpayers arriving in concentrated form. This age and income profile makes North Carolina an unusually attractive destination for employers seeking skilled labor in a tight market, and for builders and retailers tracking where household formation demand will concentrate over the next decade.
Natural Increase: Stabilizing, Not Driving
Natural increase (the excess of births over deaths) contributed roughly 614,000 to metro population in 2024–25. That figure has improved from the pandemic low, when mortality spiked and fertility was suppressed. But approximately 65% of U.S. counties still experience natural decrease — more deaths than births — reflecting the ongoing aging of the baby boom cohort. Natural increase can pad the growth calculation; it is not the engine.
| Natural Increase: A Floor, Not an Engine
65% of U.S. counties record more deaths than births annually — a figure that has held steady for three consecutive years. Natural increase contributes roughly 614,000 metro residents per year nationally, cushioning the deceleration but unable to offset the loss of 2+ million in annual NIM. The math improves with younger in-migrant populations, which is precisely why the IRS age data matters: domestic migration destinations are receiving disproportionately young, working-age arrivals who will improve natural increase over time. |
Where Growth Is Actually Occurring – Absolute Leaders: Scale Compounds
In terms of raw numeric growth, the top MSAs reinforce a now-familiar hierarchy. Houston led all metro areas in 2024–25, followed by Dallas-Fort Worth, Atlanta, Phoenix, and Charlotte. Together, these five markets account for a disproportionate share of net new metro population, and Texas alone had four of the top nine fastest-growing metros by population.
Houston deserves particular mention. It is one of the few large metros where international migration remains robust even as the national trend weakens: a reflection of its longstanding role as a major immigrant destination tied to energy, medicine, and international trade. That combination of strong domestic inflows and continued immigration makes Houston’s growth profile more resilient than most peers at its scale.
Dallas-Fort Worth continues its trajectory as one of the great economic absorbers of the American economy, drawing corporate relocations, logistics investment, and a steady stream of working-age migrants from the coasts. Dallas has been the biggest winner from the out-migration of businesses from California, with more choosing to locate in the greater Dallas area than any other metro in the U.S.
The suburbs around Dallas are booming. Princeton, Texas, grew its population by nearly one-third in a single year. Forney, Texas (21 miles from downtown Dallas) has more than 25,000 future residential lots in the pipeline. The IRS data reinforce why: Texas gained $5.5 billion in net AGI in 2022–23, and among high-income filers nationally it ranked as the second-most-attractive destination in the country.
Percentage Leaders: Where Momentum Is Building
Percentage growth leaders tend to be smaller markets where a modest population base amplifies migration impact. Ocala, Florida and Myrtle Beach-Conway, South Carolina led all metros in growth rate — both driven overwhelmingly by domestic in-migration. Spartanburg, Lakeland, Punta Gorda, and Huntsville round out the fastest-growing tier. Retirees account for much of the growth in Ocala, Myrtle Beach, Lakeland, and Punta Gorda; in Spartanburg and Huntsville, however, industrial development is the primary driver: a distinction with meaningfully different long-run economic implications.
All these markets share several traits: proximity to larger metros, housing availability, lower costs of living, and in some cases proximity to military or industrial employment anchors. They represent the overflow valve from the larger Sun Belt hubs as prices rise and supply tightens in primary markets. The IRS data confirm that secondary Sun Belt markets are not just receiving people — they are receiving migrants with the same income profile as those heading to larger neighbors, but at a lower cost basis. The investor implication is less the growth rate itself and more what it signals about the diffusion of demand across regional secondary markets.
A note on Florida: hurricanes Helene and Milton complicated the state’s demographic picture in 2024–25. Pinellas County lost nearly 12,000 residents — the second-largest numeric decline in the country — as storm displacement compounded an already difficult demographic structure (deaths exceed births in Pinellas by the widest margin of any U.S. county). The Miami metro posted a 0.1% population decline. Twenty of Florida’s twenty-two metros still grew, but the hurricane effect is a reminder that the state’s story is more layered than it appears. Rising insurance costs are causing some potential migrants to re-evaluate Florida alternatives in neighboring states, most directly South Carolina and Georgia. Notably, Florida’s $20.6 billion net AGI gain in the IRS data predates these storms — the state’s income attraction fundamentals remain intact, but the geographic distribution of that attraction is shifting.
| Florida: Two Stories in One State
Hurricane displacement subtracted an estimated 15,000–20,000 residents from Southwest Florida in 2024–25 — a disruption that is partly temporary, but whose insurance cost aftermath is structural. Investors should disaggregate storm-affected coastal counties (Pinellas, Charlotte, Sarasota, Lee) from inland and Northeast Florida, which continued growing normally. Miami-Dade’s decline is immigration-driven, not weather-related: a distinction with materially different long-term implications. |
The Piedmont Corridor: Charlotte, Raleigh, and a Rising Third Node
No region better illustrates the intersection of scale and momentum than the Piedmont Crescent — the arc connecting Charlotte and Raleigh-Durham across central North Carolina. Both metros are performing at the top of national rankings on multiple dimensions simultaneously, and a third node is emerging between them. Critically, this outperformance is confirmed by two independent data sources: the Census Bureau’s population counts and the IRS’s income-flow data point in exactly the same direction.
Charlotte: The Migration Leader — in Headcount and Income
Charlotte’s leadership in net domestic migration is not a surprise to anyone who has watched the region’s corporate development pipeline, but the breadth of inflows is worth emphasizing. Households are arriving from the Northeast, neighboring states, the Midwest, and the West Coast. The IRS data confirm that North Carolina’s in-migrants skew young and working-age: 55.4% of individuals moving to NC in 2022–23 were between 26 and 44 years old, compared to just under 50% for Florida and South Carolina. This age profile matters for long-run demand — it implies accelerating household formation, rising school enrollment, and a tax base that will compound for decades.
| Charlotte: The Convergence of Headcount and Income
Census data: #1 MSA nationally in net domestic migration, 2024–25. Lancaster County, SC: 2.7% growth rate — fastest of all 11 MSA counties. IRS data: NC ranked #3 nationally in net AGI gained ($3.9B); SC gained $4.1B — Carolinas combined $8.0B, trailing only FL and TX. Age profile: 55.4% of NC in-migrants aged 26–44 — highest working-age share among top destination states. Employment: Charlotte nonfarm payrolls +2.7% YoY through Nov 2025, adding ~37,800 net new jobs — outpacing Atlanta, Dallas-Fort Worth, and Miami. |
North Carolina as a whole ranked third nationally in IRS net migration with 79,317 individuals on 40,999 returns — and $3.9 billion in net AGI gained. Charlotte accounts for a disproportionate share of that figure. The region’s income attraction is not incidental; it is a function of its employment base. Charlotte remains the second-largest U.S. banking center, with Bank of America, Truist Financial, and several major domestic and foreign-bank regional operations anchoring a financial ecosystem that is expanding, not contracting.
Recent corporate commitments reinforce this trajectory. Capital Group’s planned East Coast hub will create approximately 600 jobs. Scout Motors selected Charlotte for its new corporate headquarters, expected to generate roughly 1,200 positions. These additions build on a formidable established base: Charlotte is home to seven Fortune 500 companies (Bank of America, Lowe’s, Honeywell, Nucor, Duke Energy, Truist, and Sonic Automotive) and nineteen Fortune 1000 companies in total, including Ingersoll-Rand, Coca-Cola Consolidated, and Sealed Air, spanning financial services, energy, industrial manufacturing, specialty chemicals, and logistics. Few cities of Charlotte’s size can match the depth or diversification of that corporate roster. The Charlotte Douglas International Airport, which consistently ranks as one of the nation’s busiest by passenger traffic, is a major draw, as is the availability of skilled workers that continue to relocate to the area.
Charlotte also possesses a structural geographic advantage that peers lack. The final leg of Charlotte’s beltway, I-485, did not open until 2015, effectively unlocking vast tracts of land for development just as the national migration toward the Sun Belt accelerated. Unlike most metros that grow primarily in one direction, Charlotte expands in all four — and uniquely among major U.S. metros, it straddles a state line. The Charlotte-Concord-Gastonia MSA spans eleven counties across both North Carolina and South Carolina, and in 2024–25 it was the South Carolina counties that posted the fastest percentage gains within the metro.
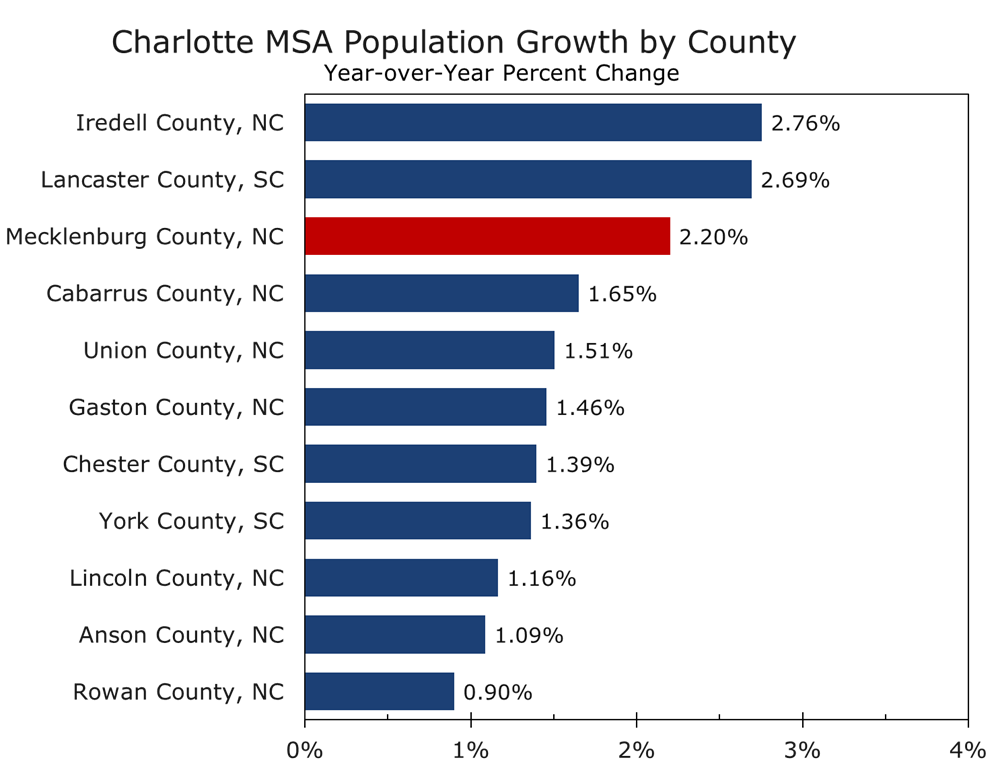
Lancaster County, SC — anchored by the rapidly growing unincorporated community of Indian Land and a constellation of active adult and retirement communities — grew 2.7% in 2024–25, adding nearly 3,000 residents and recording the second fastest growth rate of any of the MSA’s eleven counties. York County, SC, home to Rock Hill and Fort Mill, has added approximately 25,000 residents since the 2020 Census. The pattern is consistent with what is seen across the Sun Belt: as core counties fill in and prices rise, growth cascades outward into adjacent counties with more land, lower costs, and direct access to the core employment base. Charlotte’s bi-state geography gives it an unusually wide spillover zone — and South Carolina’s competitive tax environment accelerates it.
The IRS data confirm this dynamic at the state level: South Carolina gained $4.1 billion in net AGI from in-migration in 2022–23, actually exceeding North Carolina’s $3.9 billion gain despite having a smaller population base. The Carolinas together captured $8.0 billion in net income from domestic migration in a single filing year — a combined figure that places this bi-state corridor among the most powerful wealth-attraction zones in the country, trailing only Florida and Texas. Markets that can build can sustain growth. The Charlotte metro, sprawling across two growth-oriented states, is building on both sides of the border.
Raleigh-Durham: The Innovation Anchor
A note on Census geography is warranted before discussing this region’s population dynamics. The Census Bureau defines the Raleigh-Durham area as two separate Metropolitan Statistical Areas: the Raleigh-Cary MSA (Wake and Johnston counties) and the Durham-Chapel Hill MSA (Durham, Orange, and Chatham counties). These are treated as distinct geographies in population tallies, which creates an analytical gap that can mislead: the two metros are highly economically integrated and are far better understood together. Research Triangle Park (the 7,000-acre research campus that is the region’s dominant employment hub) sits mostly in Durham County but extends into Wake County, physically straddling both MSAs. No serious economic analysis of the region treats the MSA boundary as a meaningful divide.
The more analytically useful geography is the Raleigh-Durham-Cary Combined Statistical Area (CSA) — a Census-defined framework that groups two or more adjacent MSAs with demonstrated economic and social linkages, as measured by commuting flows and employment ties. Where an MSA captures a single core urban area and its immediate labor shed, a CSA captures how multiple cores function as a single integrated regional economy. The Raleigh-Durham-Cary CSA encompasses Wake, Johnston, Durham, Orange, and Chatham counties, stretching roughly 60 miles from the northern edge of the Research Triangle to the southeastern suburbs of Johnston County, a crescent of rapidly growing communities connected by I-40, U.S. 1, and the regional rail corridor. The region is known colloquially as the Triangle, a name that references its three anchor universities: Duke University in Durham, the University of North Carolina at Chapel Hill, and North Carolina State University in Raleigh.
On a combined basis, the Raleigh-Durham-Cary CSA totaled approximately 2.48 million residents as of the most recent estimates — making it the 30th largest CSA in the country and the fifth largest in the Southeast behind Atlanta (7.43M), South Florida (7.26M), Central Florida (4.74M), and Charlotte (3.53M). Looking at the component MSAs: the Raleigh-Cary MSA reached nearly 1.60 million people by mid-2025, having grown 12.9% since the 2020 Census — roughly four times the national average over that span and one of the strongest five-year growth rates of any large metro in the country. The Durham-Chapel Hill MSA reached just over 625,000, growing 6.2% over the same period. The combined five-year addition of roughly 220,000 residents places the Triangle among the most consequential growth stories in modern American demography.
On net migration, both components of the CSA performed strongly relative to national peers. Raleigh-Cary added over 39,000 residents in 2023–24, growing at 2.6% — among the highest rates of any metro with more than one million residents. Both Raleigh and Durham ranked in the top 25 fastest-growing places nationally for 2023–24 in U.S. News analysis using Census net migration data. Durham-Chapel Hill’s educational attainment profile has also sharpened dramatically as migration has accelerated: the share of adults with a bachelor’s degree or higher rose eight percentage points to 53.4% between the 2015–2019 and 2020–2024 ACS estimates, the highest rate of improvement among major North Carolina metros. This is a signal of the quality, not just the quantity, of the in-migration flow.
The economic character of the Triangle is distinct from Charlotte’s financial and industrial identity and distinct from the Triad’s manufacturing transformation. It is an innovation economy in the strictest sense — one where proximity to Duke, UNC, and NC State generates a continuous pipeline of research commercialization, startup formation, and specialized talent that compounds over time. Life sciences anchor the employment base: GlaxoSmithKline, Biogen, Pfizer, and Novo Nordisk all maintain significant Research Triangle Park operations, and the region has become one of the top five U.S. destinations for biopharma capital deployment. Recent major commitments in semiconductor-adjacent manufacturing deepen a clustering dynamic that is self-reinforcing: talent and capital attract further talent and capital.
Supply has kept pace with demand across the Piedmont Corridor in a way that most high-growth markets cannot claim. North Carolina ranked third nationally in housing unit growth in 2023–24 at 1.9%, trailing only Idaho and Utah. Charlotte and Raleigh are both expanding in multiple directions from their urban cores. The primary risks to the broader Piedmont region’s outlook are federal funding exposure, particularly for the Triangle’s research institutions, and the broader deceleration in immigration that reduces the overall labor pool available to employers. Both are real. Neither, in our view, alters the region’s structural position.
The Piedmont Triad: An Ascending Third Node
Lying between Charlotte and Raleigh-Durham, the Piedmont Triad — the Greensboro–Winston-Salem–High Point–Burlington Combined Statistical Area — is a region whose manufacturing legacy in textiles, furniture, and tobacco is being rapidly displaced by a new industrial identity centered on aerospace and advanced manufacturing. The Triad’s higher education sector is a meaningful contributor to this evolution: Wake Forest University, ranked 51st nationally by U.S. News, anchors a research and medical ecosystem in Winston-Salem that includes the Wake Forest School of Medicine (ranked 48th in research programs) and the Wake Forest Institute for Regenerative Medicine, an international leader in tissue engineering and bioprinting. High Point University and Elon University have both expanded substantially in enrollment and programmatic breadth over the past decade, adding to a talent pipeline that also draws from UNC Greensboro and North Carolina A&T State University, the nation’s largest HBCU. In total, more than 30 post-secondary institutions serve the Triad region, enrolling over 60,000 students.
The investment pipeline at Piedmont Triad International Airport (PTI) is among the most consequential in the American Southeast. Boom Supersonic completed its $500 million Overture Superfactory at PTI in June 2024, establishing the world’s first dedicated supersonic commercial aircraft manufacturing facility. Honda Aircraft Company remains headquartered at the airport, producing its HondaJet line. In June 2025, aerospace startup JetZero announced a $4.7 billion investment for a commercial all-wing aircraft production facility at PTI — the largest economic development commitment in North Carolina history by job count, with a pledge of more than 14,000 positions. Marshall Aerospace USA has also committed to the campus. In total, PTI-area companies have pledged more than 20,000 jobs and $5.3 billion in capital investment, with potential for further clustering as the campus fills.
| Piedmont Triad Aerospace Cluster: Scale of Commitment
$5.3B in capital pledged at PTI · 20,000+ jobs committed · JetZero $4.7B = largest NC economic development commitment by job count ever · Toyota EV battery plant (Liberty, NC): ~$14B investment, initial production underway 2025 · Siemens Energy: $421M expansion in Winston-Salem (gas turbine parts) and Charlotte (power transformers) · Nucor Steel Lexington: $350M plant in Davidson County, 180 jobs averaging ~$100K · Siemens Mobility: $220M rail manufacturing hub in Lexington, 500 jobs · approximately 200 aerospace companies now operating across the Triad |
Complementing the aerospace cluster, Toyota Battery Manufacturing North Carolina, located in Liberty just east of the Triad, is ramping its nearly $14 billion electric-vehicle battery plant, with initial production underway in 2025 and a commitment of more than 5,100 jobs at full build-out. The broader regional capital commitment now spans aerospace, rail, advanced steel, energy infrastructure, and EV batteries: a diversification that insulates the Triad from any single sector’s cycle.
The Triad’s competitive advantages — lower housing costs than Charlotte or Raleigh, proximity to both markets, a deep technical education ecosystem, and a deep manufacturing culture — position it as a credible long-term beneficiary of the regional capital wave. It is no longer riding the coattails of its larger neighbors; it is building its own industrial identity. Population growth has lagged its larger neighbors but is accelerating. Burlington, the Triad’s fastest-growing node, expanded at a 1.5% rate in 2024–25, led by domestic in-migration, and the broader CSA posted its strongest five-year growth since the early 2010s. As with the Triangle, the best way to view the Piedmont Triad’s economy is by looking at the Combined Statistical Area, which includes Greensboro-High Point-Winston-Salem-Burlington. The 10-county region boasts a 2025 population of 1.78 million and has added 81,281 residents since the 2020 Census.
The Gateway Metro Problem
The large coastal gateway metros (New York, Los Angeles, San Francisco, Chicago, Miami, Washington) occupy a structurally different position. For most of the 2010s, they were losing population through domestic outmigration. The post-pandemic immigration surge interrupted that trend and produced what looked like a recovery.
That recovery was real but temporary. As immigration decelerates, the underlying domestic outmigration dynamic is reasserting itself. Los Angeles has been losing residents every year for a decade; no immigration volume was ever going to fix the structural cost and governance problems driving those outflows. New York briefly led the country in numeric gains in 2023–24, adding over 213,000 residents — then fell to thirteenth place the following year as immigration dried up.
The IRS income data reframes this problem in fiscal terms. New York lost $9.9 billion in net AGI to outmigration in 2022–23. California lost $11.9 billion. Illinois shed $6.0 billion. These are not merely population trends; they are annual revenue-base erosions with compounding consequences. Each year’s outflow reduces the income tax base, raises per-capita fixed costs, and creates pressure for higher rates — which accelerate the next year’s outflow. The gateway metro fiscal problem is self-reinforcing in a way that headcount data alone do not fully capture.
| The Gateway Fiscal Feedback Loop
Stagnant or declining population creates a compounding fiscal problem: fewer taxpayers, maintained pension obligations, slower property tax base growth, and pressure to raise rates — which accelerates further outmigration. New York, Chicago, and Los Angeles are at varying stages of this cycle. The IRS data put the scale in plain terms: New York and California together lost over $21 billion in annual AGI to outmigration in a single filing year. That is not a gap that retaining a few corporate headquarters can close. |
The gateway metros most exposed are those with the weakest domestic migration trends and the highest immigration dependency. Los Angeles and Miami-Dade fit that profile squarely. New York is a close third. San Francisco has shown some domestic migration resilience in the most recent period, possibly reflecting the growth spurt tied to AI. Housing constraints remain severe in the Bay Area, however, and the region’s recovery is not yet durable.
What Comes Next
The data we are analyzing reflect, at most, the first several months of the current immigration enforcement regime. Deportation volumes, legal immigration processing slowdowns, and a broader chilling effect on migration intent will take 12 to 24 months to fully manifest in population estimates. The direction of travel is not ambiguous — NIM will continue to weaken in 2025–26. The question is how steep and for how long.
The IRS data add an important forward dimension to the Census deceleration story. The wealth redistribution captured in the 2022–23 IRS data did not begin with the pandemic and will not end with the immigration pullback. It reflects a durable structural shift in where high-income households choose to live — driven by tax differentials, regulatory environments, housing affordability, and quality of life. The immigration reversal reduces total migration volume, but it does not alter the direction of the income flows captured by the IRS. If anything, it concentrates the domestic migration premium into fewer, stronger destination markets.
For investors, corporate site selectors, and municipal strategists, the most powerful analytical frame combines both datasets: use the Census Bureau numbers to assess current momentum, and the IRS income flows to assess the quality and durability of that momentum. Markets with strong domestic in-migration and high average AGI per arriving return are the most defensible positions. Charlotte, Raleigh, the broader Carolinas corridor, Dallas-Fort Worth, and Houston score well on both dimensions. The Piedmont Triad is ascending into that tier.
The wave of post-pandemic population growth has broken. What remains is a more selective, more structurally revealing distribution of American economic momentum — and with the IRS data now in hand, a clearer picture of where that momentum is carrying not just people, but wealth. The markets capturing both are not doing so by accident. They built it through business environment, infrastructure investment, and housing policy. The markets losing ground are discovering that deferring those choices has consequences that immigration can postpone but not eliminate — and that the IRS confirms, year after year, in the returns.
The geography of U.S. growth has not changed. The rules governing who participates in it have — and the IRS data now tell us how much it costs to be on the wrong side of that divide.
Important Disclosures & Data Notes: This publication has been prepared for informational purposes only and is not intended as a recommendation, offer, or solicitation to purchase or sell any security or other financial instrument, nor does it constitute investment advice.
This report draws on two primary data sources: (1) U.S. Census Bureau Vintage 2025 population estimates (released March 2026), covering July 2024 to July 2025; and (2) IRS Statistics of Income (SOI) Migration Data for Filing Year 2022–2023 (released March 2026), reflecting tax year 2022 income reported on 2023 returns. IRS data cover approximately 70–80% of the U.S. population (tax filers only) and are subject to an 18–24 month lag relative to current Census estimates. Beginning with the 2022–2023 release, SOI enhanced its matching methodology, resulting in approximately 5% more returns than prior vintages. Adjusted Gross Income (AGI) figures represent net flows (inflows minus outflows) and are stated in nominal dollars.
Statements regarding future conditions reflect the views of our analysts and are subject to uncertainty and change. Past demographic trends are not indicative of future outcomes. Recipients should conduct their own independent analysis and due diligence before making any investment decisions.
March 30, 2026
Mark Vitner, Chief Economist
(704) 458-4000