Highlights of the Week
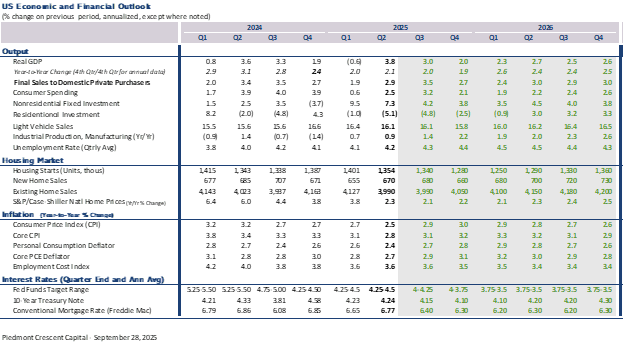
- GDP Revised Up: Q2 GDP rose at a 3.8% pace, with private final domestic demand up at a 2.9% pace, led by stronger consumer spending and business fixed investment.
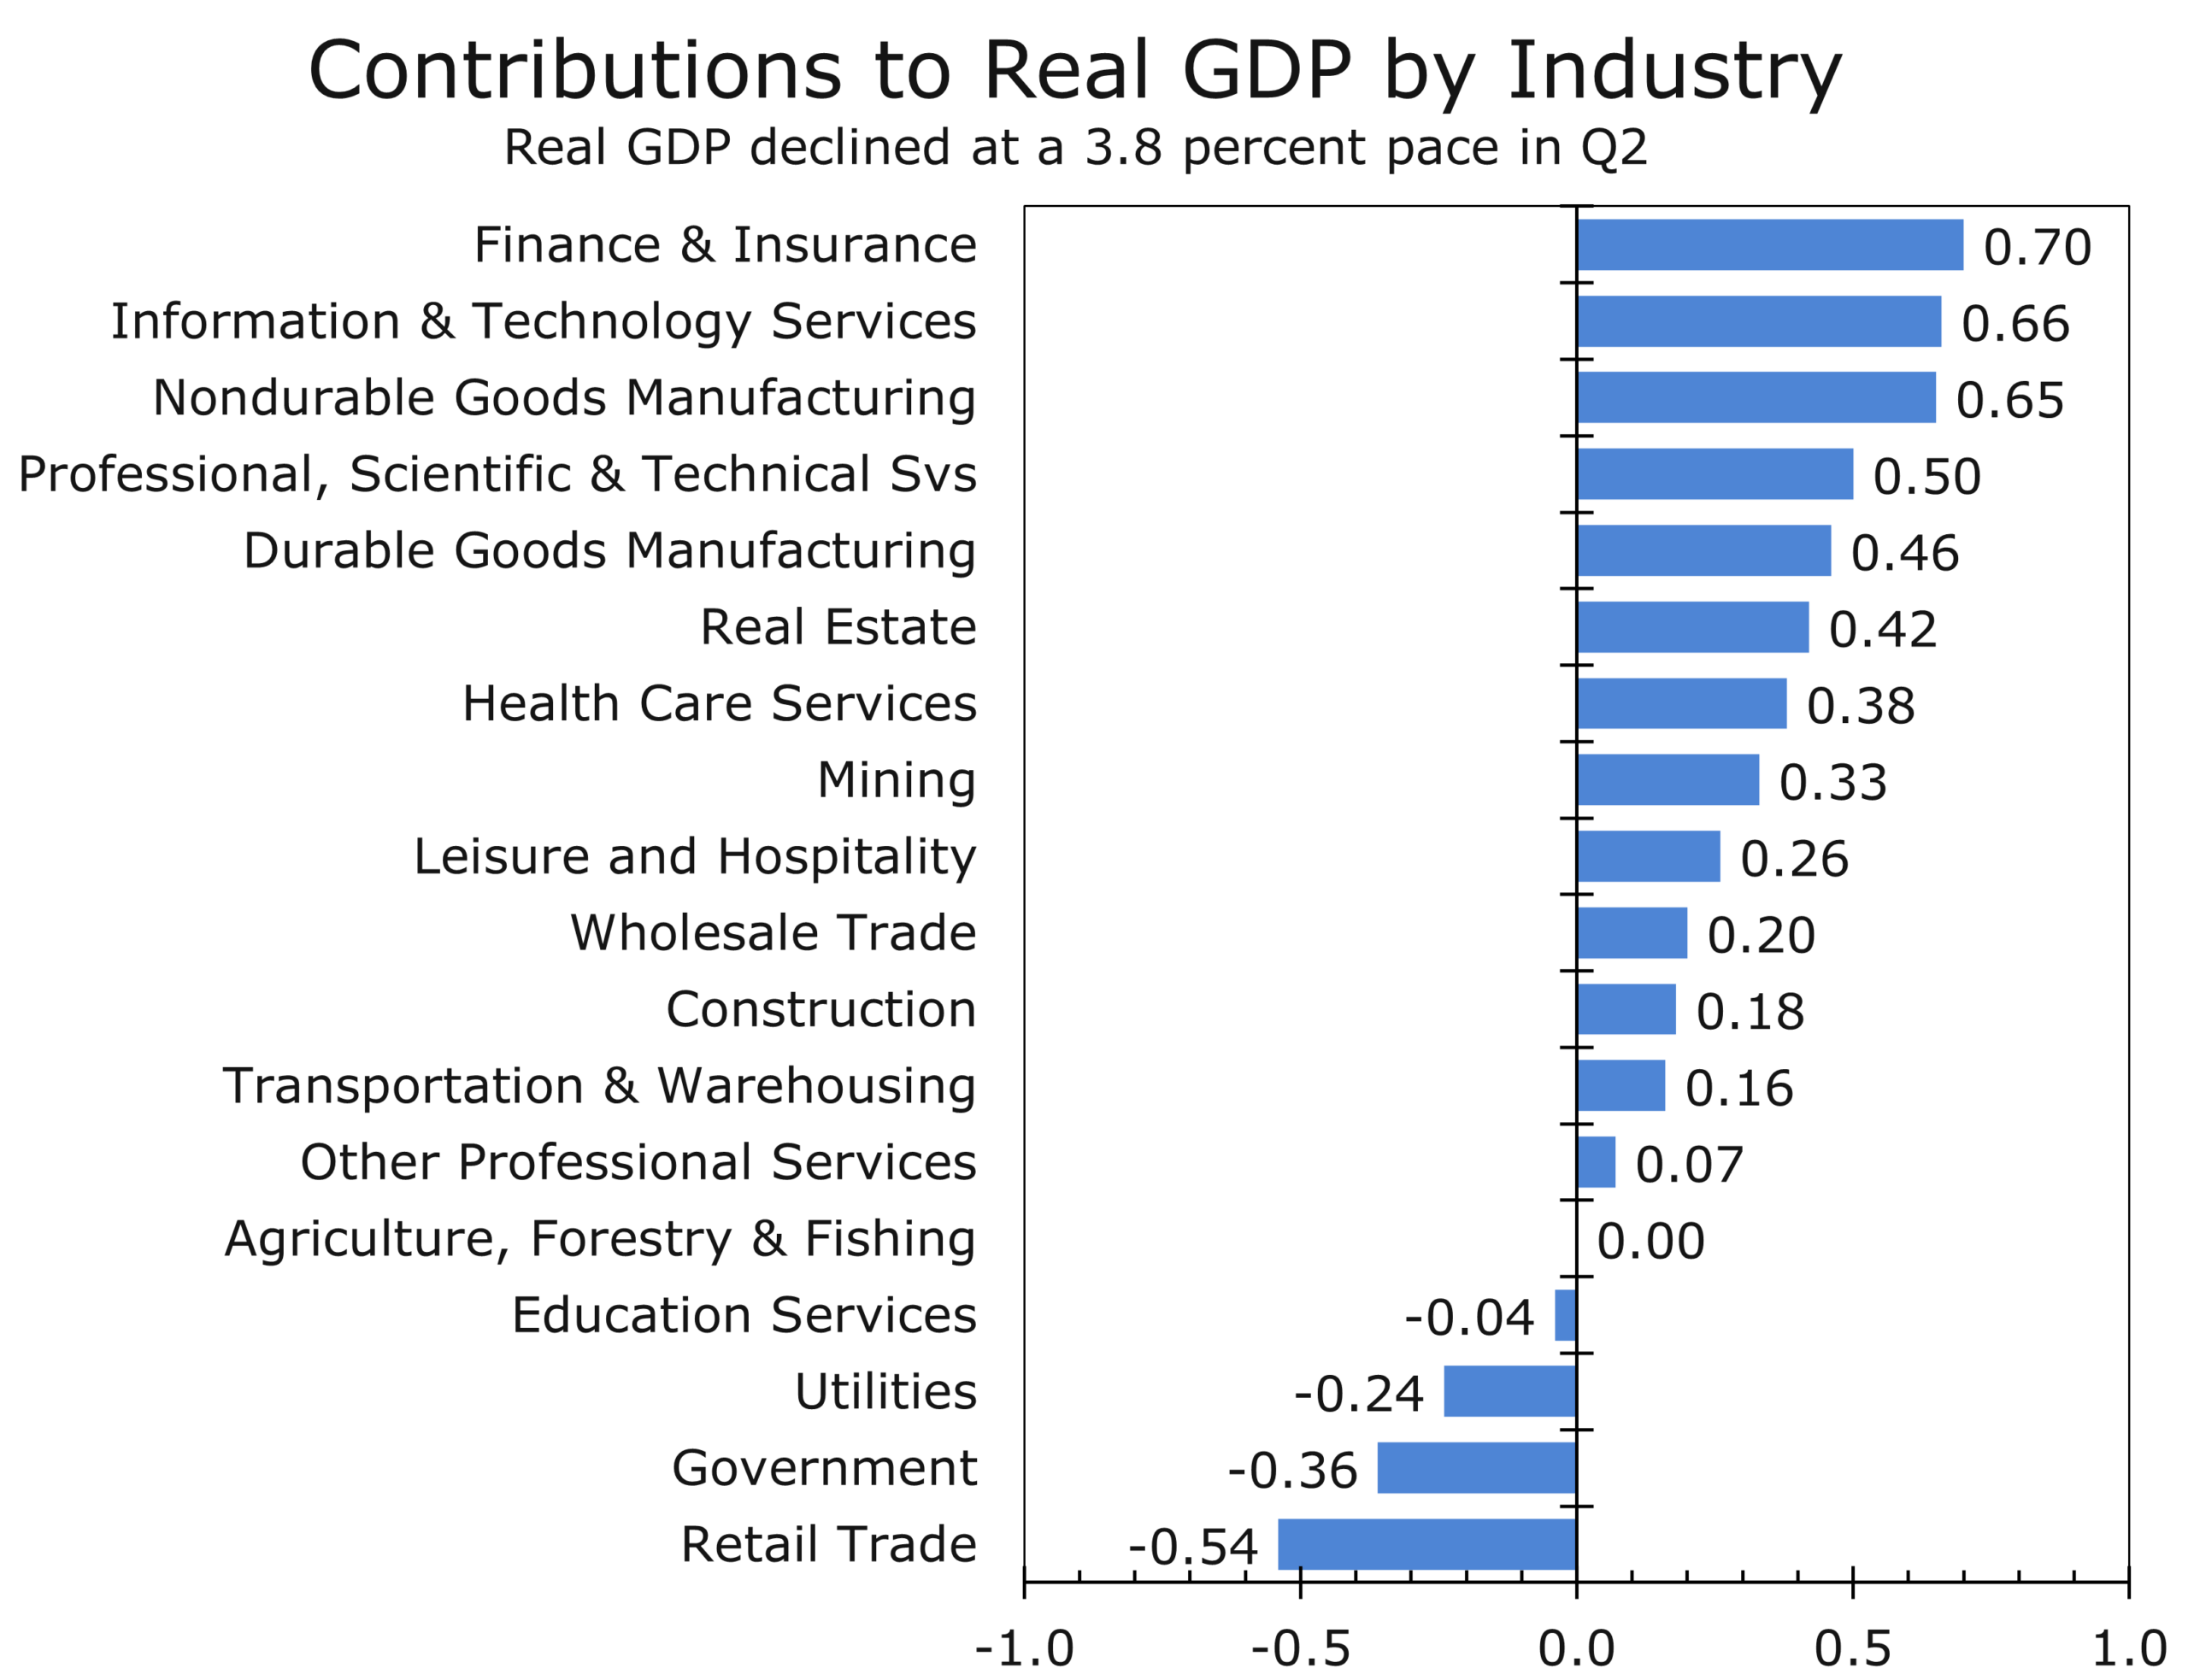
- Industry Drivers: GDP by Industry highlights strength in intellectual property, equipment, and financial services; housing remains a drag.
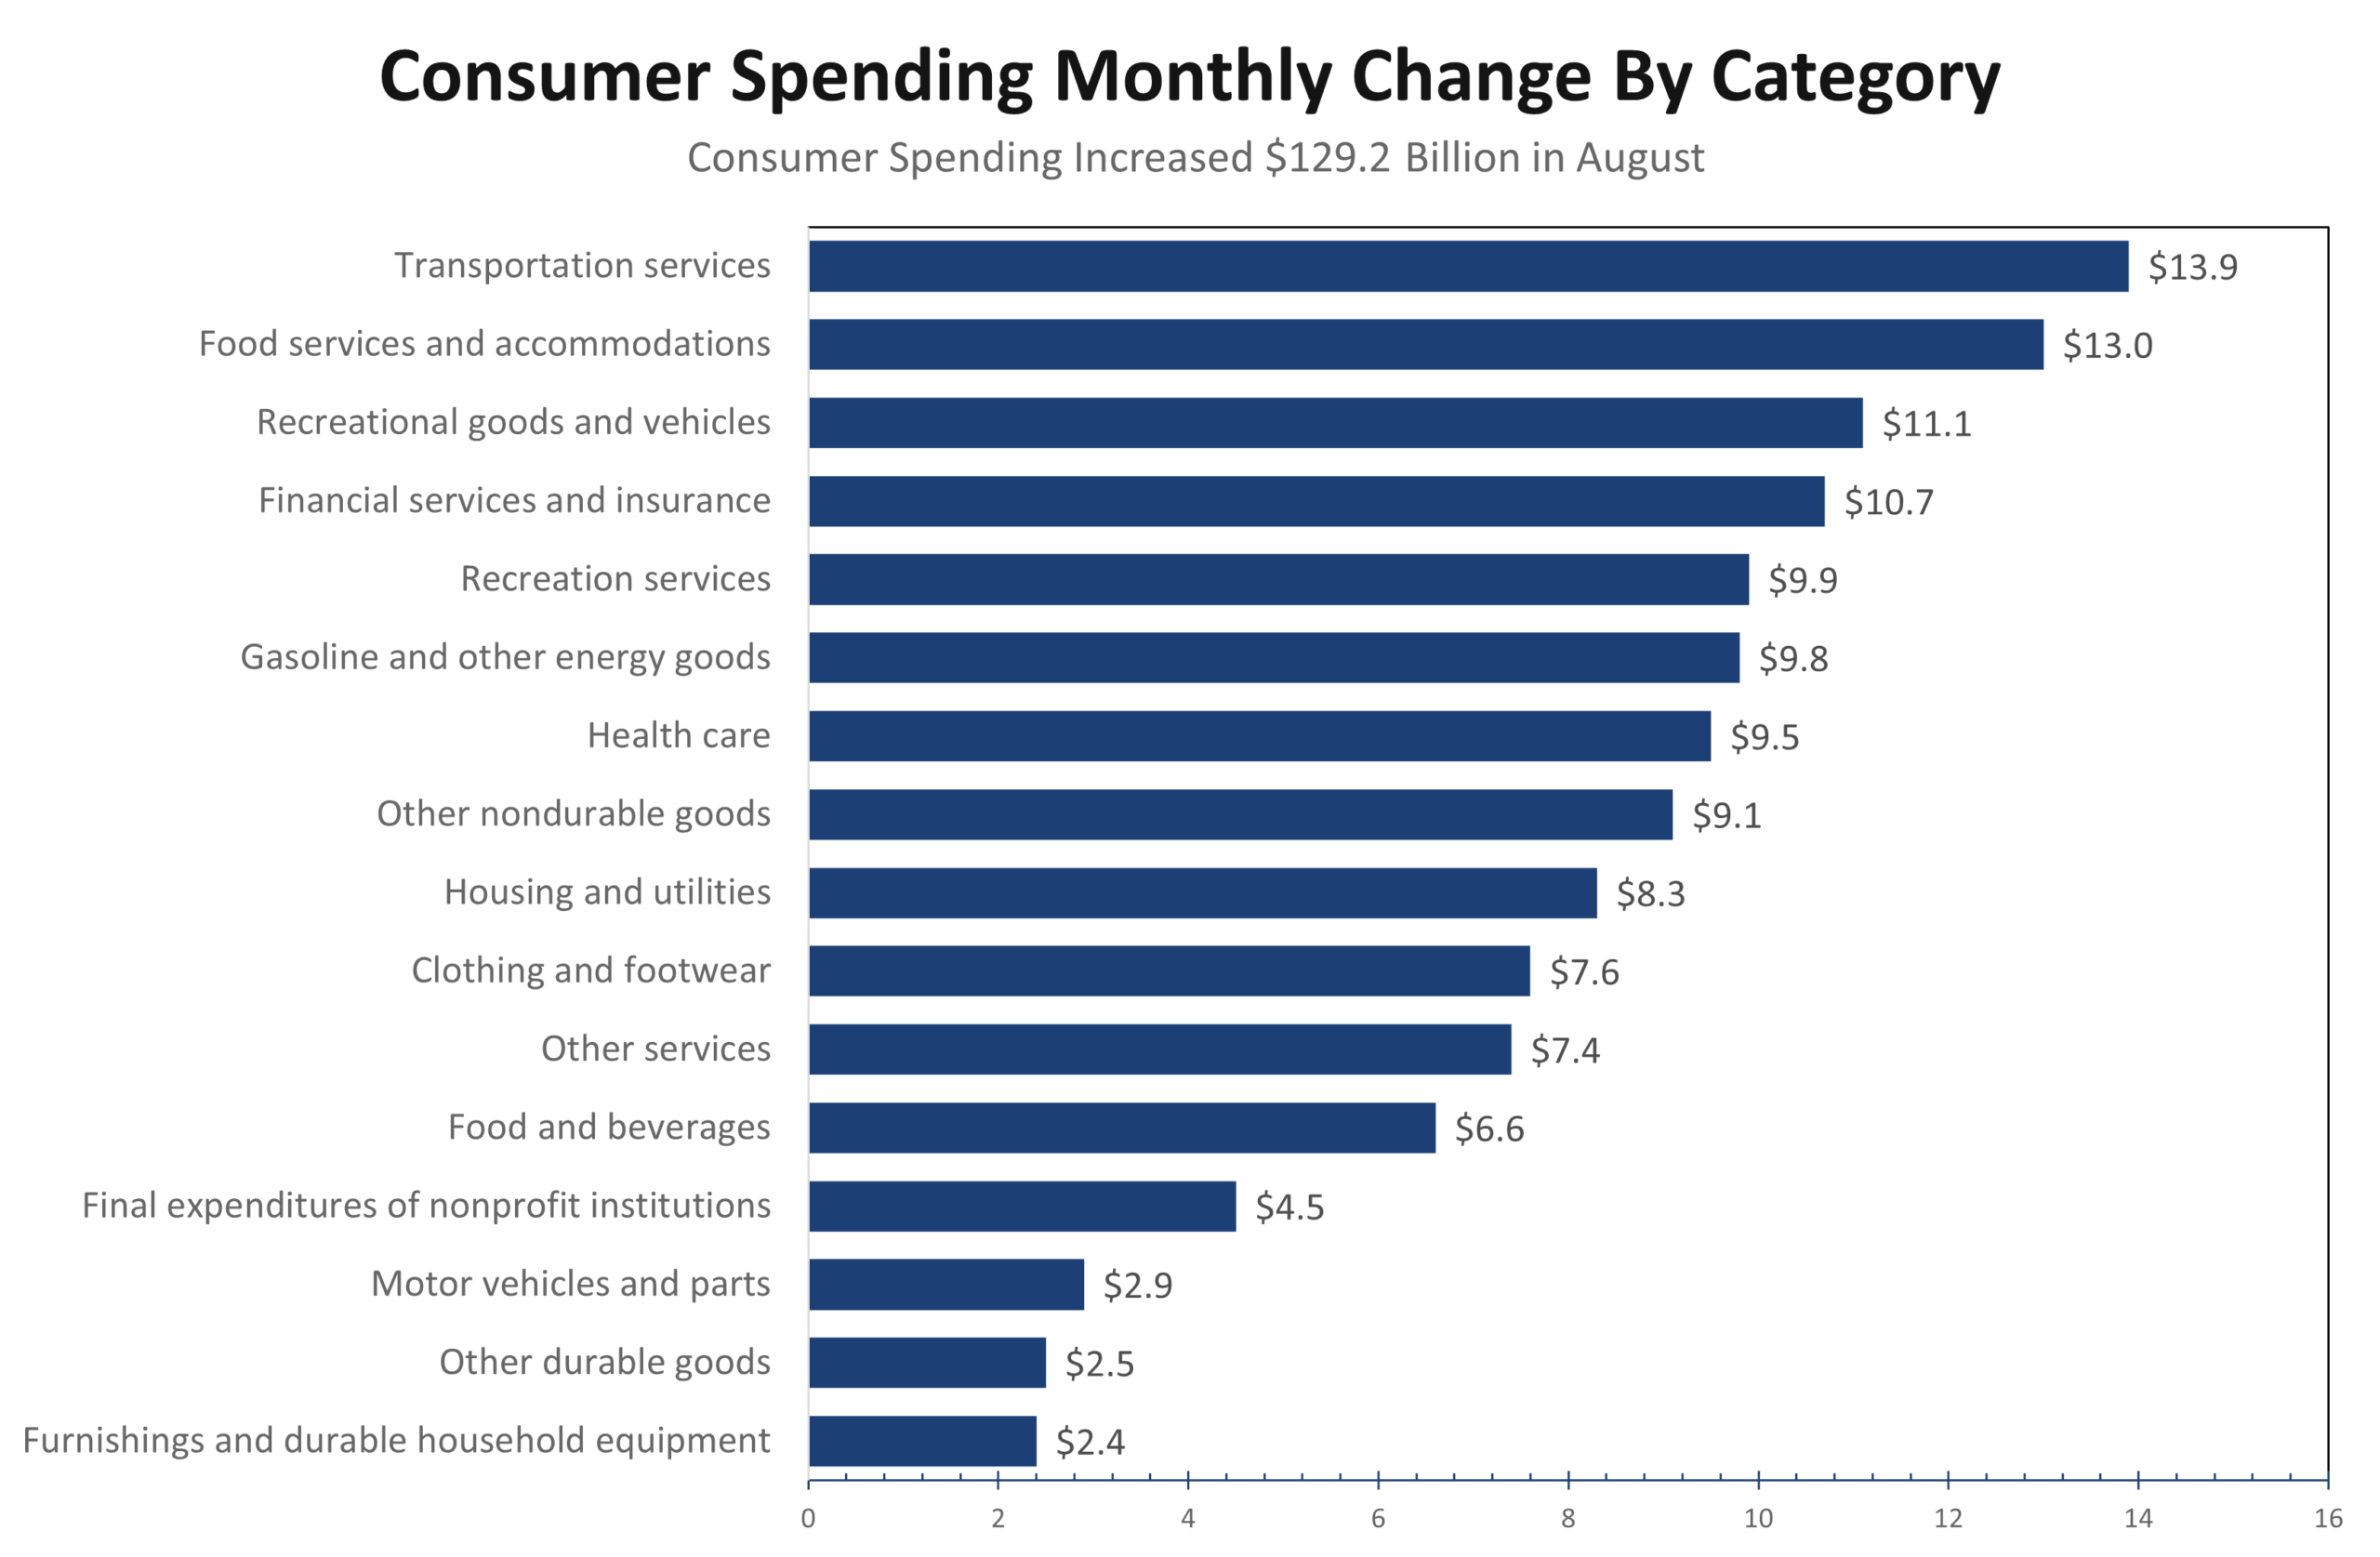
- Consumer Resilience: August PCE data show real spending up 0.4% m/m, tracking Q3 growth at 2.6–2.8%. Gains are increasingly concentrated among higher-income households.
- Labor Stabilizing: Jobless claims trending lower; payrolls (if released) might open the door for the Fed to skip October and waits until December to cut rates-which would extend the easing cycle.
- Housing Bifurcated: New-home sales surged but likely overstated strength; completed-home inventories remain elevated, while existing supply is shrinking on delistings as home prices ebb.
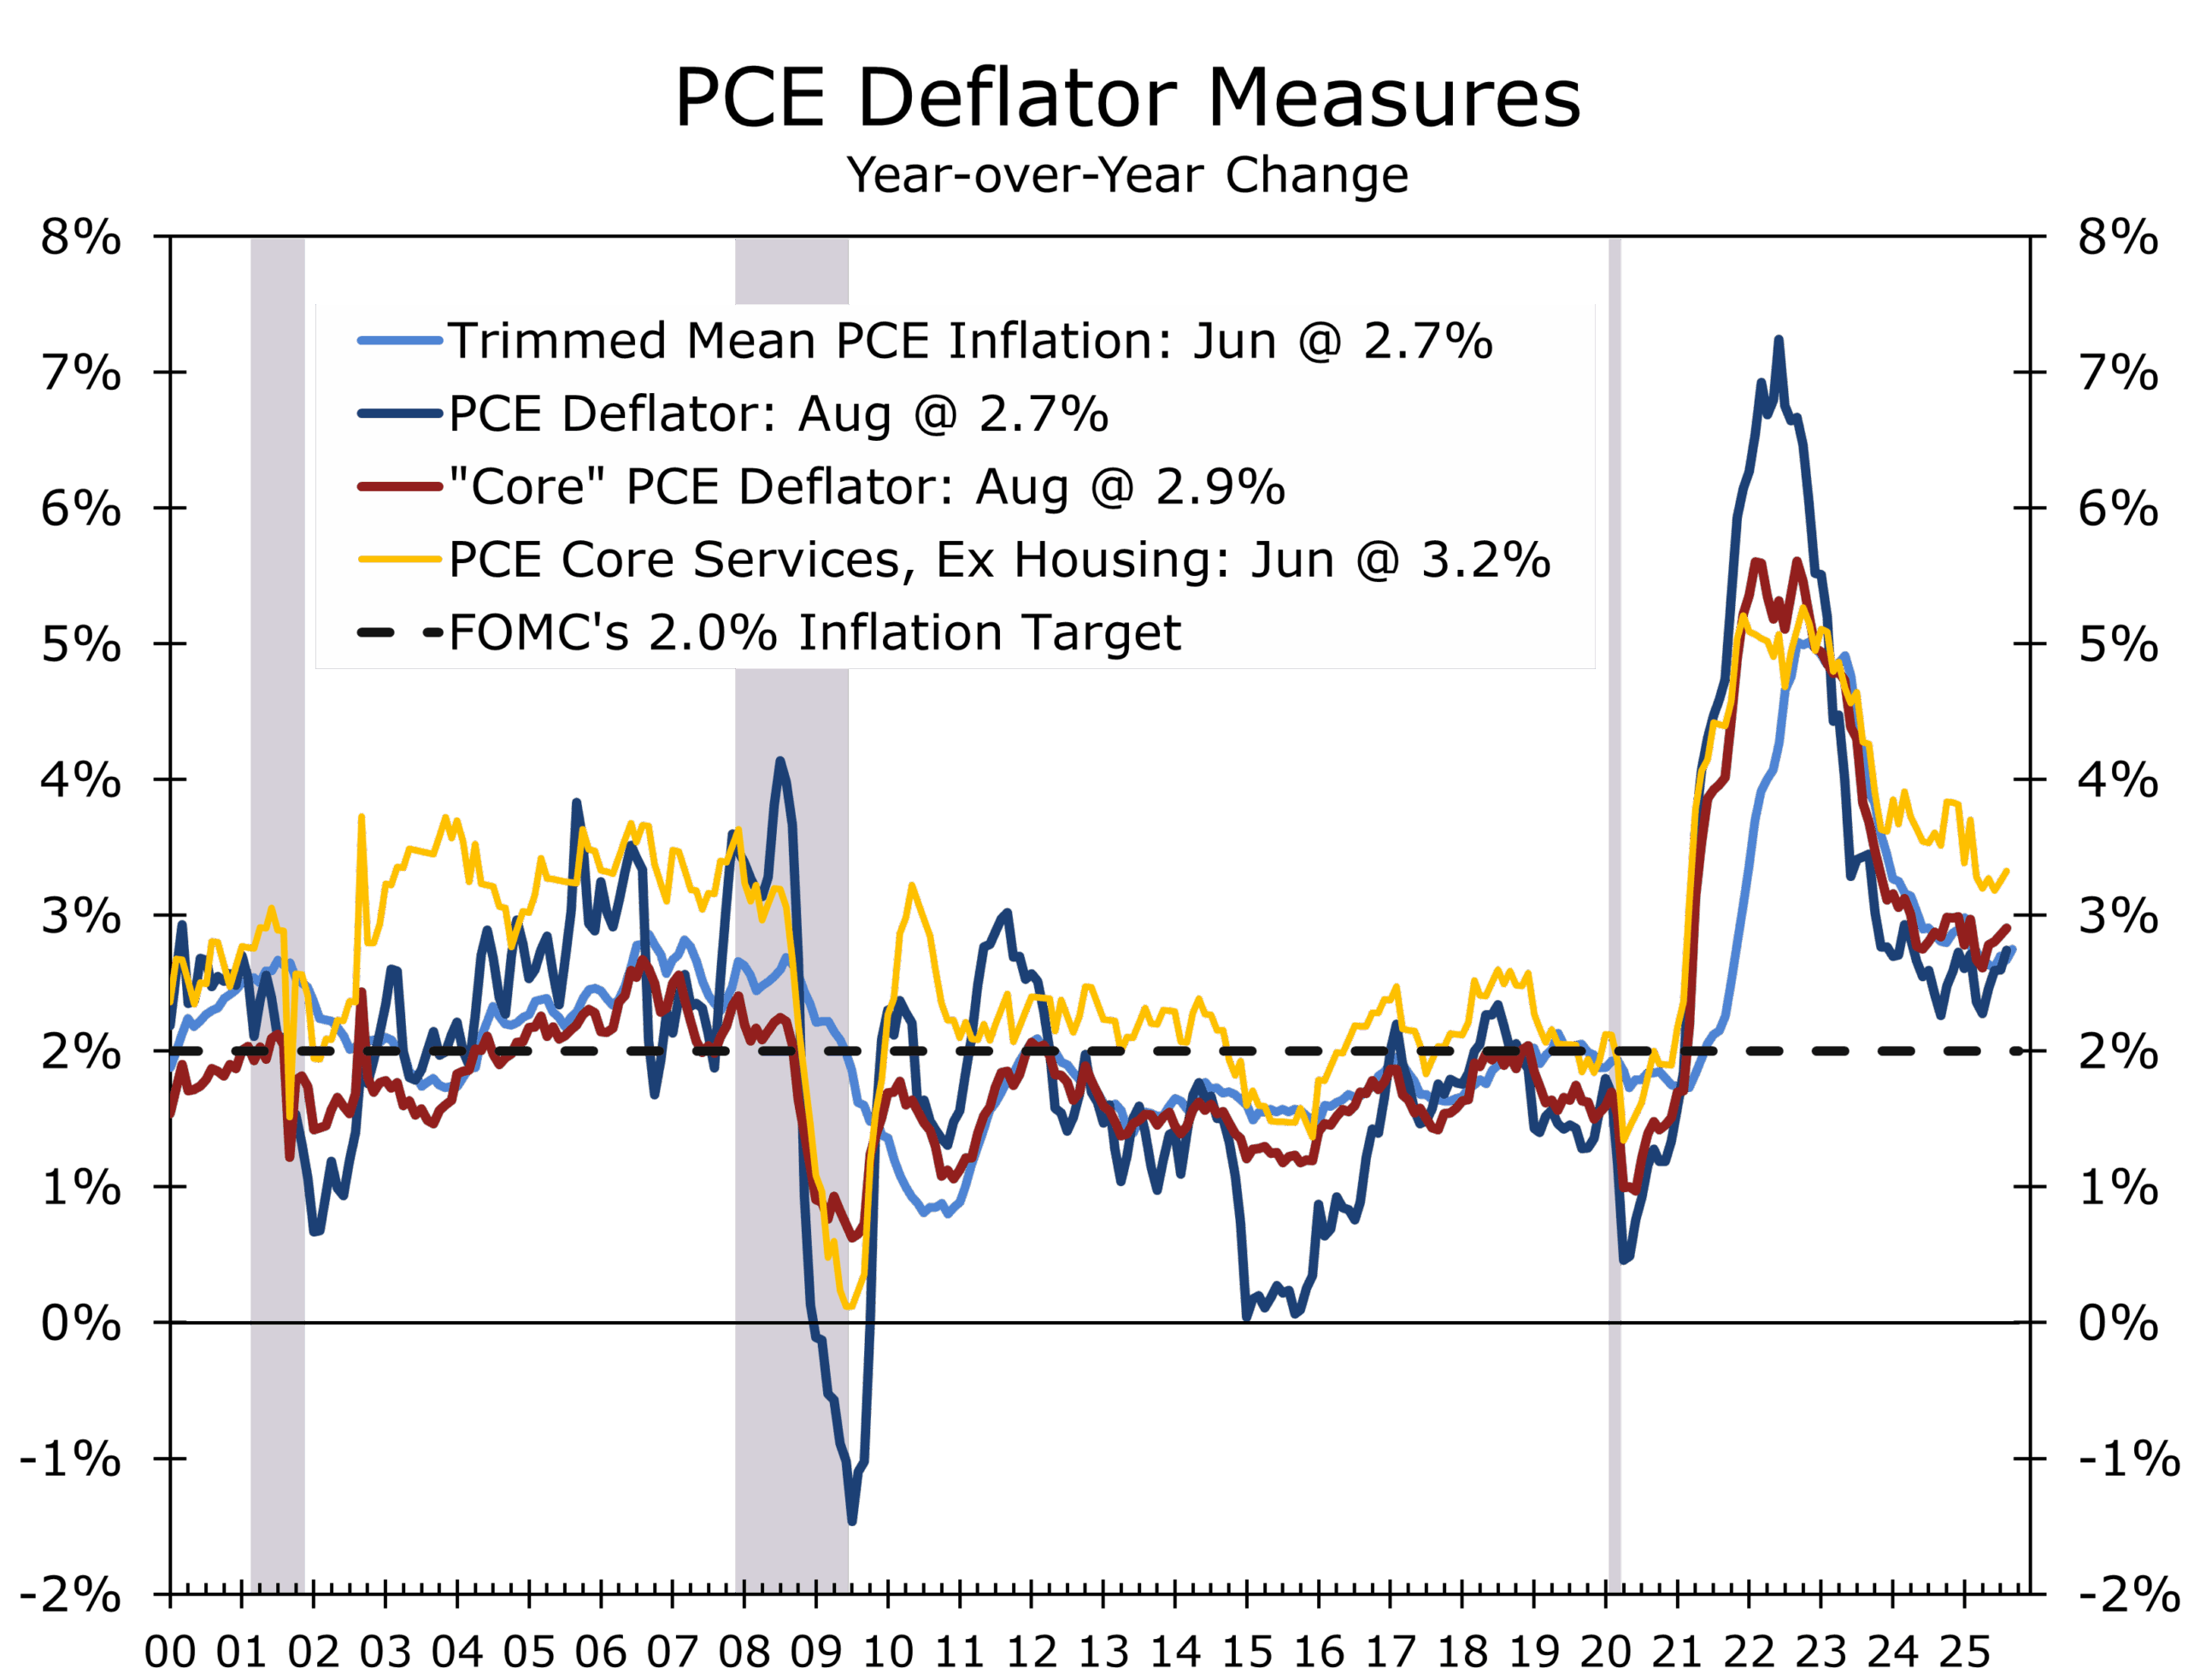
- Inflation Sticky but Moderating: Core PCE rose 0.23% in August, 2.9% y/y. Tariffs are keeping goods prices firmer than services prices.
- Markets and Credit: Treasury yields drifting higher; Investment-Grade spread curves flattening at the back end due to supply-demand dynamics, not credit stress.
- Energy Security: Aging grids and rising AI/defense power needs place metals-intensive investment at the center of national security.
- Washington Risk: High probability of a short shutdown as fiscal year ends Sept 30; even without one, delayed disbursements represent stealth tightening.
Growth & the Consumer
The GDP revisions were a reminder not to bet against the U.S. consumer. Real GDP growth was revised up to 3.8% in Q2, with private final domestic demand advancing 2.9%. Stronger consumption (+2.5%) and a 7.3% rise (annualized) in nonresidential fixed investment were the main drivers.
Consumer spending was led by light vehicle sales and increased outlays for health care, financial services, and travel and entertainment. Business fixed investment was supported by spending on tech equipment, commercial aircraft, and research and development. Structures investment declined, reflecting the wind-down of stimulus-driven outlays for EV and green energy projects. Some projects were halted or canceled during the quarter, but many are now coming back on track.
The GDP by Industry data highlight how growth is distributed across the economy. Intellectual property products and equipment investment led the way, while transportation, finance, and other services provided steady contributions. Housing investment, however, remained a drag, contracting at a 5.1% pace and subtracting from overall Q2 growth. The chart underscores the uneven but resilient character of U.S. growth: productivity-rich sectors are expanding even as rate-sensitive housing lags.
That strength appears to be carrying into Q3. August PCE showed real spending up 0.4% m/m, with revisions boosting earlier months. Our tracking estimate now points to 3.2% growth in Q3 real personal consumption. The composition is skewed toward higher-income households, supported by asset income and wealth effects, while middle- and lower-income consumers remain constrained by moderating wage growth and stubbornly high prices for groceries, rent, transportation, and insurance.
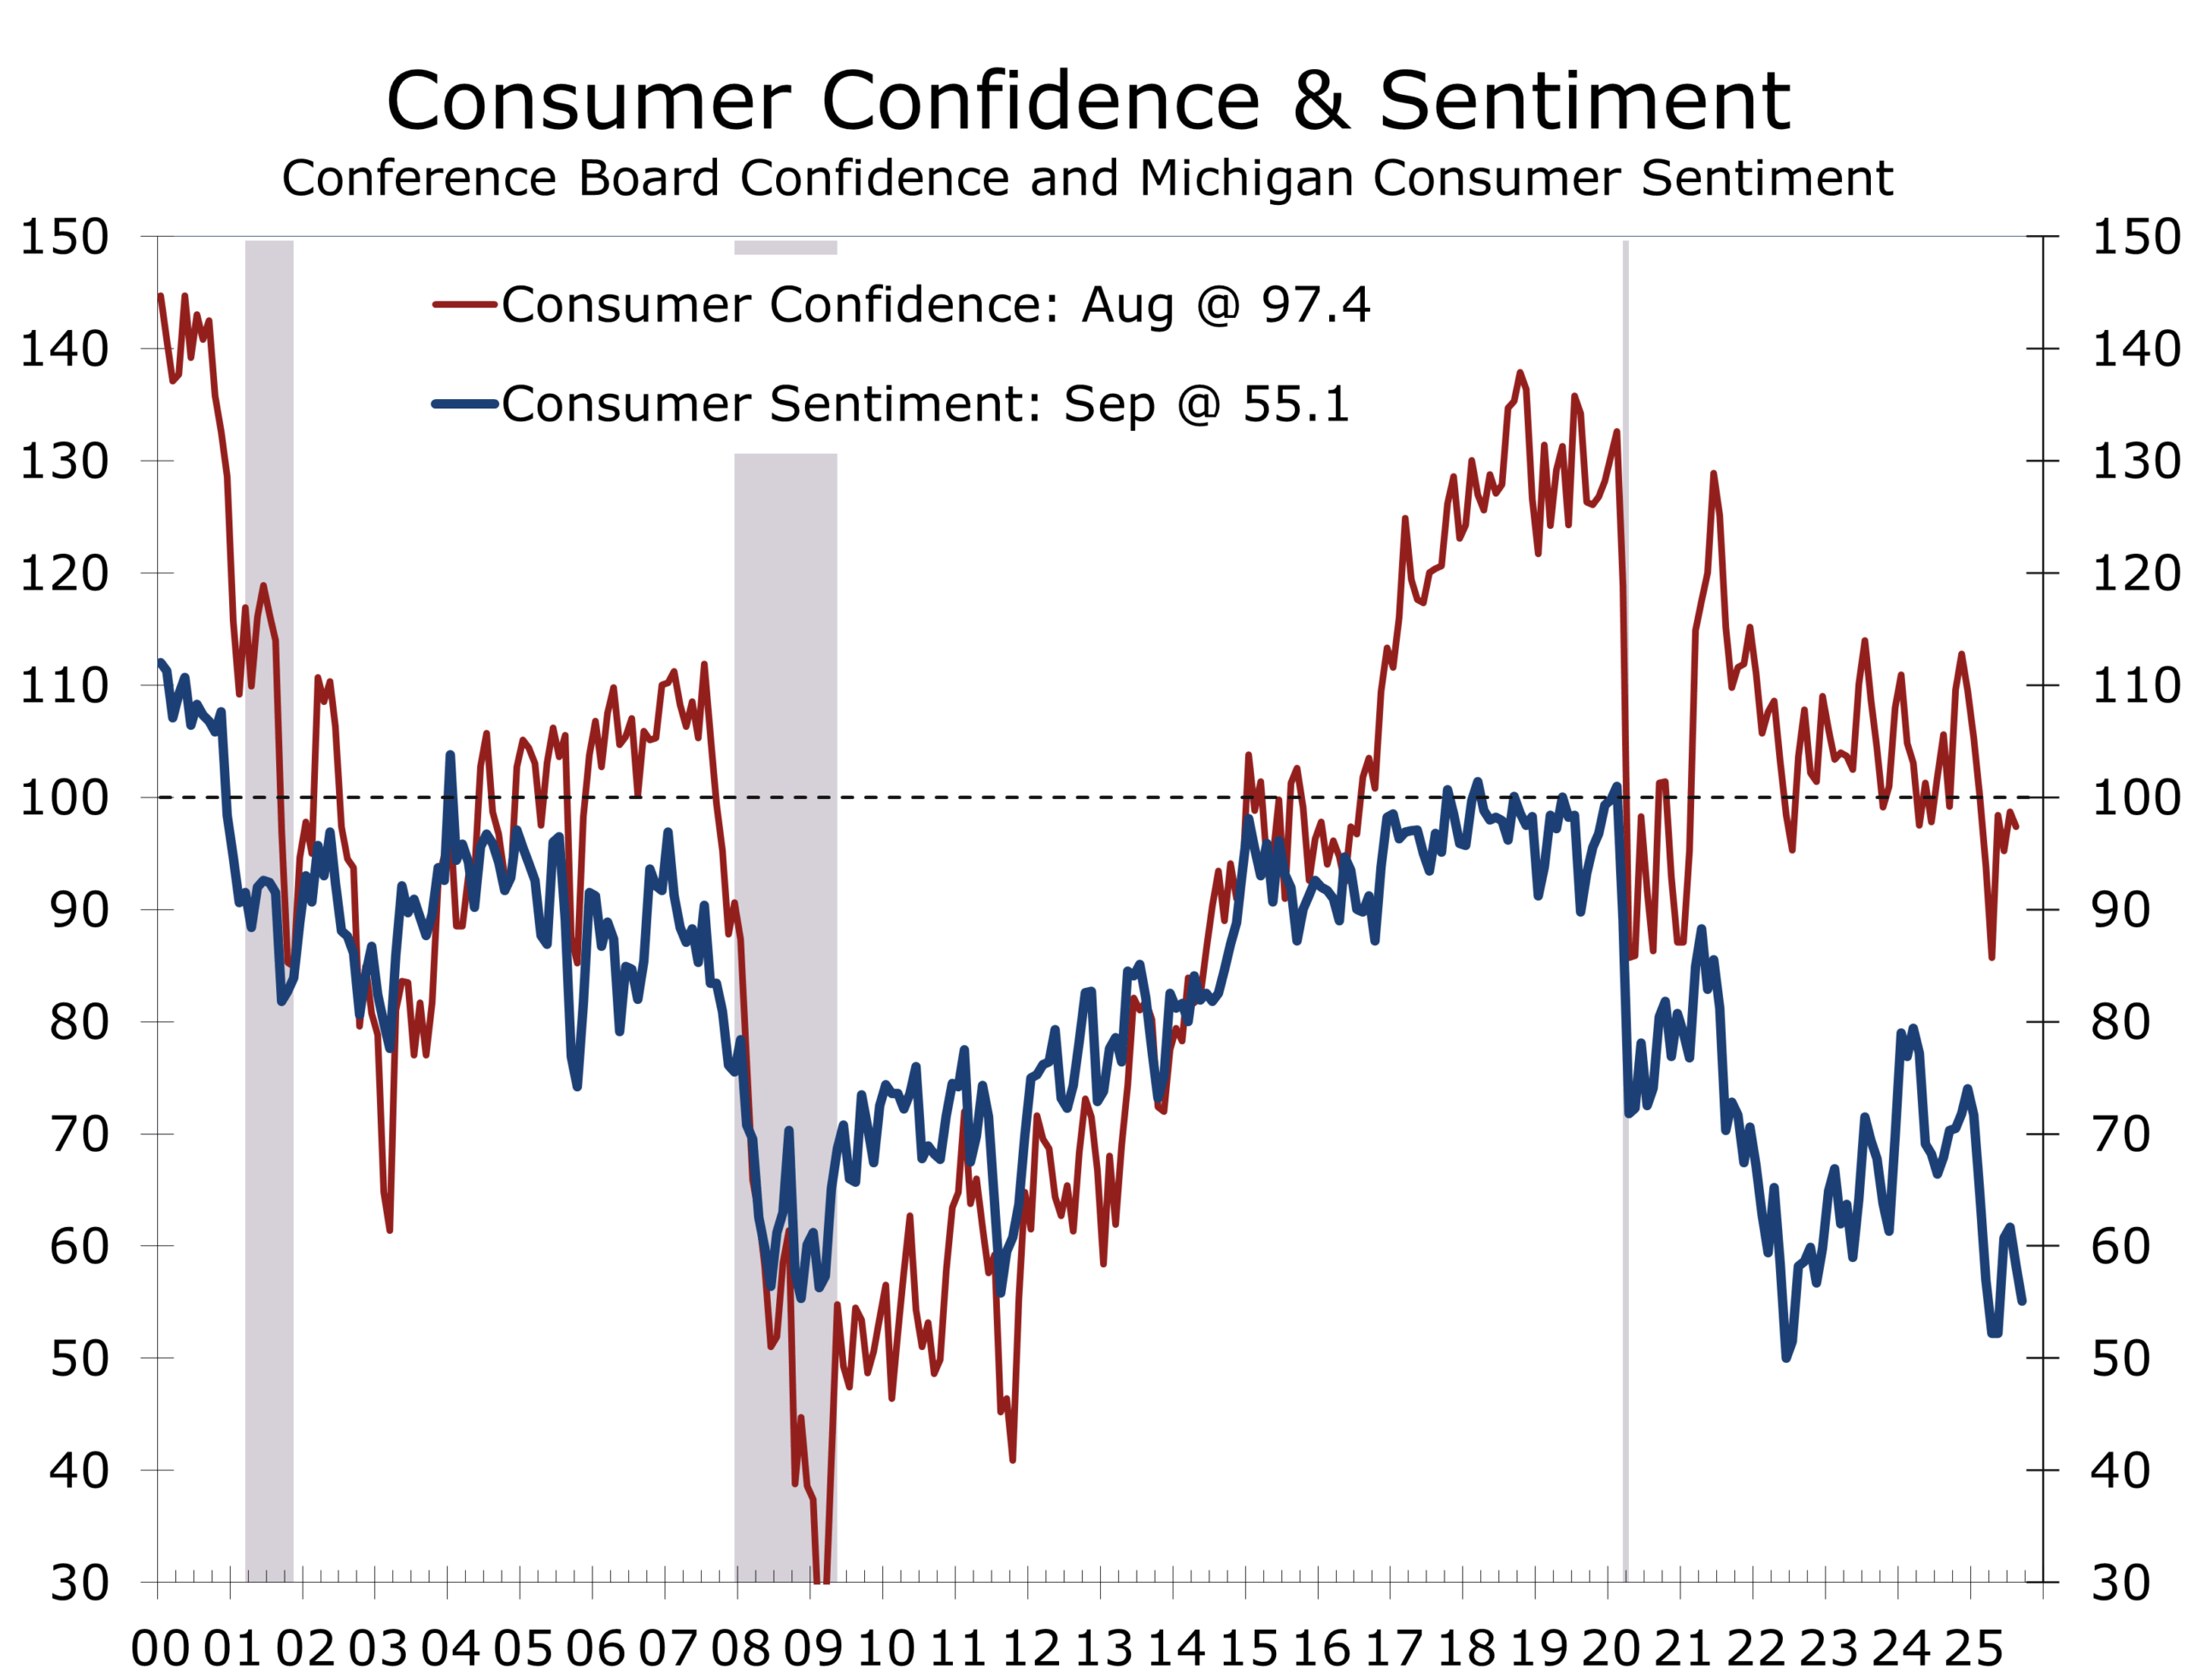
In contrast to the strong spending numbers, Consumer Sentiment slipped in September, with the final University of Michigan index falling to 55.1. Consumer Sentiment remain at levels that are more typical of a deep recession than one growing at around a 3% annual rate. Buying conditions for durables hit a one-year low, underscoring the divergence between higher income and middle and lower income households. Consumers also appear more apt to spend than they say they will.
Shutdown Raises Stakes for September Payrolls
The labor market continues to soften at the margin but is also showing signs of stabilizing. Initial jobless claims fell to 218,000 in the week ended Sept 20, with the four-week average edging lower. Continuing claims also declined modestly, suggesting layoffs remain limited and rehiring continues.
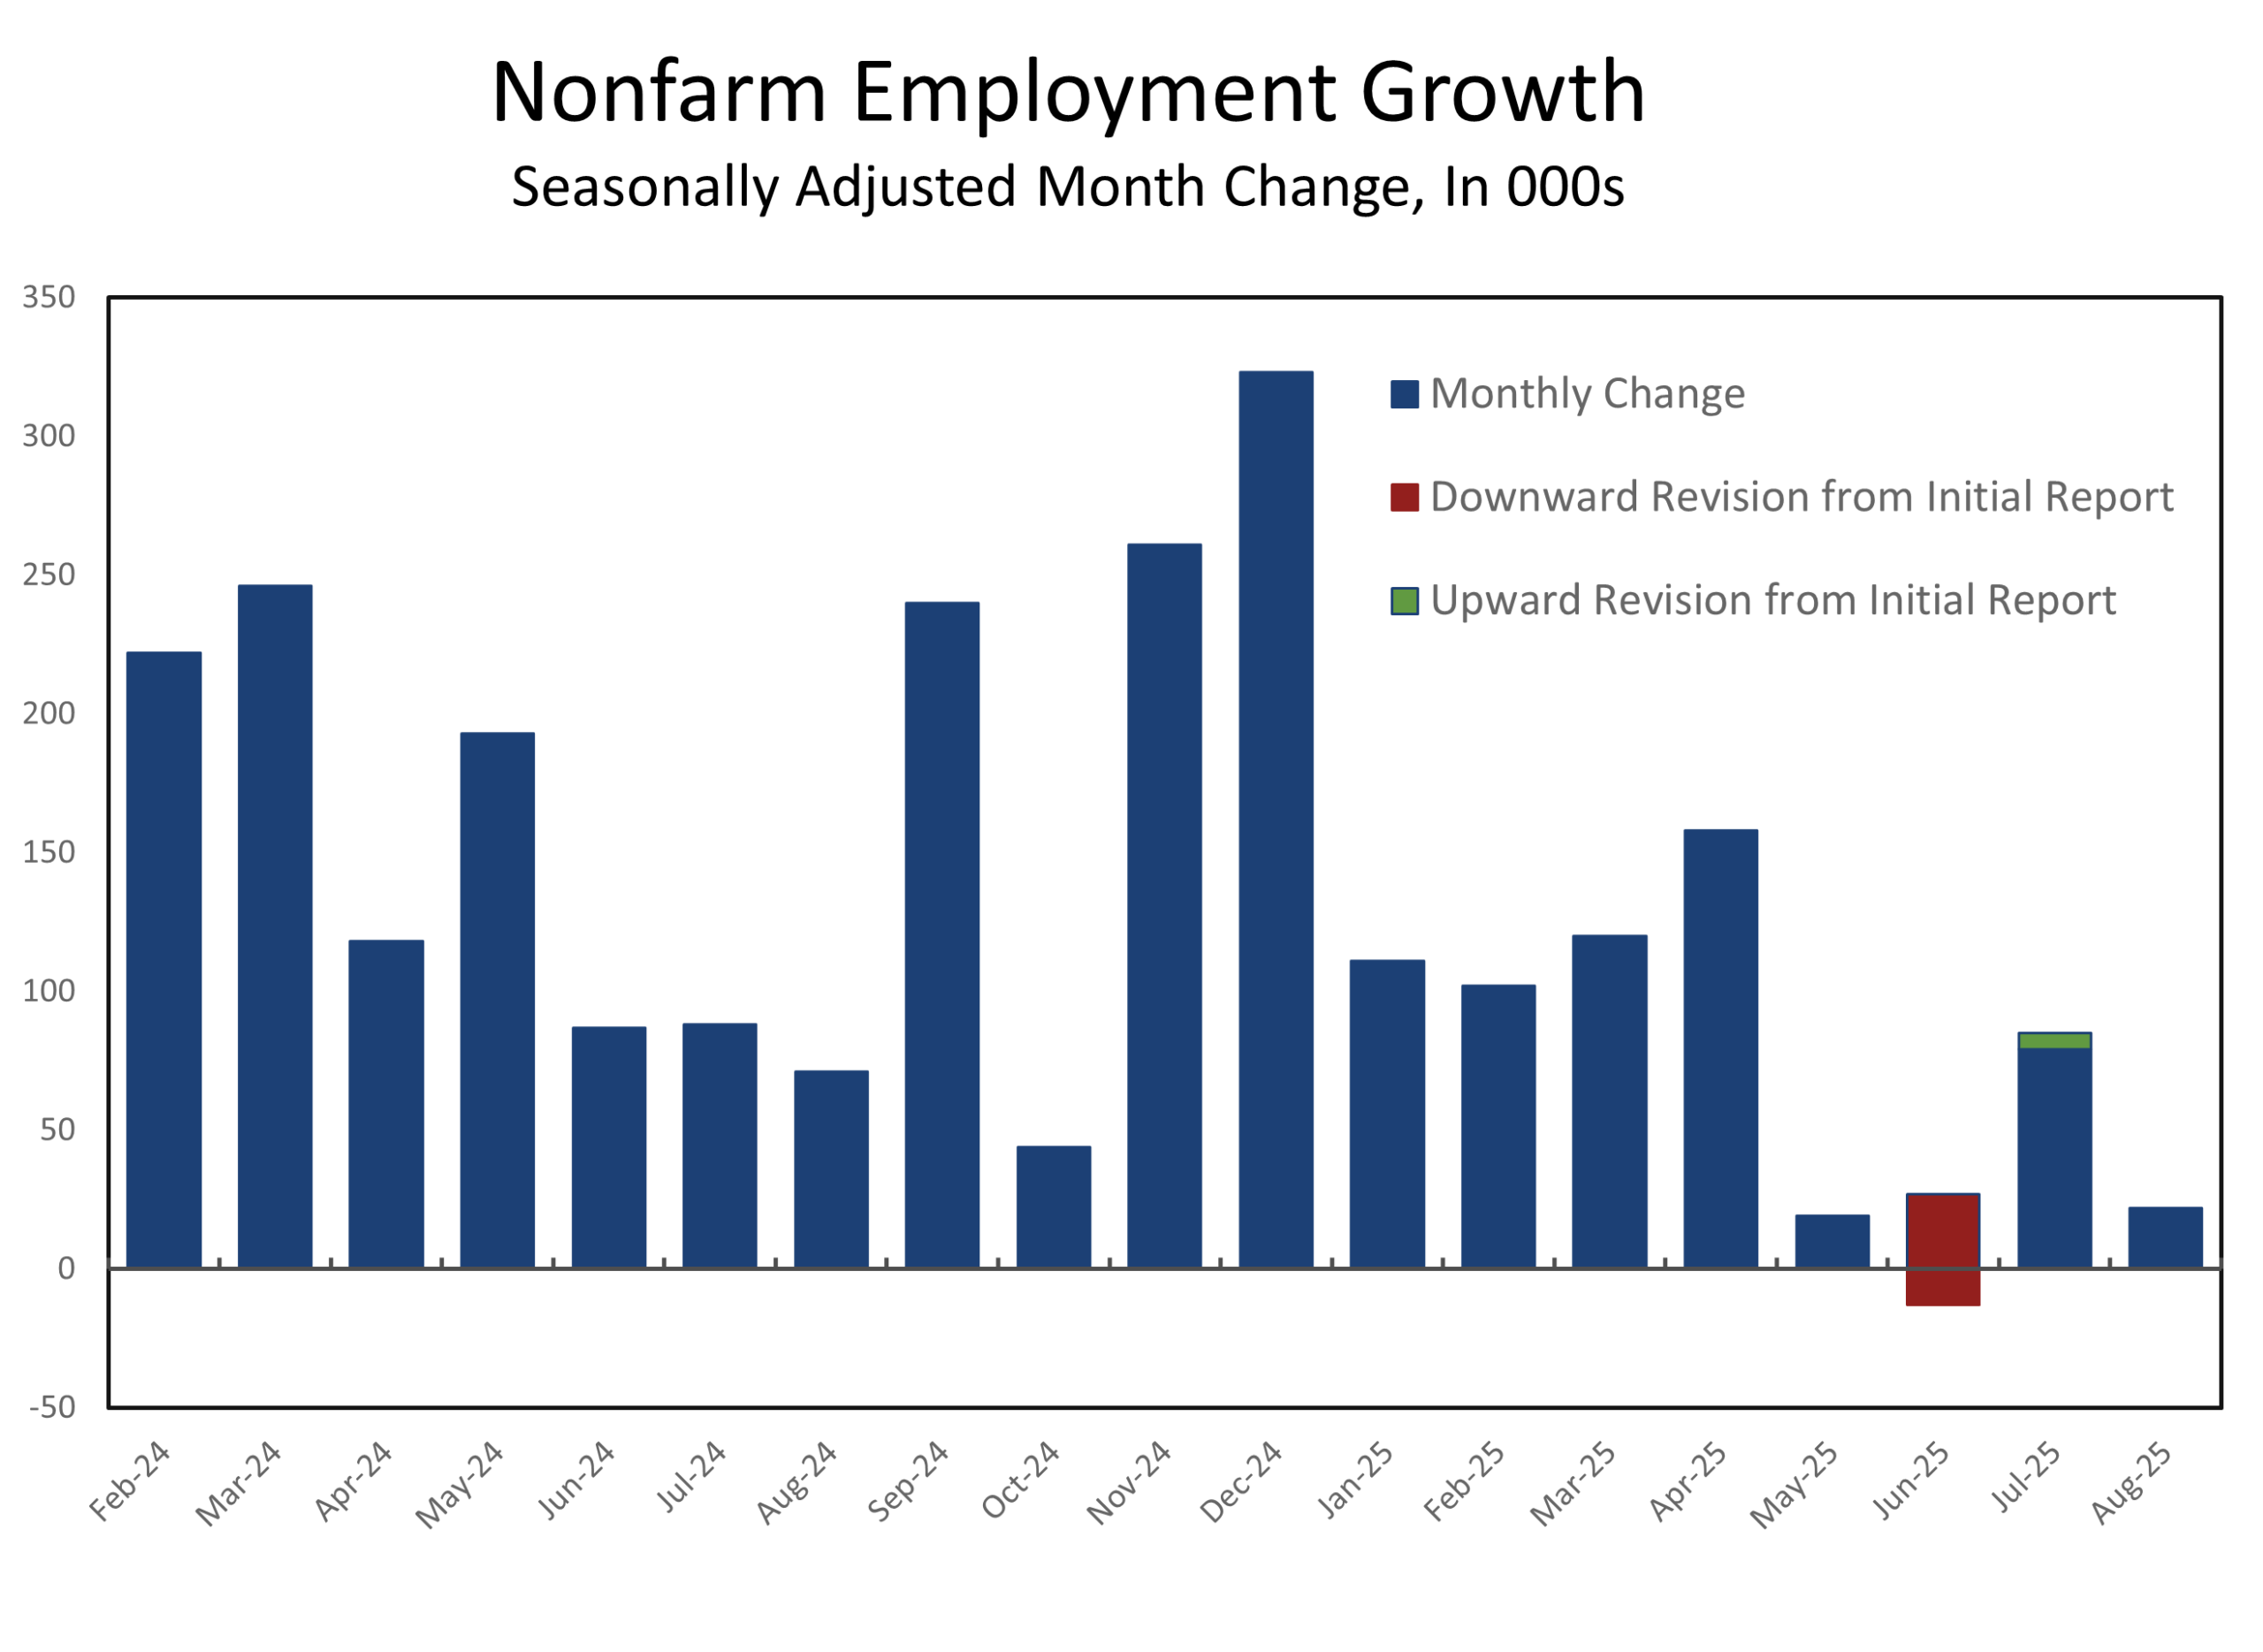
Nonfarm payrolls now serve as both economic signal and political casualty, complicating Fed decision-making.
This week’s September payrolls report, if a government shutdown does not prevent its release, will be pivotal. Markets are looking for a modest rebound from August’s soft print and a steady 4.3% unemployment rate. Nonfarm payrolls fell in June and employers have added an average of just 41,000 jobs a month since April. A shutdown would delay the release and leave the Fed with less clarity heading into the October FOMC meeting — strengthening the case to skip October and wait until December to resume easing. The ADP data will take on more relevance than usual if the government shuts down Wednesday morning..
.
Housing – Locked In and Locked Out
The housing data remain confounding. New-home sales surged to an annualized pace of 800,000 units in August, the strongest since early 2022. But the series is notoriously volatile and prone to revision, and the spike likely overstates the sector’s true momentum. Builders have been offering increasingly aggressive discounts and incentives to clear inventories, and the stock of completed new homes remains the highest since 2009. At August’s pace, the months’ supply of new homes fell to 7.4 from 9.0 in July, but the overhang of finished units should continue to weigh on single-family starts in the months ahead.
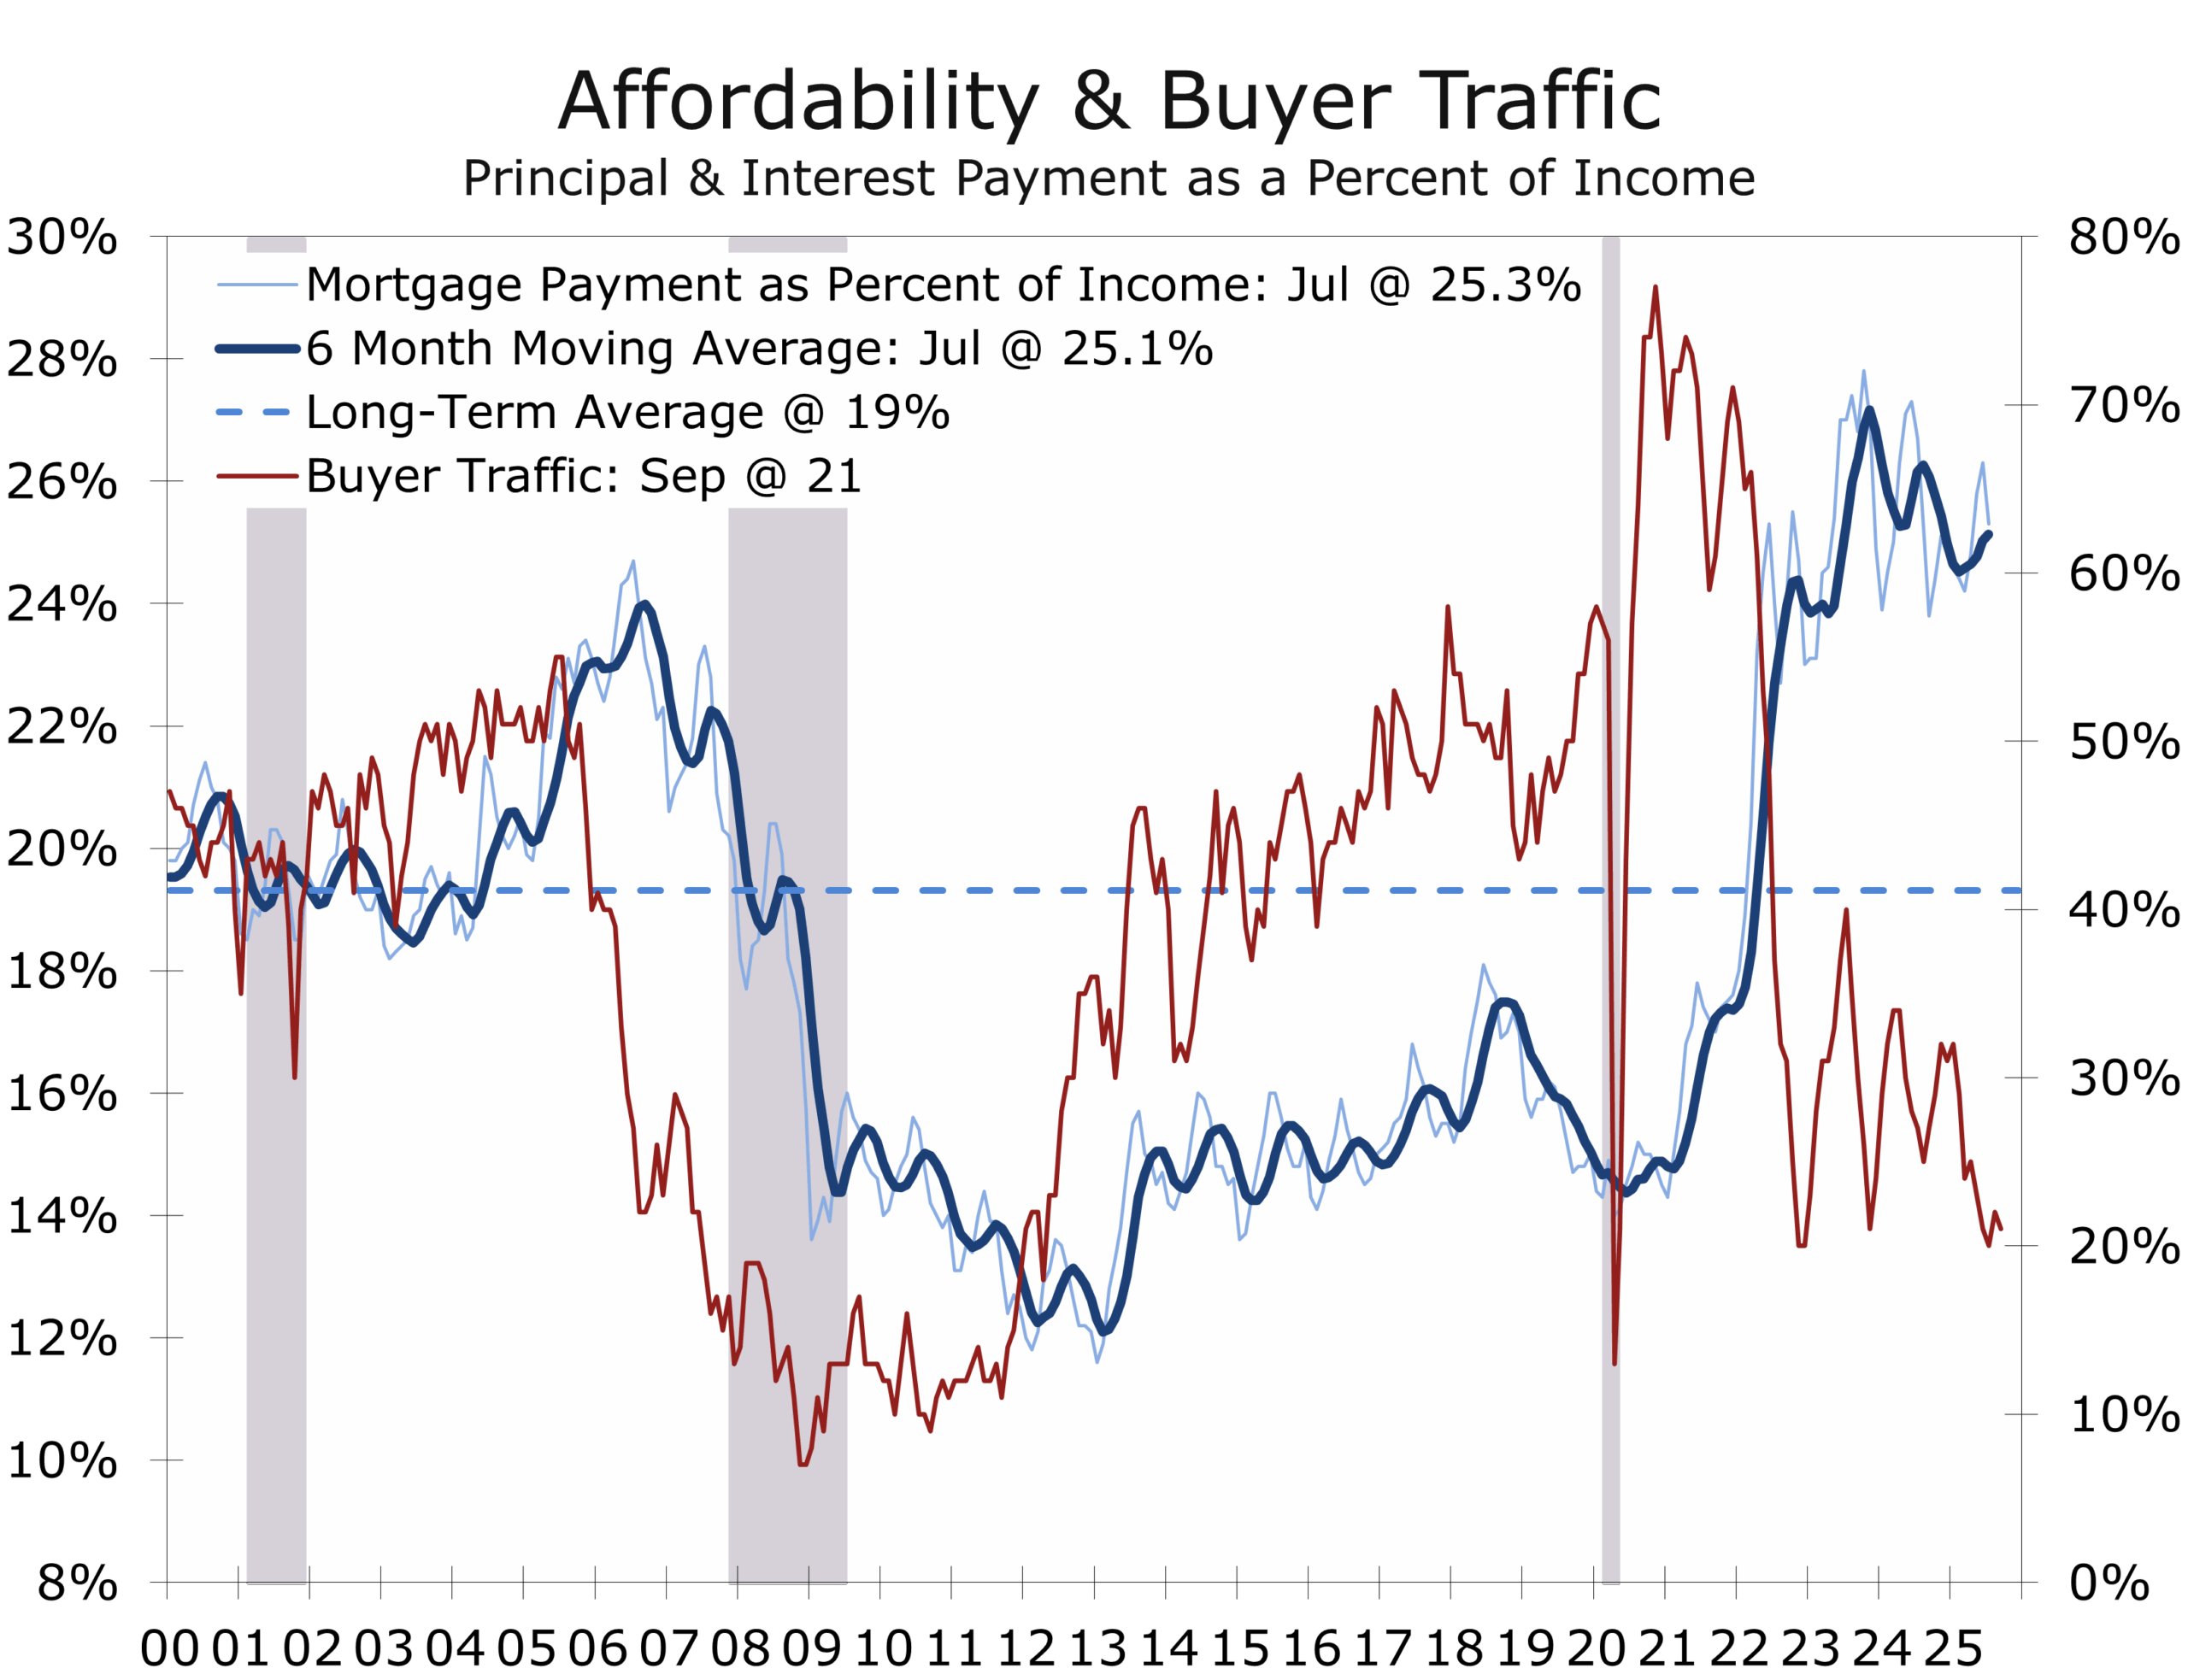
With affordability near 40-year lows, many potential home buyers remain on the sidelines.
Existing-home sales were little changed at an annual rate of 4.0 million units in August, slightly better than expected. Inventories slipped modestly on the month but were still up nearly 12% from a year earlier. A growing number of homeowners are delisting properties after failing to receive acceptable offers, suggesting supply could tighten into year-end. That could provide some support to prices, which edged lower in August but remain about 2% higher than a year earlier. The National Association of Realtors estimates the average homeowner has gained nearly $141,000 in equity over the past five years, but much of that wealth remains locked in place by the “golden handcuffs” of ultra-low mortgage rates.
Sticky Inflation, Uneven Spending
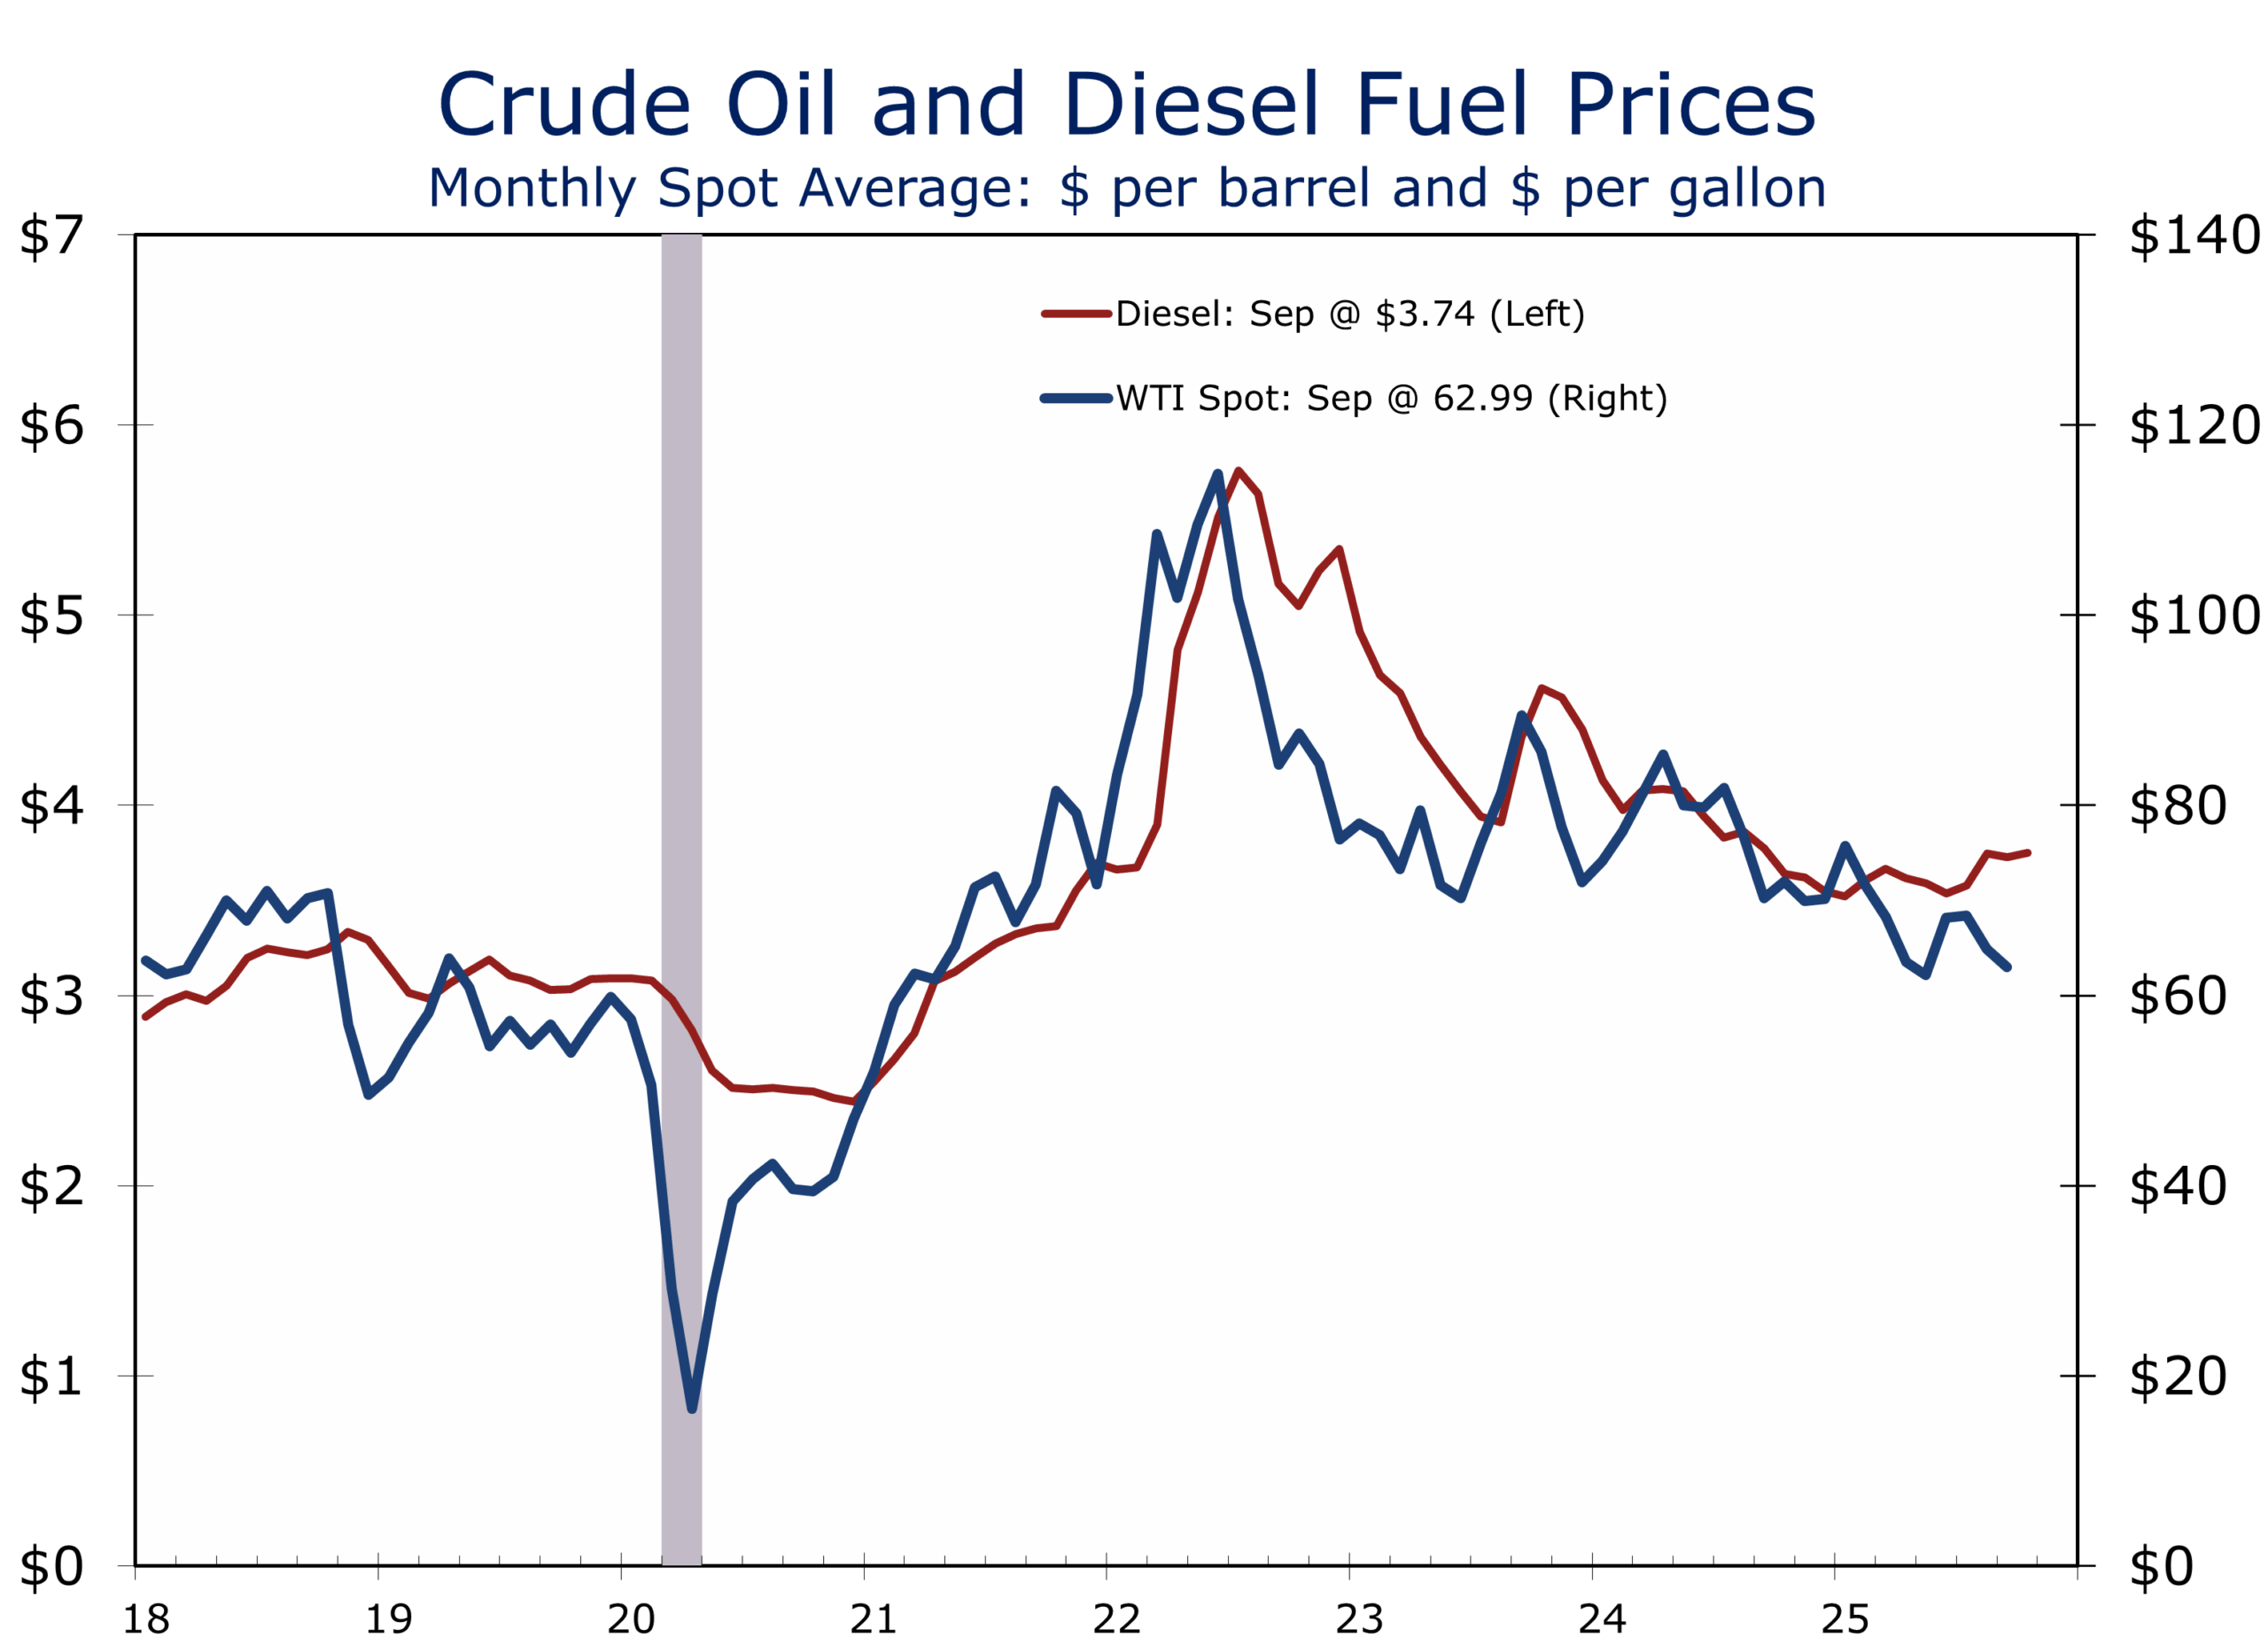
Inflation remains sticky but is gradually easing. Core PCE rose 0.2% in August, leaving the year-over-year rate at 2.9%, while headline PCE held at 2.7%. The distinction between headline and core remains critical: energy prices have been subdued, but tariffs are keeping core goods inflation firmer than it otherwise would be. Excluding tariffs, underlying inflation would likely be closer to 2.5%.
The real story lies in services. Core services inflation has steadied near 3.6%, with shelter costs gradually decelerating but still elevated. Excluding housing, services prices are running closer to 3.0%, underscoring persistent stickiness in categories such as insurance, healthcare, and transportation. This is why the Fed continues to emphasize services ex-housing as the clearest gauge of whether inflation is truly on track toward target.
On the spending side, momentum remains solid. Real personal consumption expenditures rose 0.4% in August, with prior months revised higher. The revisions also lifted estimates of household income, reinforcing the view that consumer resilience is increasingly “top heavy.” Affluent households, buoyed by equity and real estate wealth, continue to spend freely on discretionary categories such as travel, dining, and financial services. By contrast, middle- and lower-income households remain stretched by persistent inflation in everyday necessities like groceries, rents, and insurance.
Consumer resilience is increasingly top heavy, with affluent households driving growth.
This mix supports a cautious Fed. Inflation is cooling, but not fast enough to justify a faster rate-cut path, especially with spending still resilient. Measured inflation may tick somewhat higher in the near term before drifting lower and converging toward the Fed’s 2% target in 2026.
Markets Constructive, Long End Costly
Treasury yields drifted higher last week, with the 2–7 year sector up 8–10 bps as markets unwound near-term easing bets. Repo rates showed the usual quarter-end firmness, and effective fed funds inched higher — evidence of underlying money-market tightness as quarter-end approaches. Longer maturities were steadier, leaving the curve slightly flatter and reinforcing the sense that near-term policy repricing is doing most of the work.
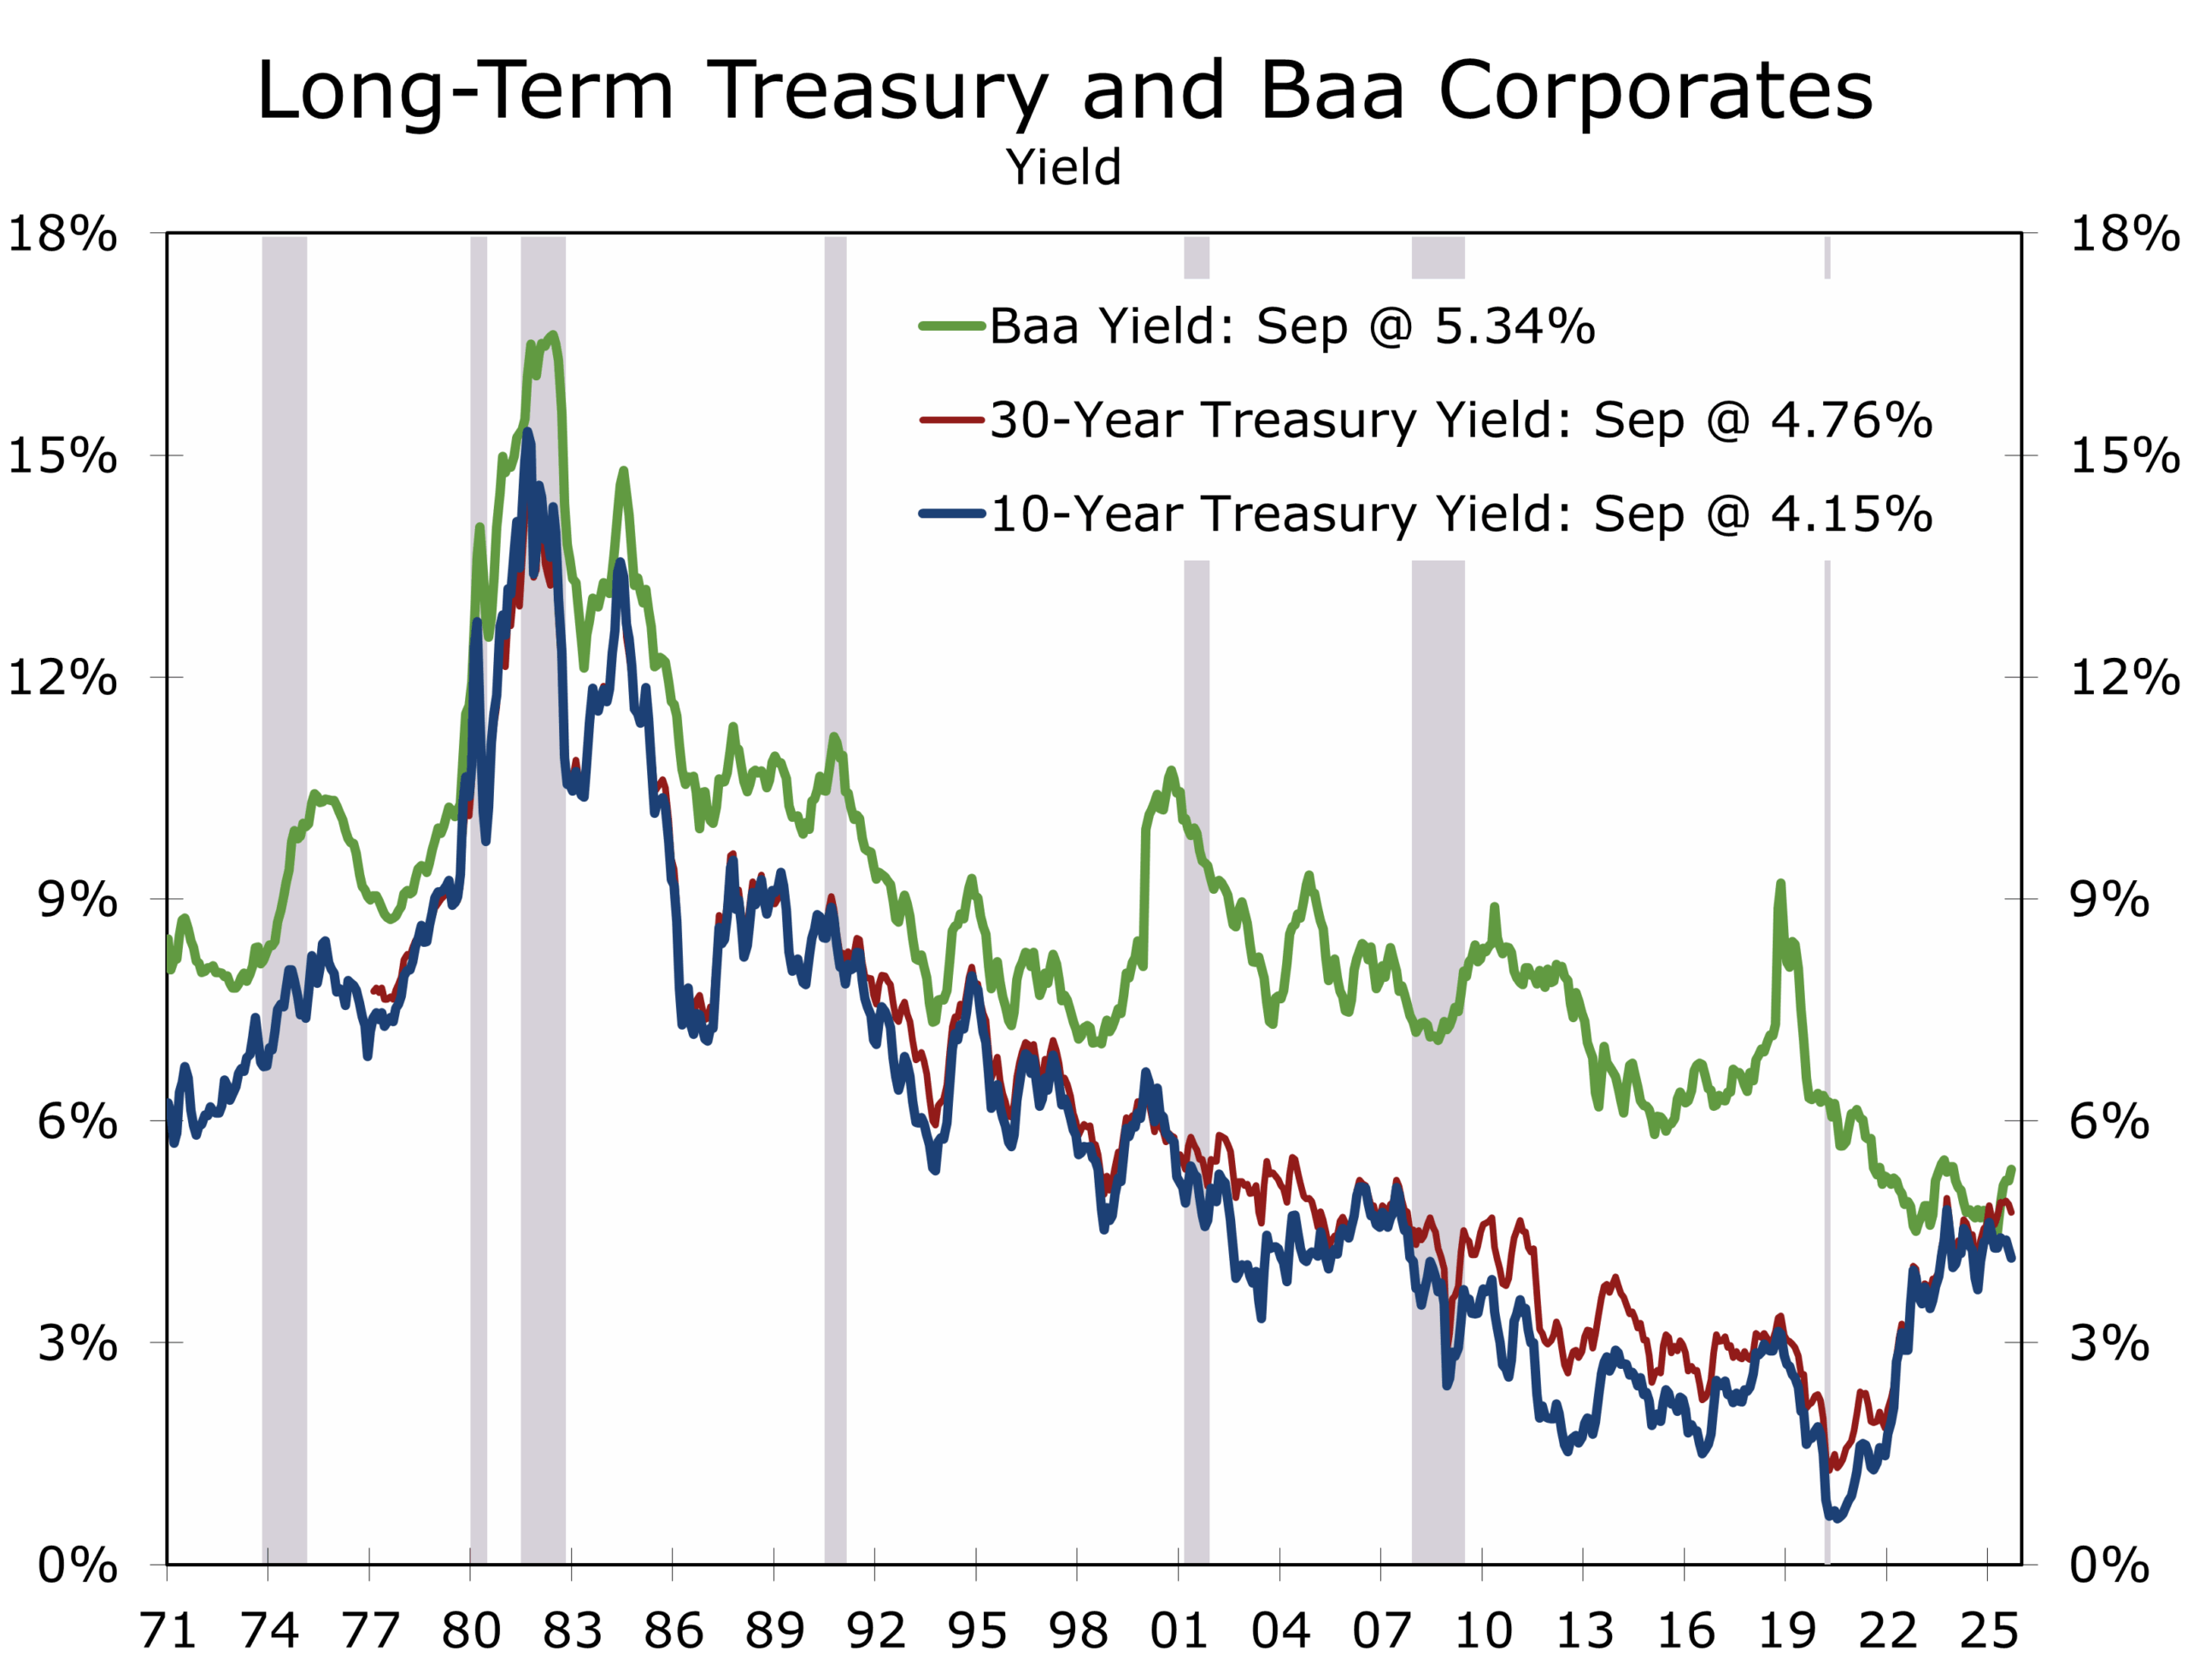
Credit markets remain constructive. Investment-grade spreads are holding near cycle tights, supported by healthy corporate balance sheets and steady demand. Curve dynamics are unusual, however. The back end of corporate spread curves has flattened, even modestly inverted in some cases, reflecting technical factors such as pension and insurer demand and limited issuance. Importantly, this does not signal rising default risk. For CFOs, the message is that all-in long-end funding costs remain elevated — not because spreads are widening, but because Treasury yields at the back end are still high. That leaves liability-driven investors active, but keeps opportunistic issuance focused in shorter maturities.
Geopolitics & Policy: Escalation Ladders, Energy Arithmetic, and the Dollar’s Two Tracks
Russia-NATO tensions are climbing the escalation ladder. Analysts mark up the probability of military incidents spilling into sanctions enforcement and energy logistics, with a 40% chance of broader Ukraine escalation into Q4. Expect tighter sanctions enforcement on Russian energy flows and a tactical bias toward oil strength before gold reasserts its role as a safe haven over 12 months.
On China, stimulus paired with a 15th Five-Year Plan growth target around 5% per annum would put a floor under activity, but U.S. and EU measures are likely if Moscow presses its advantage. Expect Washington to tighten sanctions on Russia first, while dangling tariff relief for allies to manage coalition politics.
Stikes on Russian energy infrastructure and tighter sanctions likely to lift oil and distillates.
The Middle East remains combustible but less likely to erupt into a region-wide war. Israel is still seaking a knockout punch against Hamas, which has European leaders scrambling for cover, recognizing a nonexistent Palestinian state. U.S. strategic exports and Gulf supply increases help lean against crude spikes, but distillates and logistics premia are more likely to feel the strain.
FX markets reflect the duality of dollar “dominance” versus persistent depreciation pressures. Liquidity and settlement flows anchor the dollar, but diversification by reserve managers continues. Expect USD strength on shocks but drift otherwise.
Finally, Washington gridlock is front and center. The probability of at least a short shutdown this week is high. Even absent a lapse, disbursement delays amount to stealth tightening for contractors, healthcare providers, and universities. A shutdown would also delay the monthly payroll report, reducing Fed visibility ahead of the October meeting.
Underreported Risks
While markets focused on Washington’s budget standoff, a significant escalation unfolded at sea. Houthi forces stepped up attacks on Israel, hitting a hotel in Eilat, and on commercial shipping in the Red Sea, resuming a campaign that had eased earlier in the summer. Insurance premia are rising again, rerouting costs are mounting, and the risk of further disruptions to global supply chains is material. Unlike headline crude, the more immediate impact is likely to show up in diesel and freight markets, where margins are already tightening.
Beyond the Middle East, GPS jamming incidents in the Baltic and stepped-up Ukrainian strikes on Russian refineries are adding to global logistics pressure. Together, these developments highlight a vulnerability that often escapes market attention: the security of supply chains and transport corridors. For corporates, the lesson is to stress-test exposure not just to headline oil shocks but to refined product shortages, shipping insurance costs, and transit disruptions that can ripple quickly into working capital and inventory management.
The Week Ahead
- Monday: White House meeting with congressional leaders on funding; Pending Home Sales, Dallas Fed manufacturing survey.
- Tuesday: Consumer confidence, S&P Case-Shiller Home Prices, and JOLTS .
- Wednesday: ADP employment, ISM manufacturing, construction spending and light vehicle sales.
- Thursday: Jobless claims, Challenger layoffs, factory orders.
- Friday: September payrolls (subject to shutdown), ISM services.
Shutdown brinkmanship is the wild card. A short lapse would delay payrolls and complicate the Fed’s decision-making. Meanwhile, energy and shipping risks keep distillates and logistics costs in focus more than headline crude.
Resilience vs Risk
The contrast between Washington’s gridlock and the private economy’s Goldilocks resilience is striking. GDP revisions and PCE data show private demand powering ahead, while Congress edges toward dysfunction. For the Fed, this mix argues for patience: cut gradually, but avoid overcommitting. For businesses, the lesson is clear — the private economy is adapting and expanding, but execution risk from Washington remains a wild card.
The economy does not simply grow — it constantly evolves. Today, it is evolving in two directions: private-sector strength and public-sector paralysis. Which side dominates in the quarters ahead will determine whether Goldilocks prevails or gridlock takes its toll. We believe Goldilocks will prevail and are encouraged that Congress has passed all its appropriation bills ahead of the fiscal year-end — something not seen in decades.
We have updated our forecast to incorporate the latest GDP data and annual revisions. Real GDP is now expected to rise at a 3% annual rate in Q3, followed by a 2% pace in Q4, when trade and inventories are likely to again subtract from headline growth. Our baseline assumes quarter-point reductions in the federal funds rate at each of the next three FOMC meetings, though we are sympathetic to the case for cuts at alternating meetings. A slower cadence would extend the easing cycle and better align with the timeline needed to foster a more sustainable recovery in home sales and new construction — allowing home prices, interest rates, and incomes to gradually move back into buyers’ favor.
We have updated our forecast to incorporate the latest GDP data and annual revisions. Real GDP is now expected to rise at a 3% annual rate in Q3, followed by a 2% pace in Q4, when trade and inventories are likely to again subtract from headline growth. Our baseline assumes quarter-point reductions in the federal funds rate at each of the next three FOMC meetings, though we are sympathetic to the case for cuts at alternating meetings. A slower cadence would extend the easing cycle and better align with the timeline needed to foster a more sustainable recovery in home sales and new construction — allowing home prices, interest rates, and incomes to gradually move back into buyers’ favor.
Disclaimer: This publication has been prepared for informational purposes only and is not intended as a recommendation offer or solicitation with respect to the purchase or sale of any security or other financial product nor does it constitute investment advice.
September 29, 2025
Mark Vitner, Chief Economist
mark.vitner@piedmontcrescentcapital.com
(704) 458-4000