Economic Growth Looks Solid on the Surface
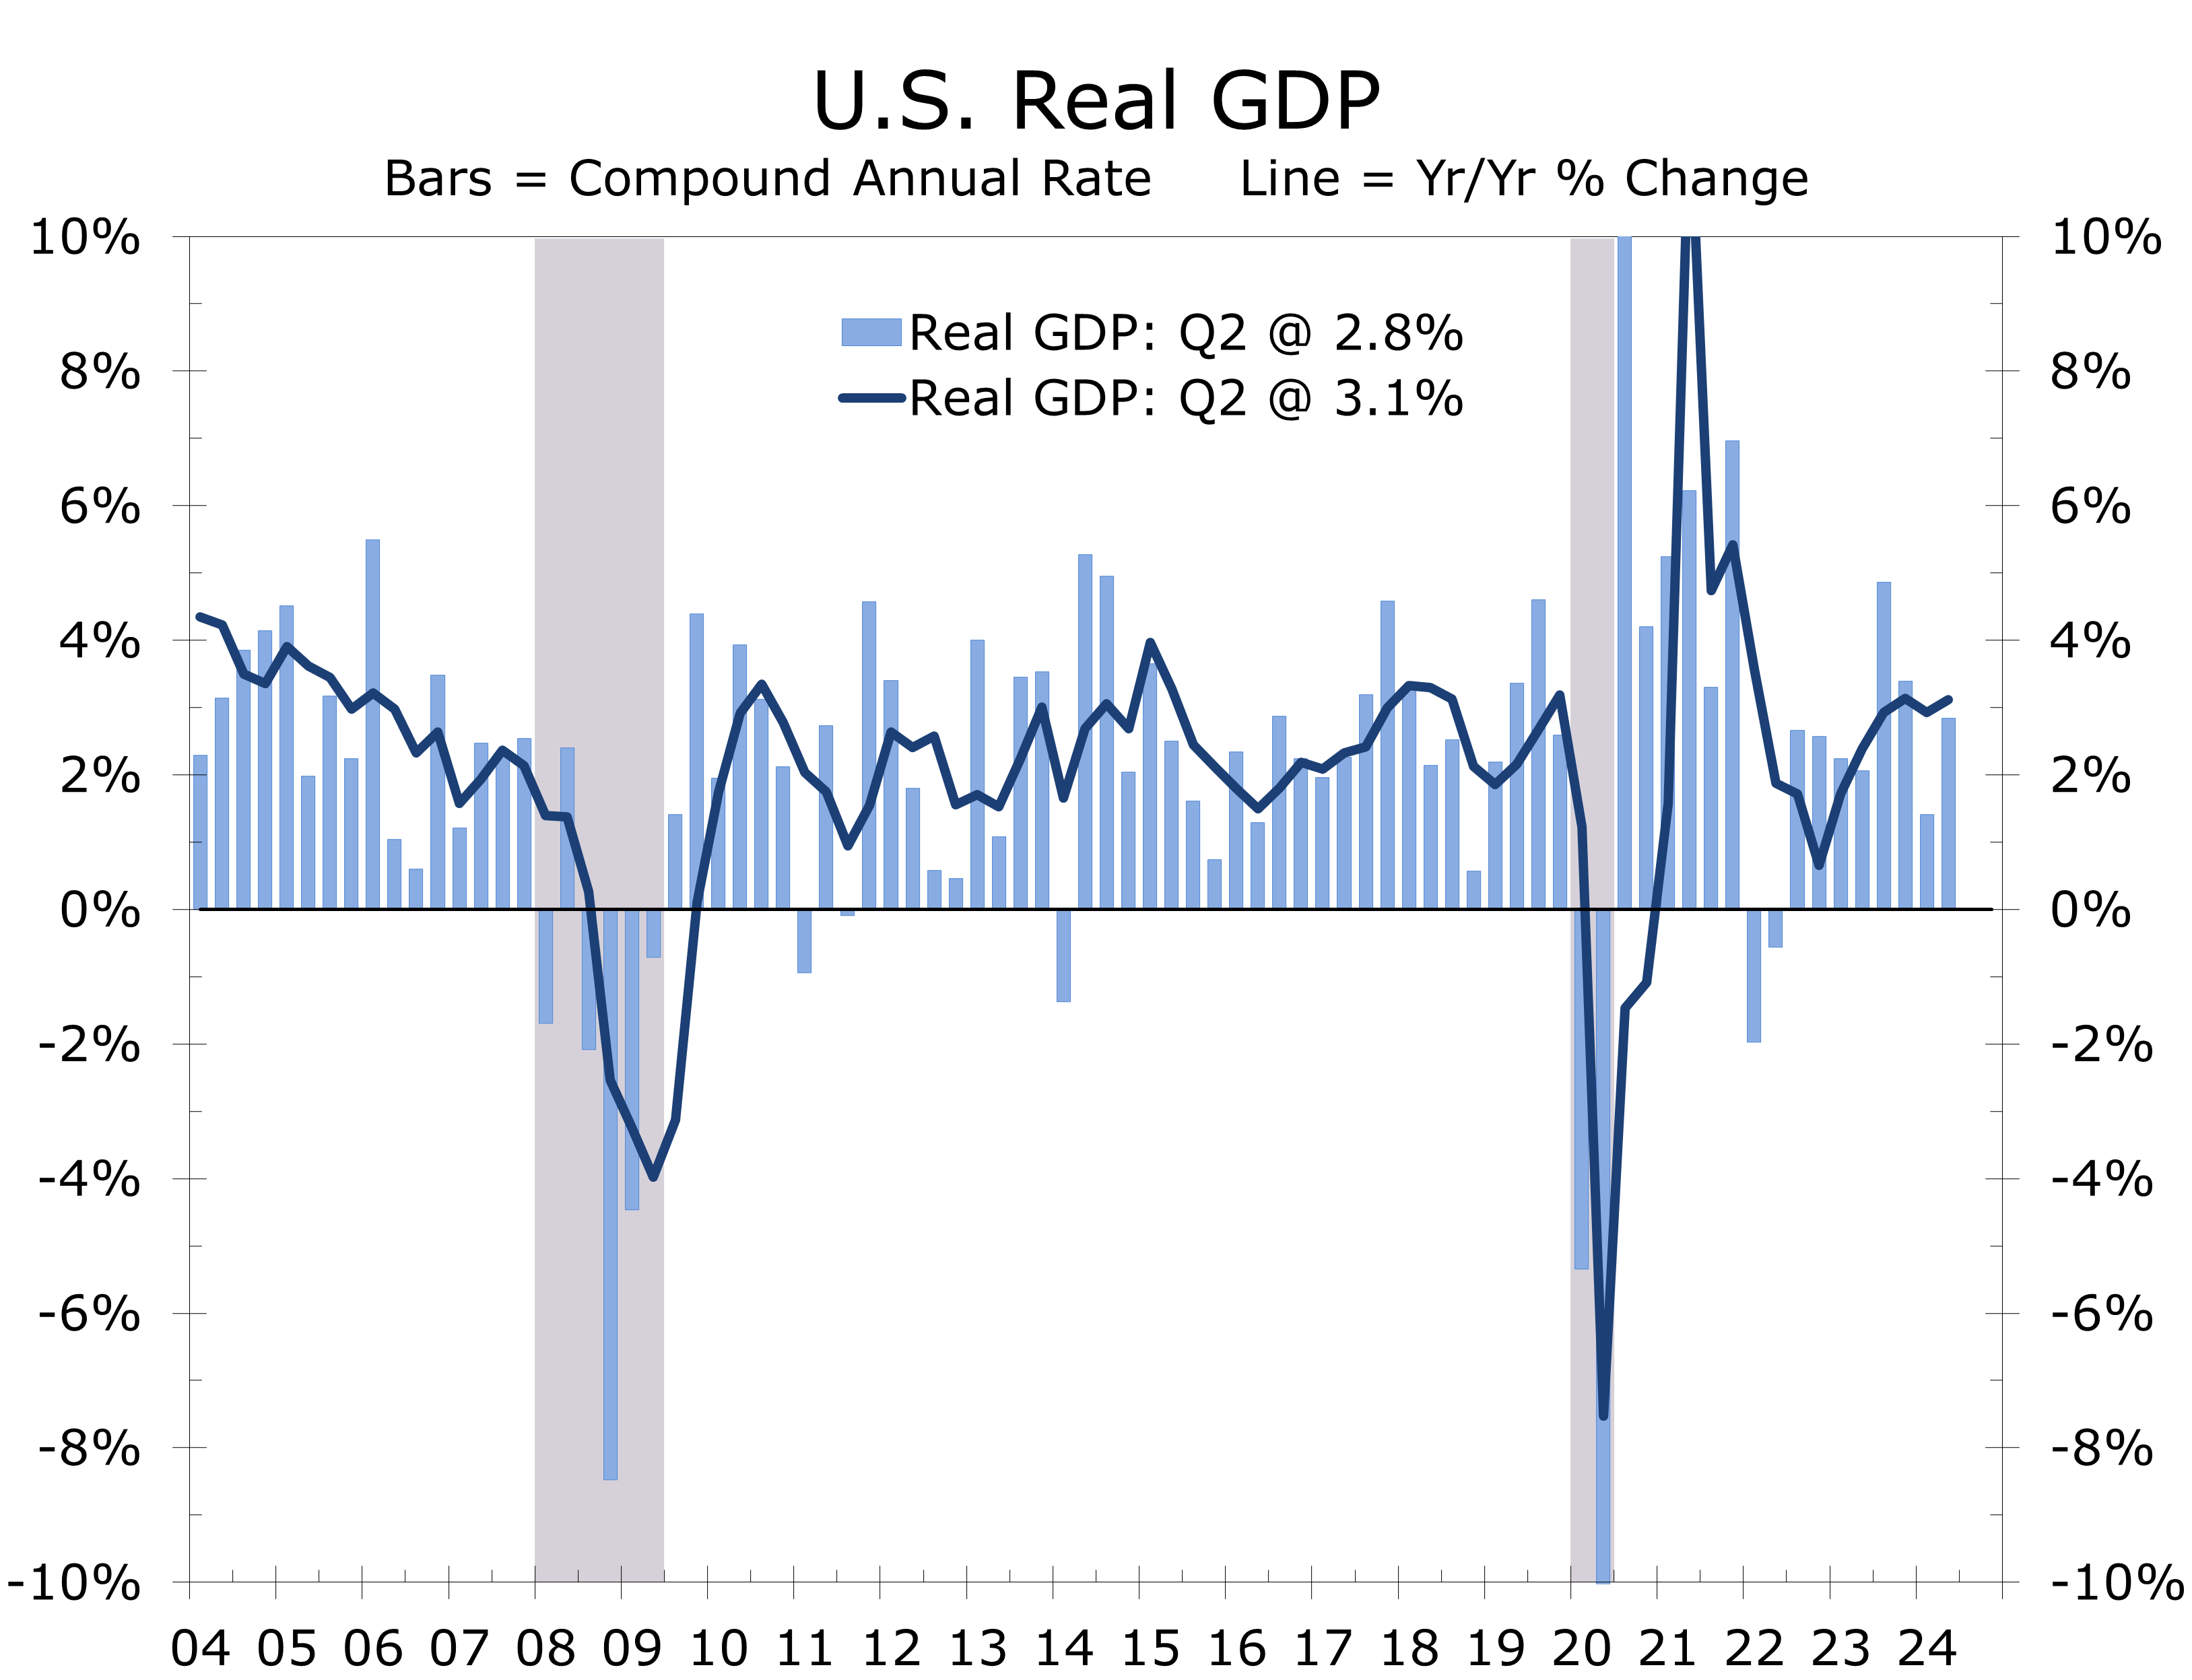
- Real GDP grew at a 2.8% annual rate in Q2, up from 1.4% the previous quarter and easily topping expectations centered around a 2% pace. Real GDP is up 3.1% year-to-year.
- Private domestic demand held strong, with consumer spending (+2.3%) and business fixed investment (+5.4%) both rising solidly.
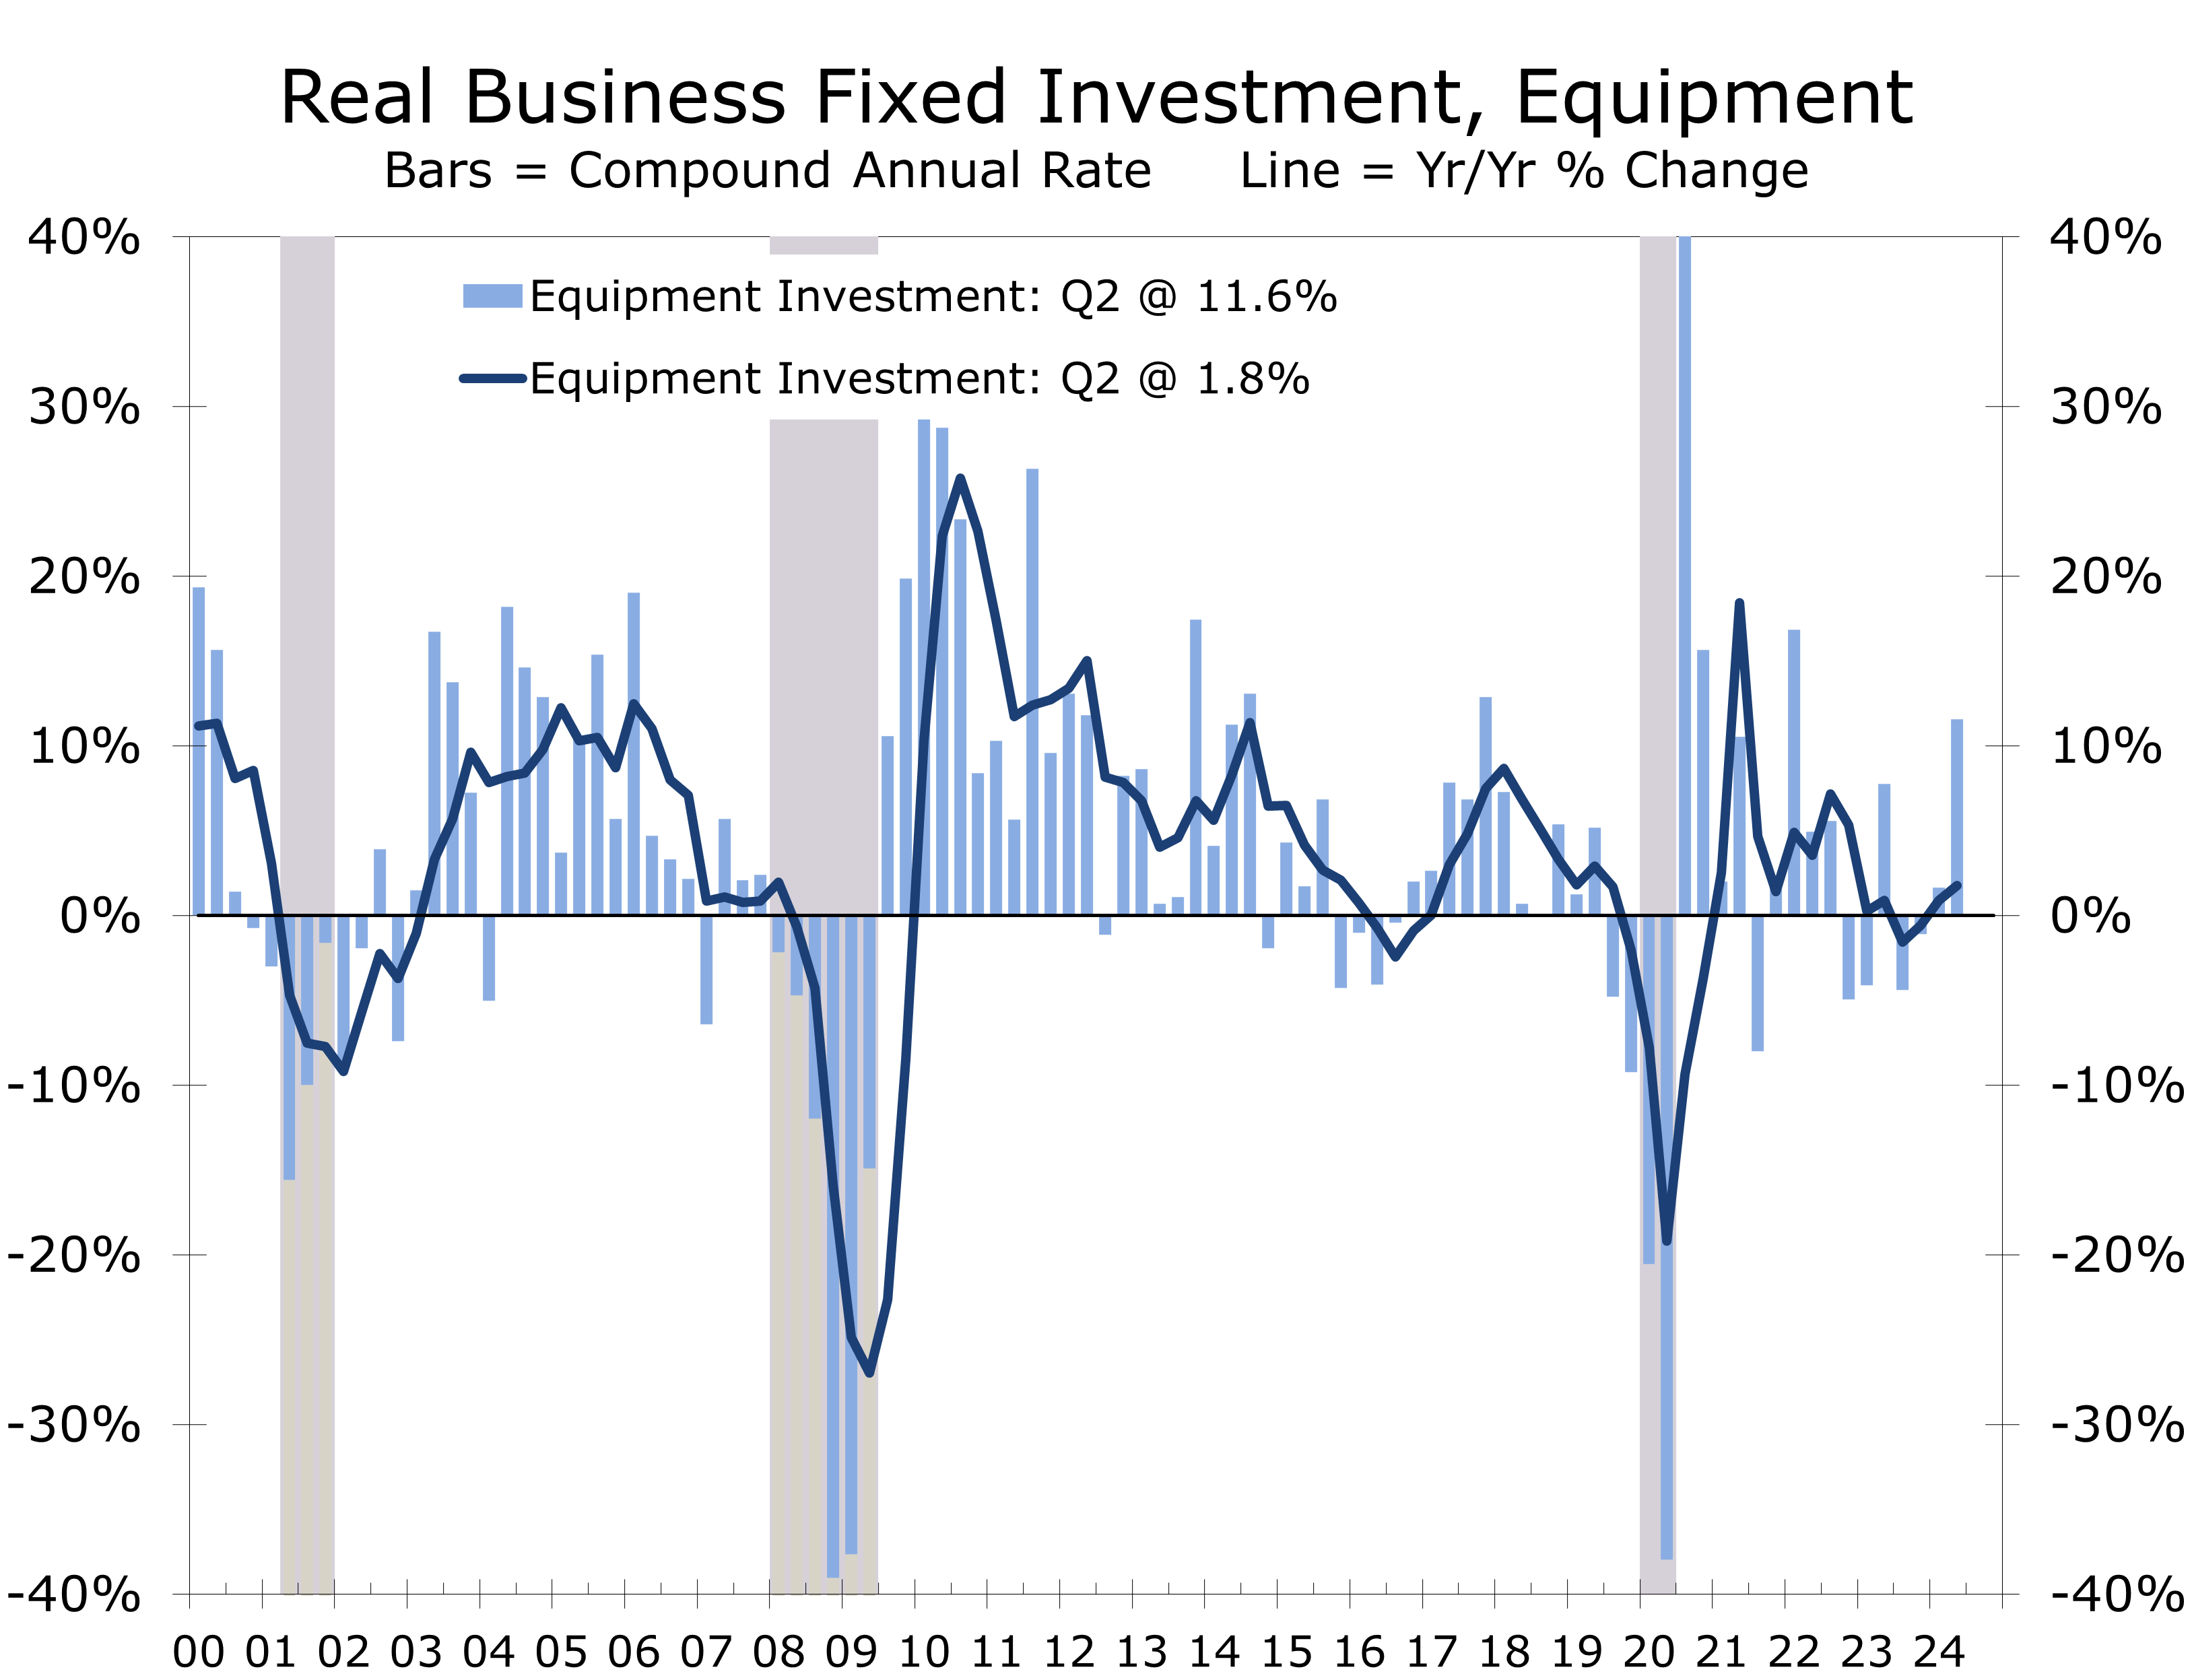
- Equipment outlays were particularly strong climbing at 11.6% annual rate.
- Residential and nonresidential construction both declined during the quarter, falling at a 1.4% and 3.3% pace, respectively.
- The strength in private domestic demand was offset by a 6.9% surge in imports, led by capital goods. The wider trade gap sliced 0.7 percentage points of Q2 growth.
- Inventory building added 0.8 percentage points to Q2. Final sales rose at a 2% pace.
- Government spending climbed at a 3.1% pace, led by a surge in defense outlays.
- The uptick in Q2 real GDP eliminates any urgency for the Fed to cut rates in July. Despite the uptick, growth is losing momentum and continues to be driven by spending for health care, travel and entertainment, and government.
Real GDP grew at a 2.8% annual rate in Q2, up from 1.4% in Q1 and exceeding the 2.0% consensus expectation. Growth was driven by a 2.3% increase in consumer spending and an 11.6% rise in business investment in capital equipment. Inventory building contributed 0.8 percentage points to GDP, reflecting efforts to mitigate potential supply chain disruptions and stay ahead of a possible Longshoreman’s strike. Additionally, government spending rose, primarily due to a rebound in defense outlays.
Consumer spending rose at a 2.3% pace in Q2. Goods purchases rebounded by 2.5%, reversing the previous quarter’s decline, while services outlays increased by 2.2%. The rise in durable goods spending was primarily driven by motor vehicles and parts, as well as spending for other big-ticket items. For nondurables, increased spending on gasoline, groceries, and pharmaceuticals led the gain.
Consumer spending rose solidly across most major categories this spring.
Services outlays were paced by another large gain in health care spending. Doctors and dentists are still doing a brisk business as people make up for appointments put off during the pandemic. Exceptionally strong demand for prescription weight-loss drugs is also likely providing a boost. Spending for housing and utilities, and recreation services also increased. The broad-based strength in consumer spending should assuage any fears that consumers are tapped out.
Business fixed investment grew at a robust 5.4% annual rate in Q2, driven by an 11.4% surge in equipment spending and a 4.5% rise in intellectual property products. These gains were partially offset by a 3.5% decline in structures investment.
Equipment spending benefited from catch-up demand due to previous shortages of key parts and materials, leading to a significant buildup in backorders. Transportation equipment surged nearly 50% annually, and IT equipment spending rose at a 10.5% rate. Future investment should be bolstered by outlays for new data centers and chipmaking equipment.
The AI boom and CHIPS act are expected to support capital spending in coming quarters.
The AI boom and the CHIPS Act are fueling a significant rise in spending on intellectual property products, with software purchases up 6.5% and R&D outlays increasing by 3.4% in Q2. This growth appears durable, even in the face of potential political changes. However, the second quarter’s rebound in equipment outlays is likely unsustainable. The surge in transportation equipment spending mainly reflects a catch-up in deliveries of commercial and military aircraft. Core capital goods orders have been trailing equipment purchases, hinting at a potential slowdown in the latter half of the year.
Investment in nonresidential structures declined at a 3.3% annual rate in Q2, following six quarters of gains. The drop reflects declines in office and warehouse projects, along with a slowdown in oil and gas exploration. The Baker Hughes RIG count declined steadily in Q2. Residential investment also fell, sliding at a 1.4% annual rate and ending three consecutive quarters of increases. Reduced new home construction and a continued drop in existing home sales, which impacted brokerage commissions, drove this decline. Spending on renovations and improvements rose, however, supported by the continued rise in home prices.
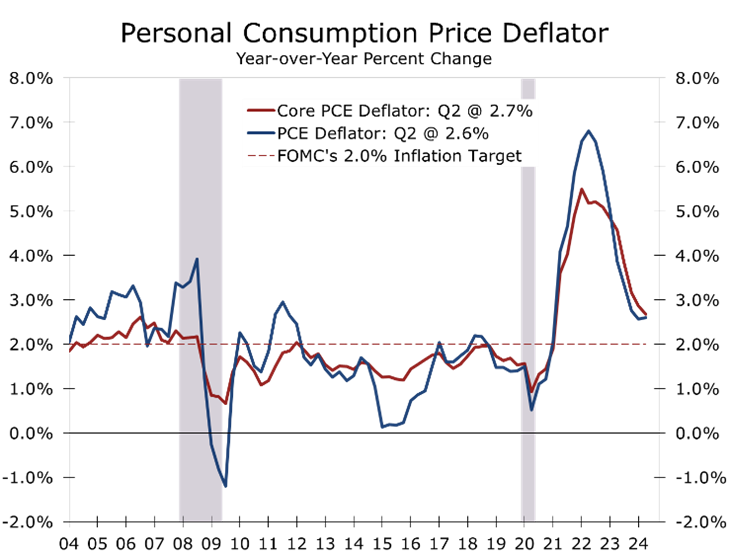
Inflation remained subdued, with the GDP price index rising at a 2.3% annual rate in Q2, down from a 3.1% pace in the first quarter. The core PCE deflator, the Fed’s preferred inflation measure, rose at a 2.9% pace, down from 3.7% in Q1. The reversal should further ease concerns that inflation might flare back up ahead of the Fed’s key decision on when to begin to cut the federal funds rate.
One caveat in the otherwise solid Q2 GDP report is that government, health care, and leisure and hospitality outlays accounted for a disproportionate share of the economy’s growth, mirroring trends in the jobs data. While there were bright spots in the more cyclical parts of the economy, these may prove fleeting as factory orders and mortgage applications continue to weaken.
Disclaimer: This publication has been prepared for informational purposes only and is not intended as a recommendation offer or solicitation with respect to the purchase or sale of any security or other financial product nor does it constitute investment advice.