Existing Home Sales Decline in July
- Existing home sales fell 2.2% in July to a 4.07 million-unit pace.
- Sales of single-family homes fell 1.9% to a 3.65-million-unit pace, while sales of condo and co-ops fell 4.5% to a 420,000 unit pace.
- Sales weakened across the country, with sales falling 5.9% in the Northeast, 3.0% in the Midwest and 2.6% in the South. Sales rose 2.7% in the West.
- Inventories of existing homes rose 3.7% in June to 1.11 million units but remain 14.6% below their year ago level.
- The median price of an existing home was $406,700, up 1.9% from a year ago. Home prices are up year-to-year for the first time in 6 months.
- July also marks only the fourth time the median price has been above $400,000.
- The typical home remained on the market for 20 days in July, which is up from 18 days in June and just 14 days in July 2022.
- Existing home sales continue to trend lower, as exceptionally lean inventories continue to favor sellers. Affordability has fallen to record lows, which should continue to pull sales lower in coming months.
Existing home sales fell once again in July, as would-be buyers continue to be thwarted by rising interest rates, higher home prices and the general lack of inventory. Sales fell 2.2% in July to a 4.07-million-unit pace. Sales of single-family homes fell 1.9%, and sales of condo and co-ops fell 4.5%.
While the decline in sales was in line with our expectations, the consensus had called for a slightly stronger pace. Sales have fallen in 16 of the past 18 months and have closely tracked pending home sales. The link between the two is strong. Pending home sales reflect signed purchase contracts for existing homes, while sales reflect actual closings. Pending home sales edged higher in June, raising hopes existing sales would hold steady or even edge higher in July.
A record low share of consumers feel that now is a good time to buy a home.
The nascent improvement in pending home sales may just need a bit more time. The lag between purchase contracts and closings is between 6 and 8 weeks, so sales may hold near their current level in August.
We would not be surprised, however, if sales continued to trend lower. Despite rising slightly in July to 66.8, the latest Fannie Mae Home Purchase Sentiment Index reported the share of consumers that feel now is a ‘good time to buy a home’ fell 4 points to 18 in July, the lowest level on record.
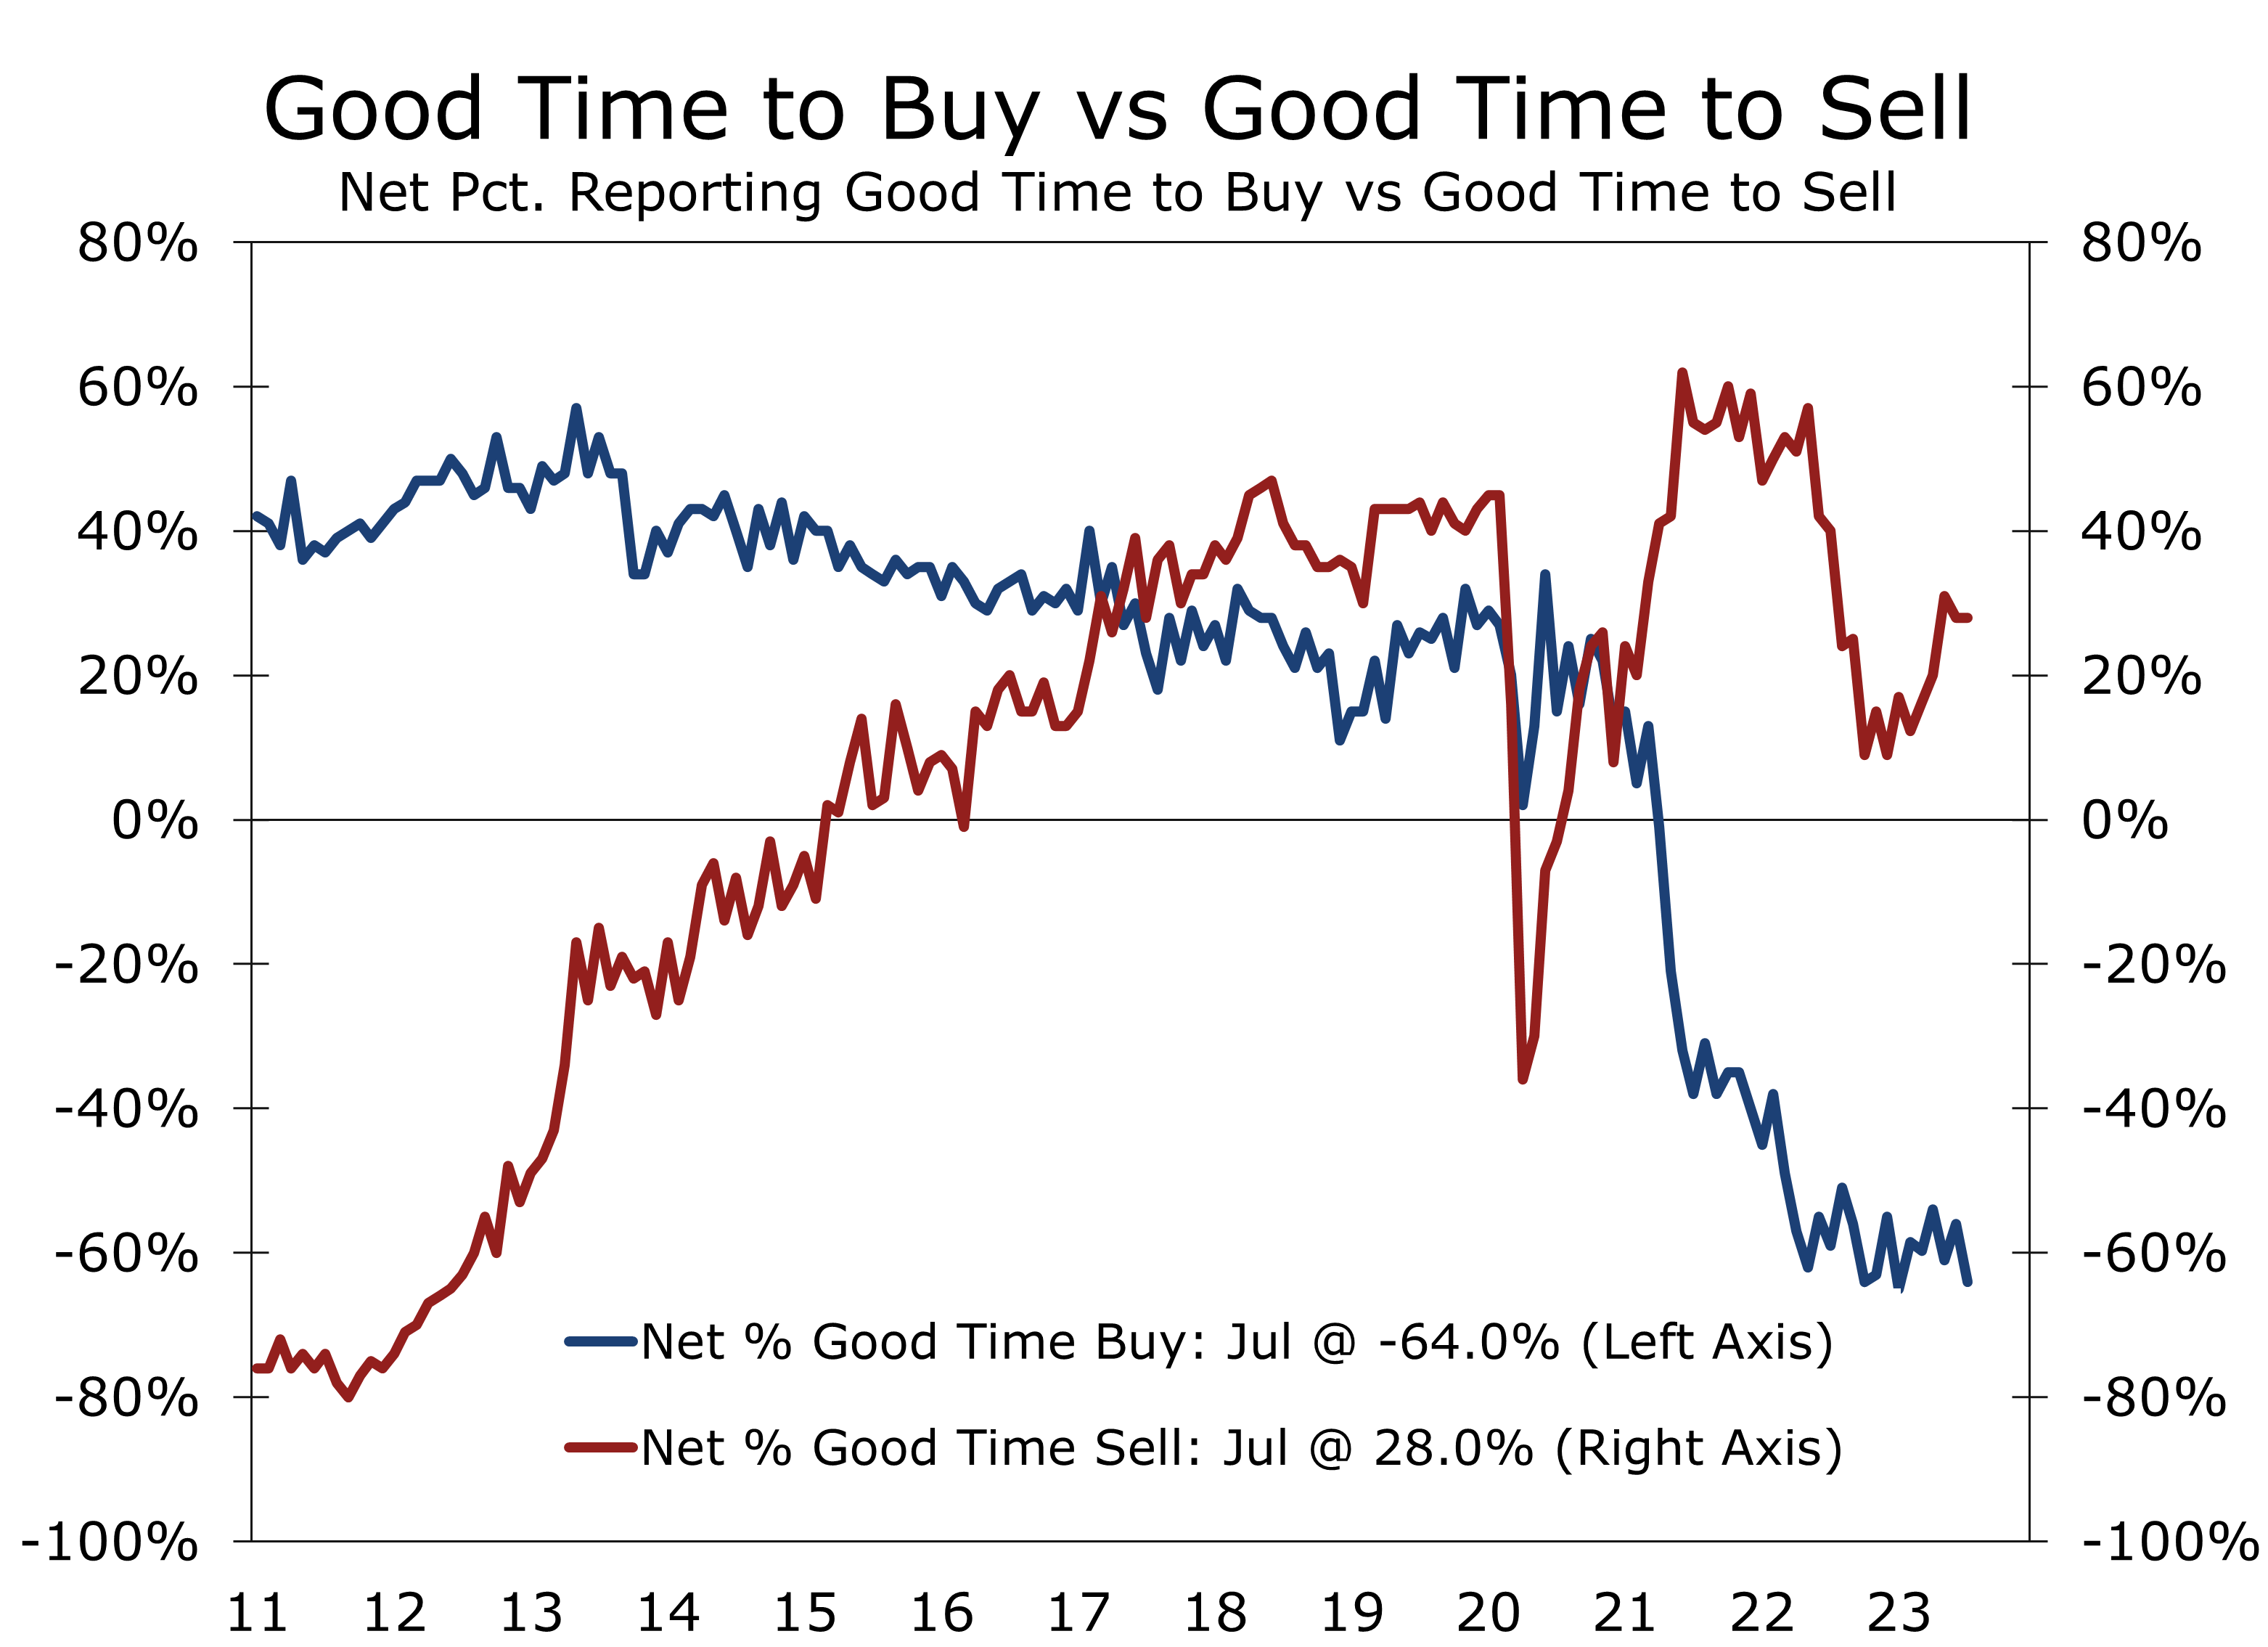
The share of respondents stating that now was a bad time to buy a home rose 4 points, climbing to 82%. The net share of respondents that feel now is a good time to buy fell 8 points to -64%, which is just 1 point shy of its all-time low.
On the flip side, the share of households that feel now is a good time to sell remained unchanged at 64%. The remaining 36% felt it was a bad time to sell. The difference between the two, or net share that feels now is a good time to sell a home, has been trending higher for the past 7 months, which closely tracks the nascent rebound in existing home inventory.
The inventory of existing homes rose 3.7% in July to 1.11 million homes. The number of existing homes available for sale hit an all-time low of 960,000 homes in December of last year and has risen 14.6% over the past 7 months. The number of homes available for sale at the end of July, however, still remains 14.6% below their year ago level.
By all accounts, we are still in a sellers’ market. At the current sales pace, the 1.11 million homes available for sale equates to a 3.3-month supply, which is up from 2.6 months in February and March. Homes are also selling quickly, with the typical home remaining on the market for just 20 days. A more normal market would have close to a 4.5-month supply and homes would remain on the market for around 30 days.

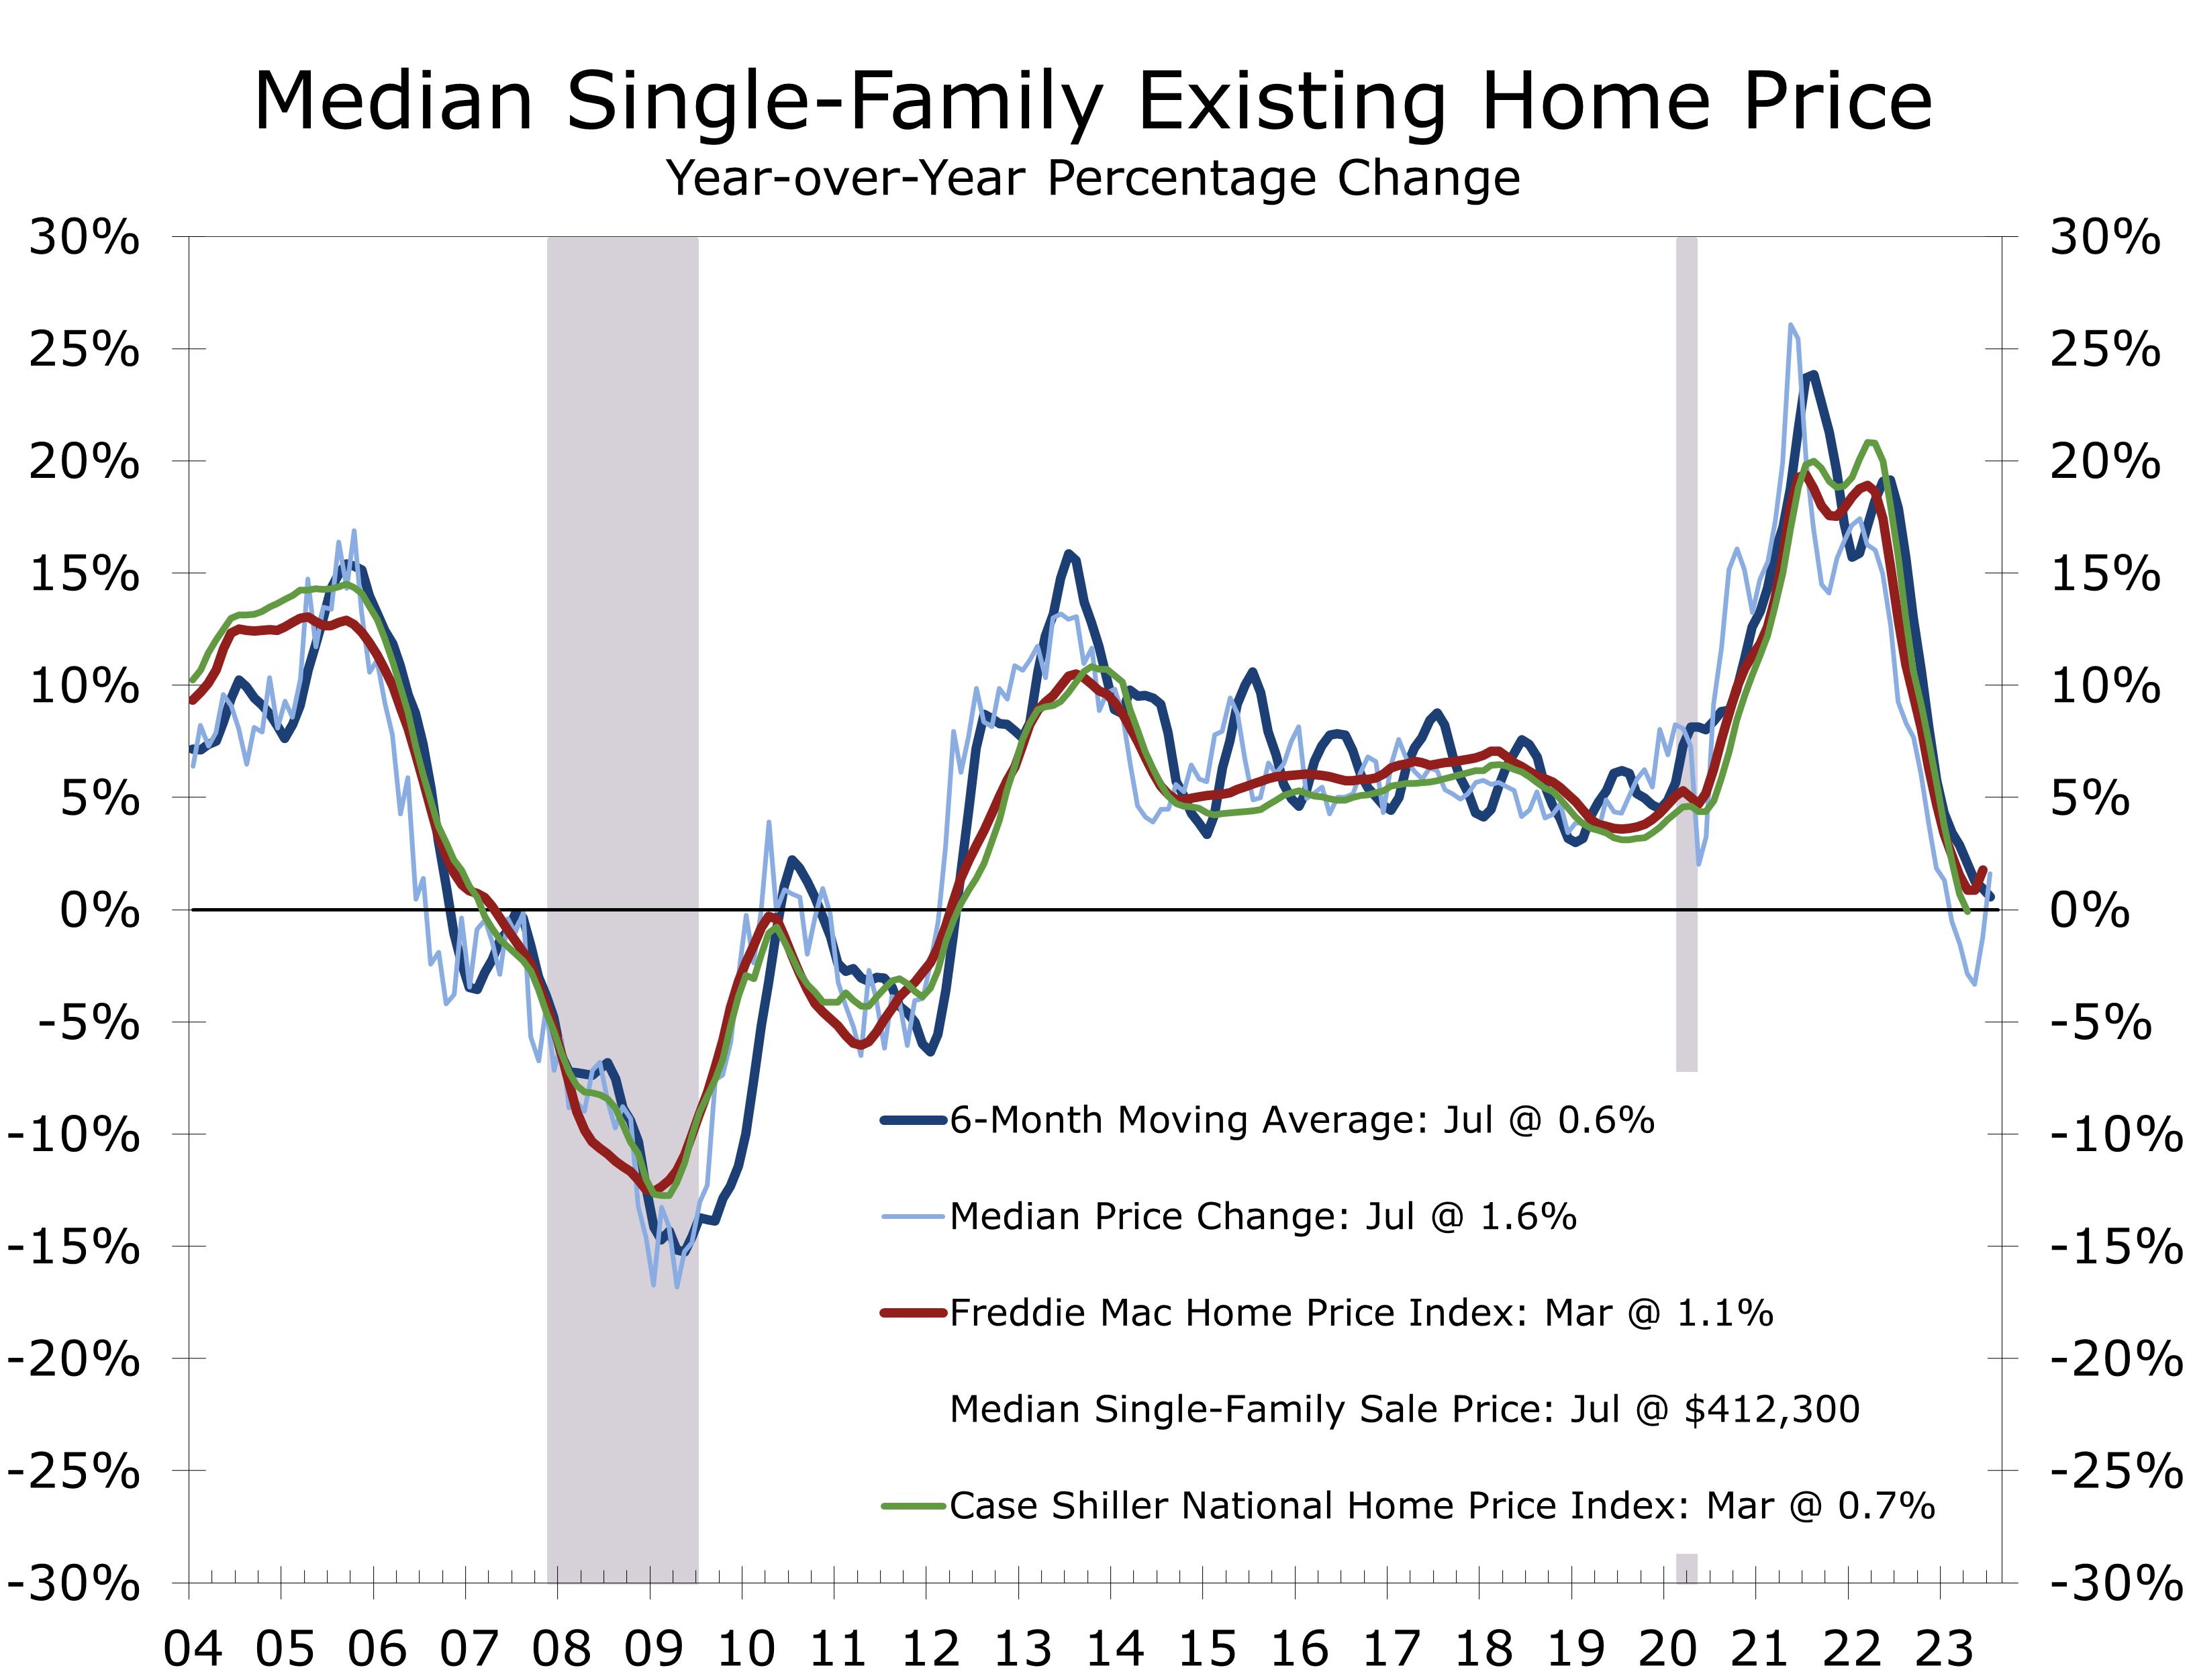
With inventories so lean, there is still intense competition for homes and prices have been pulled higher. The median price of an existing single-family home was $412,300 in July, which is 1.6% above its year ago level. The increase ends a string of 5 months of year-to-year declines.
Home buying remains constrained by lean inventories, rising mortgage rates and higher home prices. The latest affordability data from the National Association of Realtors show a home buyer purchasing a home at the median price, with a 20% down payment, would need to devote a record 28.5% of their household income to principal and interest payments. The $2,167 monthly payment has spiked 74.7% since July 2021.
Existing home sales flow through to GDP via realtors’ commissions and upgrades and repairs that occur to a home before it is put up for sale and after it is purchased. Higher home prices have bolstered commission income. The intense competition for homes, however, has meant sellers need to make fewer repairs. Some of this is being made up for by more repair work by buyers. The persistent weakness in existing home sales has contributed to the recent pullback in renovation and repair spending.
Disclaimer: This publication has been prepared for informational purposes only and is not intended as a recommendation offer or solicitation with respect to the purchase or sale of any security or other financial product nor does it constitute investment advice.